Metabolites and Drug Response
OBJECTIVES
The reader will be able to:
- State the pharmacokinetic parameters that influence the area under the metabolite concentration-time curve after a single dose and the average plasma metabolite concentration and amount of metabolite in the body following a multiple-dose regimen.
- Determine if elimination of a metabolite is rate-limited by its formation after a single intravenous (i.v.) dose of drug.
- Determine if total clearance of a metabolite is less than that of its parent drug, given plasma concentration-time data for both drug and metabolite following i.v. drug administration.
- Describe the consequence of hepatic extraction on plasma metabolite concentrations following oral administration of both high and low hepatic extraction ratio drugs.
- State the pharmacokinetic parameters that control the concentration of metabolite at plateau following administration of drug as either a constant-rate i.v. infusion or an oral multiple-dose regimen.
- Describe why elimination half-life of metabolite, and not the half-life of the drug, is the determinant of accrual of metabolite, when a constant amount of drug is initiated (loading dose) and maintained (with constant-rate infusion) in the body.
- Describe why elimination half-life of the slowest step, drug elimination or metabolite elimination, controls accrual of metabolite following drug administration either by constant-rate i.v. infusion or an oral multiple-dose regimen.
- Calculate the average plateau concentration of metabolite following an oral multipledose drug regimen, given the dosing interval and the area under the curve (AUC) of the metabolite after a single dose of the drug.
- Discuss the need to adjust the maintenance dosing rate of a drug in a patient with end-stage renal disease when all the activity (desired and adverse) resides with the metabolite under the following scenarios:
- The formation of the metabolite is the major pathway for drug elimination.
- The formation of the metabolite is a minor route of drug elimination. The major route is renal excretion.
- The formation of the metabolite is a minor route of drug elimination, but the metabolite is almost exclusively eliminated by renal excretion.
- The formation of the metabolite is the major pathway for drug elimination.
- Explain why the half-life of a drug, which is renally excreted unchanged to only a small extent and undergoes interconversion with a metabolite, can increase substantially in patients with renal function impairment.
- Calculate the apparent fraction of drug converted to a metabolite using AUC measurements of drug and metabolite after separate i.v. doses of each.
- Describe the potential influence of an active metabolite to the total response following drug administration when the metabolite is a competitive agonist with parent drug.
- Discuss the kinetic consequences of nonlinearities in the formation or elimination of a metabolite.
CONTRIBUTION OF METABOLITES TO DRUG RESPONSE
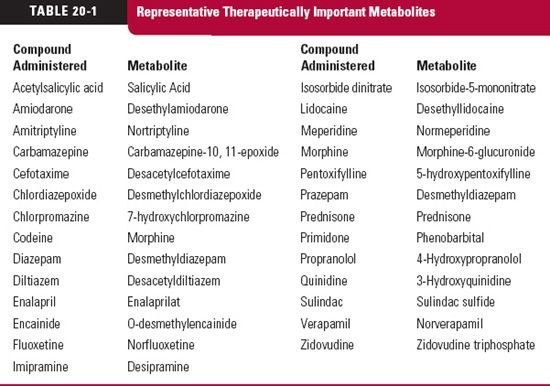
 he reason for our interest and concern with metabolites can be summed up in five words: action, toxicity, inhibition, induction, and displacement. All too often, metabolites are thought of as weakly active or inactive waste products. For many, this is so, but as seen in Table 20-1, for many others it is not. Sometimes, the agent administered is an inert prodrug, which depends on metabolism for activation. Examples are enalapril, which is hydrolyzed to enalaprilat, an active angiotensin-converting enzyme inhibitor, and prazepam, which is metabolized to the active benzodiazepine desmethyl-diazepam. Some metabolites have pharmacologic properties in common with the parent drug and augment its effect. Some metabolites have a different pharmacologic profile and may even be the cause of toxicity; whereas others are inactive but may, by acting as inhibitors, prolong or enhance the response to a drug or, as inducers, reduce the response. Still, others may affect the disposition of a drug by competing for plasma and tissue-binding sites or inhibit secretion or reabsorption in the renal tubule. It is not sufficient, however, to know that a metabolite possesses any or all of these properties. Unless a sufficient concentration exists to substantially exert any of these effects, the presence of a metabolite is of little therapeutic concern.
This chapter examines the factors that influence the kinetics of metabolites in the body and the consequences that ensue, including some aspects of pharmacodynamics. The pathways involved and the sites of drug metabolism are discussed in Chapter 5, Elimination. For purposes of clarity, unless otherwise stated, it is assumed that the body acts as a single compartment for both drug and metabolites, that all kinetic processes are first order, and that no change in plasma protein binding of either drug or metabolite occurs.
Information about a metabolite is usually obtained following drug administration. Although this information is arguably the most relevant to drug therapy, situations do arise that require more specific information on the pharmacokinetics and activity of the metabolite. Then, the metabolite must be administered separately. This chapter, however, emphasizes the pharmacokinetics and pharmacodynamics of metabolites after drug administration.
SINGLE DOSE OF DRUG
RATE-LIMITING STEP
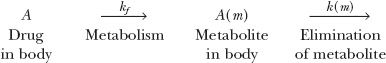
To appreciate the factors influencing the amount of metabolite in the body, A(m), with time following a single i.v. dose of drug, consider the scheme:
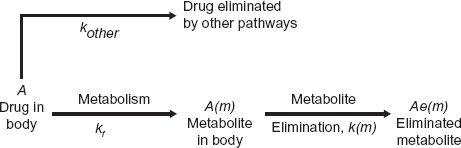
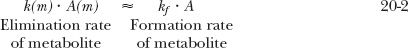
in which a fraction of drug in the body is converted to a metabolite that, in turn, is eliminated. The two steps, formation and elimination of metabolite, are characterized by the respective first-order rate constants kf and k(m). The overall elimination rate constant of drug (k) is the sum of kf and kother, the rate constant for other routes of drug elimination. Also, at any time
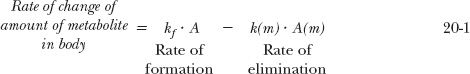
Strictly speaking, kf · A refers to rate of entry of metabolite into the systemic circulation. It may not be its rate of formation. Sometimes, a metabolite formed within an organ is further metabolized while there, so that only a fraction of the formed metabolite is released from the organ into the bloodstream. This is referred to as sequential metabolism during passage through an organ. A metabolite formed within the liver may also be excreted into the feces via the bile. For simplicity, in the subsequent discussion, only the case in which all of the metabolite formed reaches the systemic circulation is considered.
In the scheme above, either drug or metabolite elimination can rate limit the elimination of metabolite; the rate-limiting step has the smaller rate constant. Figure 20-1, displaying two semilogarithmic plots of the amounts of drug and metabolite in the body against time following a single dose of drug, shows the consequence of a rate limitation in each step.
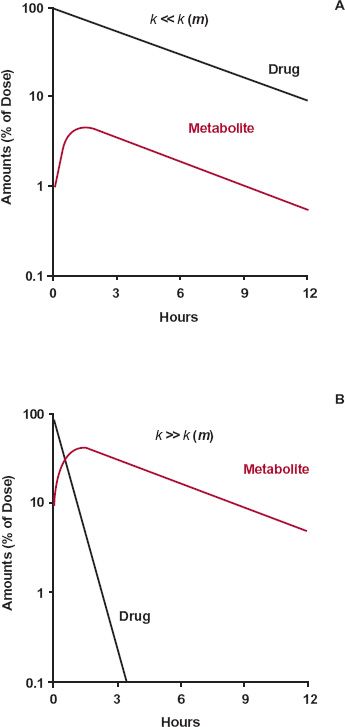
FIGURE 20-1. Consequences of a rate limitation shown in semilogarithmic plots of drug and metabolite. A. When the elimination rate constant of the drug is smaller than that of metabolite, k << k(m), metabolite (colored line) declines in parallel with the drug (black line). B. Conversely, when the elimination-rate constant of metabolite is smaller than that of drug, k << k(m), metabolite (colored line) declines more slowly than drug (black line). In the former case (A), decline of metabolite is governed by elimination of drug and, in the latter case (B), by its own elimination. The graphs are simulated using kf, kother, and k(m) values of 0.2, 0, and 2 hr-1, respectively, in the former case, and 2, 0, and 0.2 hr-1, respectively in the latter.
A rate limitation in drug elimination, the most common situation, has several consequences (Fig. 20-1A). First, the half-life of the metabolite appears to be the same as that of the drug, but it is much longer than that seen when administered separately. Second, there is always more drug than metabolite in the body. Last, metabolite elimination is formation rate-limited (i.e., metabolite is cleared so rapidly that during its decline phase, whatever is formed is almost immediately eliminated). Approximately, therefore
and on rearranging,

In this case, the metabolite declines with the same half-life as the drug. Obviously, throughout the decline phase, the rate of elimination of metabolite exceeds that of its formation; otherwise, the amount of metabolite would not decline. But the difference in the rates is small.
A metabolite accrues substantially in the body only when its elimination is the slower step. That is, the half-life of metabolite is longer than that of the drug. When this occurs, most of the drug is eliminated by the time the metabolite peaks; decline of metabolite is subsequently controlled by its elimination half-life.
In Eqs. 20-1 to 20-3, k(m) refers to the rate constant for metabolite elimination. Just how many pathways are involved in metabolite elimination is not important. What is important is to know whether drug or metabolite elimination is the rate-limiting step. In any sequence, substances formed beyond the rate-limiting step decline with the half-life of this slowest step. To emphasize this point consider the following scheme:
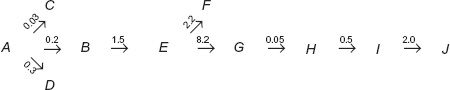
in which A refers to the drug, B, E, G, H, and I refer to sequentially formed metabolites, J is the excreted metabolite I, and the number above each arrow is the value of the respective rate constant in hr−1.
Question: What is the rate-limiting step in the entire sequence?
Answer: Elimination of metabolite G, terminal elimination half-life (t1/2) = 0.693/0.05 = 13.9 hr.
Question: What are the terminal half-lives for decay of A, B, E, H, and I from the body following administration of drug?
Answer: Elimination of A rate-limits decline of B and E, t1/2 = 0.693/(0.03 + 0.2 + 0.3) = 1.31 hr for all three components. Elimination of G rate-limits terminal decline of H and I, t1/2 = 0.693/0.05 hr−1 = 13.9 hr.
Occasionally, the half-lives of drug and metabolite are comparable, and then neither step is rate-limiting. However, metabolite declines somewhat more slowly than anticipated from its half-life, because some drug remains to sustain the level of metabolite throughout its elimination.
PLASMA CONCENTRATION
The preceding discussion, helpful in realizing the importance of rate-limiting steps, deals with amounts of drug and metabolite in the body. However, plasma concentrations are measured and are of greater interest. Furthermore, in most cases, a metabolite has not been cleared for human use by regulatory authorities to permit determination of its volume of distribution, and therefore, its amount in the body. However, much can be gained from clearance concepts, as illustrated in several examples.
The first example concerns methylprednisolone. Owing to its low solubility, formulation of an i.v. preparation is difficult. Yet, clinical situations (e.g., treatment of shock) sometimes demand rapid input of this steroid. One solution has been to administer the water-soluble hemisuccinate ester, which is rapidly hydrolyzed to methylprednisolone by esterases within the body. Shown in Fig. 20-2 are the plasma concentrations of both the hemisuccinate and methylprednisolone following an i.v. bolus dose of the ester. It is readily apparent that the hemisuccinate is so rapidly hydrolyzed to steroid that elimination of methylprednisolone in its decline phase is not rate-limited by its formation.
These data also permit the conclusion to be drawn that the clearance of methylpred-nisolone (metabolite), CL(m), is much lower than that of its hemisuccinate. The argument is as follows:
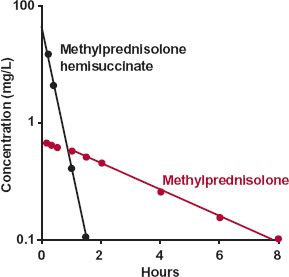
FIGURE 20-2. Displayed semilogarithmically are the plasma concentrations of methylprednisolone ( ) and its water-soluble hemisuccinate ester (
 ) following an i.v. bolus injection of 80 mg of the ester; mean of 11 subjects. The decline of methylprednisolone (t1/2 = 2.7 hr) is rate-limited by its disposition, not by the disposition of its hemisuccinate ester (t1/2 = 0.25 hr). The clearance of methylprednisolone is lower than that of its hemisuccinate, a conclusion drawn from the observation (seen on a corresponding linear plot) that the AUC of methylprednisolone is the larger of the two. (From: Derendorf H, Mollmann H, Rohdeward P, et al. Kinetics of methylprednisolone and its hemisuccinate ester. Clin Pharmacol Ther 1985;37:502–507.)
At any time,
where CLf is the clearance associated with the hydrolysis of the hemisuccinate ester to methylprednisolone, sometimes referred to as the formation clearance, CL(m) is the total clearance of this metabolite, and C and C(m)are the respective plasma concentrations of drug and metabolite.
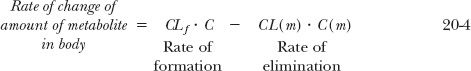
Integrating the foregoing equation after a single i.v. dose of drug gives the amount of metabolite in the body with time. Because no methylprednisolone is present in the body initially or at infinity, it follows, upon integrating Eq. 20-4 between these time limits, that

where AUC(m) and AUC are the total areas under the metabolite and drug concentration-time profiles, respectively. Substituting fm · CL for CLf, where fm is the fraction of an i.v. dose of drug converted to systemically available metabolite, the following relationship is obtained:

Returning to Fig. 20-2, the data suggest that the area for methylprednisolone (AUC[m]) is greater than that for the administered ester (AUC). Calculation confirms this; the respective areas are 3.9 and 2.1 mg-hr/L. Accordingly, because the value of fm cannot exceed unity, the clearance of methylprednisolone must be less than that of its ester. If the ratio of areas had been less than 1, then the ratio of the total clearance values cannot be assessed unless the value of fm is known. Had fm been smaller than the ratio of areas, the ratio of clearances could have been greater than one. Because no knowledge of the amount of drug in the body is necessary to arrive at the above conclusions, this area method of interpreting metabolite data can be extremely useful, especially in cases of drug poisoning in which the amounts ingested and absorbed are frequently unknown.
The second example deals with propranolol. Based on the data in Fig. 20-3, obtained after giving propranolol intravenously, the drug has the following characteristics: total clearance, 1.1 L/min; volume of distribution, 380 L; and elimination half-life, 4 hr. Other data suggest that almost the entire dose is metabolized in the liver. Metabolites of propranolol include one or more glucuronides and naphthoxylactic acid, which was measured specifically in this study. What can be learned from the data displayed semilogarithmically in Fig. 20-3?
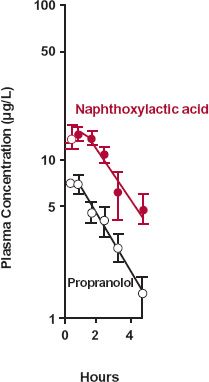
FIGURE 20-3. Semilogarithmic plot of the plasma concentrations of propranolol ( ) and of one of its metabolites, naphthoxylactic acid (
 ), (mean ± SEM) after a single i.v. dose of 3.7-mg propranolol to three subjects. Note that the elevated metabolite concentration declines in parallel with parent drug because of a lower total clearance and a smaller volume of distribution of naphthoxylactic acid compared with propranolol. For a strict comparison, the naphthoxylactic acid should be expressed in propranolol equivalents, but the difference in their molecular weights (260 and 284 g/mol, respectively) is small. (From: Walle T, Conradi EC, Walle K, et al. Naphthoxylactic acid after single and long-term doses of propranolol. Clin Pharmacol Ther 1979;26:548–554. Reproduced with permission of Mosby CV.)
From considerations of areas of drug and metabolite, one must conclude that the clearance of naphthoxylactic acid is much lower than that of propranolol. However, the parallel decay of metabolite and drug indicates that elimination of this metabolite is rate-limited by its formation. Hence, the elimination half-life of this more polar metabolite must be shorter, and amount in the body always lower than that of the parent drug (see Fig. 20-1A).
The only explanation consistent with these observations is that volume of distribution of metabolite, V(m), must be smaller than that of parent drug by a factor even greater than the ratio of clearance values. This conclusion follows from a comparison of the elimination-rate constants for metabolite and drug:
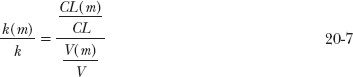
For k(m)/k to be greater than 1, the ratio V(m)/V must be smaller than CL(m)/CL. Confirming this conclusion is a concentration of metabolite much higher than that of the parent drug (see Fig. 20-3), despite a much lower amount of metabolite in the body when elimination of metabolite is formation rate-limited (see Fig. 20-1A). The findings with propranolol are quite commonly encountered, particularly with basic drugs that are converted to acidic metabolites. The volumes of distribution of basic drugs are often in excess of 100 L (1.4 L/kg), whereas those of their acidic metabolites are closer to 10 to 20 L (0.14–0.30 L/kg). These metabolites not only are more polar and tend to bind less to tissue constituents than the parent drug, but also are bound more strongly to albumin, thereby further restricting their tissue distribution.
Kinetically, giving an i.v. bolus of drug and measuring the plasma metabolite concentration is similar to giving an oral dose of drug and measuring its plasma concentration. In both situations, the appearance and disappearance of species (metabolite in one case, drug in the other) are monitored after placing a bolus dose in the preceding compartment; thus,
Formation and elimination of metabolite after i.v. bolus of drug
Absorption and elimination of drug after a single oral dose
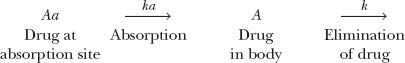
Recall from Chapter 6, Kinetics Following an Extravascular Dose, that the peak plasma concentration of a drug given extravascularly reflects the balance between rates of drug absorption and elimination. Correspondingly, the 1.5 to 2 hr required for naphthoxylactic acid to reach a peak in Fig. 20-3 reflects the balance between its rates of formation and elimination.
The last example concerns tolbutamide, an effective oral hypoglycemic agent. This drug is extensively metabolized to hydroxytolbutamide, which, although active, is therapeutically unimportant. As seen in Fig. 20-4, the concentrations of hydroxytolbutamide are so low that they never augment the effect of tolbutamide. One possible explanation
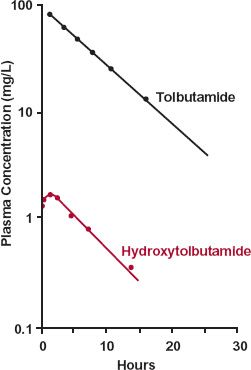
FIGURE 20-4. A subject receives a 1-g i.v. bolus of tolbutamide. The concentration of tolbutamide in plasma falls with a half-life of 4 hr. Although oxidation to hydroxytolbu-tamide is almost obligatory for tolbutamide elimination, the plasma concentration of this metabolite is always very low, owing to its extremely high clearance. As a consequence, because the volumes of distribution are similar (0.15–0.30 L/kg), k(m) > k, oxidation of tolbutamide rate-limits hydroxytolbutamide elimination. (From: Matin SB, Rowland M. Determination of tolbutamide and metabolites in biological fluids. Anal Letters 1973;6:865–876.)
for the low concentration of metabolite is that little is formed. However, in the case of tolbutamide, based on urinary recovery, almost all the drug is converted to hydroxytolbu-tamide. That is, fm is close to 1. Accordingly, the 20-fold ratio of drug and metabolite areas reflects a corresponding ratio in total clearance values, with that of hydroxytolbu-tamide being the much higher of the two.
IMPACT OF HEPATIC EXTRACTION
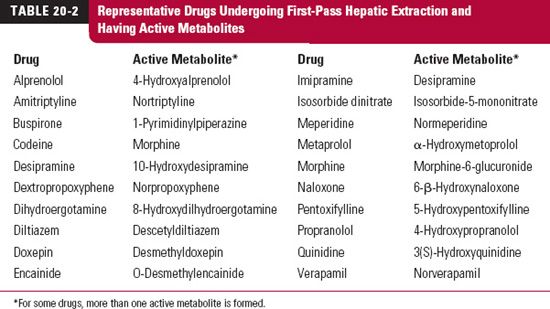
Ingesting drugs that are cleared by the liver is like taking a mixture of drug and metabolite. The reason, as mentioned in Chapter 2, Fundamental Concepts and Terminology, is that all ingested drug must pass through the liver before entering the general circulation. The composition of the mixture leaving the liver depends on the hepatic extraction ratio of the drug. When the extraction ratio is high, metabolism during absorption is extensive, and the situation comes close to that of administering just metabolite. Table 20-2 lists some drugs undergoing extensive first-pass hepatic elimination and forming active metabolites. Caution must be taken against attempting to relate plasma drug concentration alone to effect following oral administration of such drugs.
To appreciate the impact of first passage of drug through the liver on the plasma concentration of metabolite, consider the data in Fig. 20-5 obtained following oral administration of propranolol. Compared with the situation following an i.v. dose (see Fig. 20-3), the naphthoxylactic acid-to-propranolol concentration ratio is much higher, and the metabolite concentration peaks as early as the parent drug. These observations are understood by examining the following scheme:
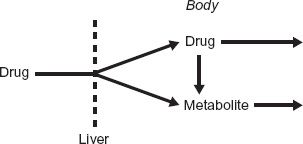
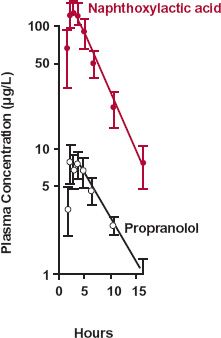
FIGURE 20-5. Semilogarithmic plot of the plasma concentrations of propranolol ( ) and naphthoxylactic acid (
 ), (mean ± SEM) after a single 20-mg oral dose of propranolol to five subjects. As a consequence of extensive hepatic metabolism, only a small fraction of the dose is absorbed intact. The remainder appears as metabolites, such as naphthoxylactic acid, which reaches a peak value at the same time as propranolol, 1.5 to 2 hr after drug administration. For a strict comparison, the naphthoxylactic acid should be expressed in propranolol equivalents, but the difference in their molecular weights (260 and 284 g/mol, respectively) is small. (From: Walle T, Conradi EC, Walle K, et al. Naphthoxylactic acid after single and long-term doses of propranolol. Clin Pharmacol Ther 1979;26:548–554. Reproduced with permission of Mosby CV.)
As anticipated from its high hepatic clearance and confirmed by comparing AUC
Stay updated, free articles. Join our Telegram channel

Full access? Get Clinical Tree


