Fig. 11.1.
Detection of the translocation t(14;18) by FISH. Fluorescent probes specific for BCL2 (red), IGH (green), and the chromosome 18 centromere (aqua = control) were hybridized to tumor cell spreads. Panel (A) depicts a “negative” sample, each cell showing two distinct signals of each color. Panel (B) is a follicular lymphoma sample with each cell showing two abnormal yellow (BCL2-IGH) fusion signals. The yellow signal is the result of the juxtapositioning of the red (BCL2) and green (IGH) immediately adjacent to one another as the result of the t(14;18).
Basic Technical Steps
♦
Fresh tissue, formalin-fixed paraffin-embedded tissue, cell suspension, smears, touch imprints, and cytospins are all acceptable for FISH analysis
♦
FISH probes are typically DNA fragments cloned into yeast or bacterial artificial chromosomes – with a color-specific fluorescent label attached. The probes are designed to hybridize to specific regions/genes or segments of chromosomes
When they are designed to hybridize to repetitive DNA sequences located near chromosome centromeres, they are used for chromosome identification and enumeration. A loss of a centromere generally indicates the loss of an entire chromosome
To determine if specific genes are amplified, translocated, or deleted, probes should be designed to hybridize to unique sequences
With locus-/gene-specific probes, there are two fluorescent signals in a normal cell, corresponding to the chromosome pairs. The double dots represent the signals from each of the two aligned sister chromatids
To study chromosome translocations, probes are typically designed as either dual-color single-fusion probes, dual-color break-apart probes, or dual-color dual-fusion probes (descriptions below)
Dual-color single-fusion probes are useful in detecting high percentages of cells possessing a specific chromosomal translocation. The DNA probe hybridization targets are located on one side of each of the two genetic breakpoints (e.g., one probe labeled in orange and one in green). A nucleus lacking the translocation will exhibit a two-orange, two-green signal pattern. In a cell harboring the translocation, one orange, one green, and one orange/green (yellow) fusion signal pattern will be observed
Dual-color break-apart probes are designed to be on opposite sides of the translocation breakpoint for a given gene, each labeled in a different color (red and green). These probes generate signals in normal cells that are closely matched in size and co-localized (two fusion). Following a translocation, the signals are “broken apart” and no longer co-localize (one red, one green, one fusion). Dual-color break-apart probes are used in cases where there may be multiple translocation partners associated with a known genetic breakpoint
Dual-color dual-fusion probes are designed to span the breakpoint of the genes involved in the translocation. These probes are visually distinct in normal cells (two red, two green) and appear merged by the specific translocation event (two fusion, one red, one green)
Chromosome enumeration probe and locus-specific indicator probes are often used together
A mix of probes (often with different colors) can be used to paint the entire length of 1 or more chromosomes
Benefits
♦
FISH is a molecular tool to evaluate intact cells for rather gross genetic changes using fluorescently labeled DNA or RNA probes. Specific genetic changes can be visualized in situ, at the single-cell level, in the context of tissue morphology, offering a great benefit in anatomic pathology
♦
FISH can be specifically ordered based on clinical history (targeting a specific genetic alteration), but it is often performed as a reflex “screening” test based on the initial karyotyping result or pathology evaluation
♦
Pathologists can order FISH studies with an individual probe or a panel of probes based on their initial histopathology evaluation, a very cost-effective way of applying genetic/molecular technology in diagnostic pathology
♦
Pathologists should select the specific area of the histology slide for FISH analysis based on the lesion distribution identified morphologically, in order to achieve the highest possible sensitivity and to correlate the potential cytogenetic abnormality with the histopathology of diagnostic interest. FISH data can be analyzed coordinately with morphology
♦
FISH can offer a quantitative correlation with flow cytometry, because both methods report abnormal cell percentages
♦
The quick turnaround time allows timely integrated diagnosis in the pathology reports
Limitations
♦
A low percentage of abnormal cells identified by FISH is not always diagnostic and should be interpreted with caution
Example
♦
BCR–ABL1, for t(9;22). FISH can be used for both diagnosis and posttreatment disease monitoring
Array Comparative Genomic Hybridization
Basic Technical Steps
♦
It is based on comparative genomic hybridization (CGH) by comparing the quantitative locus- or gene-specific DNA copy number of a patient versus a normal control individual (or individuals) to assess DNA copy number gains or losses
♦
Bacterial artificial chromosome (BAC) clones containing locus- or gene-specific human genomic DNA (gDNA) or oligonucleotides are typically immobilized onto a solid support (a glass slide or glass beads) at a very high density. These arrays can be designed to cover specific loci/chromosomes or the entire genome
♦
Based on differential hybridization of patient-derived DNA and normal reference DNA (both are fluorescently labeled with different color) to the array spots, aberrations of gene copy number (gains or losses) can be detected
Benefits
♦
Requires only good, high-quality DNA. Dividing cells and tissue culture are not necessary
♦
Traditional CGH to metaphase chromosome spreads can provide only limited resolution at the 5–10 Mb level
♦
Array CGH can detect nonrandom chromosome copy number aberrations often masked under complex karyotypes
♦
It detects a pathogenic copy number change in 15–20% of patients, increasing the diagnostic yield approximately four- to fivefold over chromosome studies alone
♦
It has emerged as the American College of Medical Genetics and Genomics (ACMG)-recommended first-tier postnatal test for evaluating a patient with multiple anomalies not specific to a well-delineated genetic syndrome, apparently nonsyndromic developmental delay/intellectual disability, and autism spectrum disorders
Limitations
♦
Unable to detect balanced structural rearrangements (i.e., balanced translocations, inversions, insertions), small insertions/deletions, or DNA sequence variants
♦
It does not provide information about the structural nature of an imbalance
♦
Not sensitive to detect mosaicism (i.e., copy number changes in some but not all cells) of 20% or less
Polymerase Chain Reaction (PCR) (Fig. 11.2)
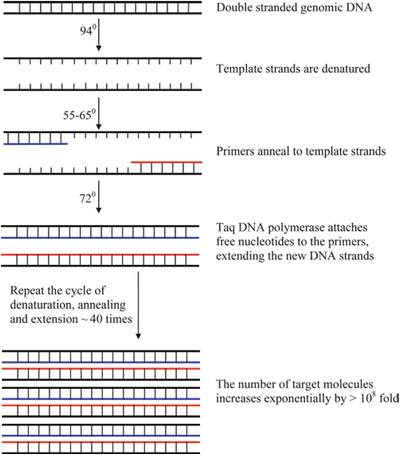
Fig. 11.2.
Schematic representation of the polymerase chain reaction (PCR). Through repeated cycles of heating and cooling, Taq polymerase makes multiple copies of a specific target sequence, using gene-specific primers and free nucleotides (dNTPs).
Basic Technical Steps
♦
Genomic DNA or RNA is extracted from unfixed or fixed tissue or cells
♦
For RT-PCR, complementary DNA (cDNA) is made from RNA extracted from the tissue or cells
♦
Targeted DNA will be amplified via multiple rounds of reaction of a three-temperature cycle:
95°C denatures the two DNA strands
55–65°C allows primers to anneal to template
72°C allows the polymerase to extend the primers into a full-length product encompassing the region between the two PCR primers
♦
Each cycle of PCR theoretically doubles the amount of product amplicon
♦
PCR products can be separated in a size-specific manner by agarose gel or capillary electrophoresis. The expected size of the PCR product is based on the targeted DNA fragment length between the two primers
Benefits
♦
It requires only nanogram (ng) quantities of intact or partially degraded DNA (or RNA) derived from blood, fresh frozen tissue, or fixed tissue
Requires only >102–105 cells
Useful for smaller biopsies or fine-needle aspiration material
Tissues can be trimmed of “non-tumor” tissue to increase diagnostic sensitivity
♦
The gene of interest is enzymatically amplified >108-fold over background using primers (short target-specific oligonucleotide), dNTPs, and a thermostable DNA polymerase
♦
It is useful for detecting point mutations, small insertions, or deletions
♦
Differences in size between patient and control samples can be accurately measured
♦
Entire process can be completed in several hours. Rapid result – often same day as biopsy
Limitations
♦
Due to its extreme sensitivity, false-positive results can occur (from contamination by previously generated amplification products)
Example
♦
Detection of a deleterious insertion mutation in the FLT3 gene in AML
♦
PCR is used in conjunction with several other methodologies, such as restriction fragment length polymorphism (RFLP), real-time PCR product detection (real-time PCR), fluorescence resonance energy transfer (FRET), high-resolution melt (HRM), and DNA sequencing (see following)
♦
Almost every molecular diagnostic approach (except Southern blot) utilizes PCR in some way
PCR-Restriction Fragment Length Polymorphism
Basic Technical Steps
♦
PCR products are digested with a specific restriction enzyme that detects a known stretch of sequence (wild type or mutant) within the gene of interest. If a mutation creates or destroys a restriction enzyme site, it can then be detected
♦
Digested PCR fragments are visualized and accurately sized by agarose gel or capillary electrophoresis. The pattern (sizing) of fragment sizes indicates the presence or absence of the specific nucleotide change
Benefits
♦
Works well for detecting previously characterized single-nucleotide changes
♦
It is technically simple to perform
♦
It requires common laboratory equipment
Limitations
♦
It does not detect novel, uncharacterized alterations
♦
It is possible for a nonpathologic nucleotide change near the one of interest to similarly affect enzyme digestion patterns and result in a false-positive result
Example
♦
Polymerase chain reaction (PCR): Detection of the Factor V Leiden R506Q mutation causing thrombophilia (Fig. 11.3)
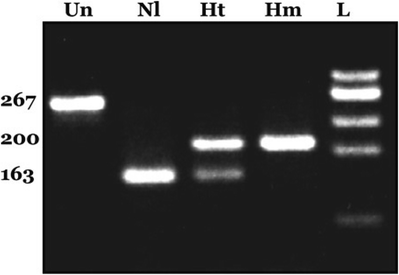

Fig. 11.3.
Representative factor V Leiden PCR–RFLP gel. Samples were PCR amplified and digested with the restriction enzyme MnlI. Fragments were separated by size via agarose gel electrophoresis. Un undigested PCR product, Nl homozygous normal, Ht heterozygous, Hm Factor V Leiden homozygous, L DNA ladder used for size comparison. Numbers on the left indicate fragment sizes in base pair.
PCR-Fluorescence Resonance Energy Transfer (Fig. 11.4)
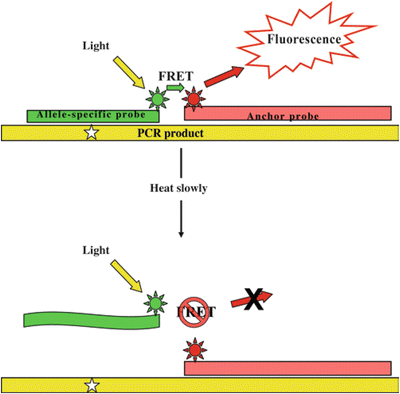
Fig. 11.4.
PCR–FRET. After PCR amplification, a fluorescence signal is only detected when the allele-specific probe and anchor probe are both annealed to the PCR product. As samples are slowly heated, the shorter allele-specific probe denatures, and signal is lost. The temperature at which this happens (the melting temperature) indicates either a perfect match between the probe and the target (wild type) or a single mismatch (mutation). The star represents the nucleotide of interest.
Basic Technical Steps
♦
Real-time PCR is performed in the presence of two fluorescently labeled oligonucleotide probes, one of which is specific for a well-characterized single-nucleotide variant (SNV) of interest
♦
During the annealing phase of PCR, the two labeled probes hybridize to the site of the SNV and emit a fluorescent signal that is only possible when both probes are bound to the same DNA template
♦
After PCR cycling is completed, the samples are slowly heated, and the temperature at which the allele-specific probe denatures from the target (and fluorescent signal is lost) is monitored and indicates the presence or absence of the SNV of interest. The allele discrimination is based on the principle that mismatched hybrids will disassociate (melt) at a lower temperature than perfectly matched hybrids
Benefits
♦
The entire assay (PCR and mutation detection) can be completed in less than 2 h
♦
The assay can be designed such that a neighboring nonpathologic alteration will not be confused with the SNV of interest
Limitations
♦
Fluorescently labeled probes are expensive
Example
♦
Detection of the HFE C282Y and H63D mutations resulting in hereditary hemochromatosis (Fig. 11.5)
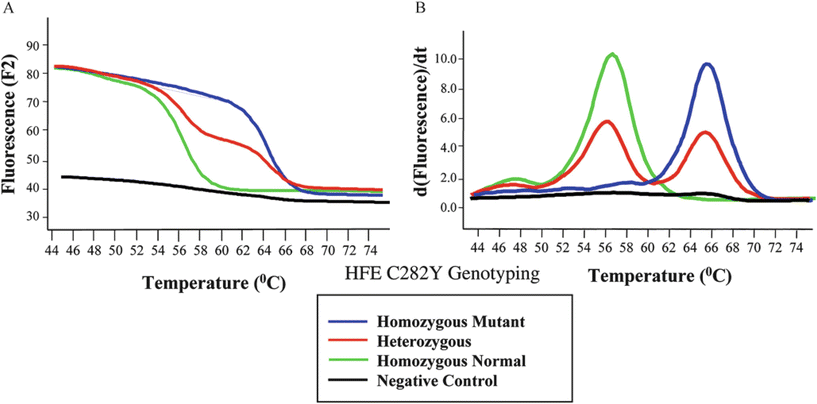

Fig. 11.5.
Hemochromatosis (HFE gene) FRET data for three genotypes and a negative control. Melting curves (A) indicate that different genotypes lose fluorescent signal at different temperatures. The first derivative data yields melting peaks (B), which are more straightforward to interpret.
PCR High-Resolution Melt Mutation Analysis (Fig.11.6)
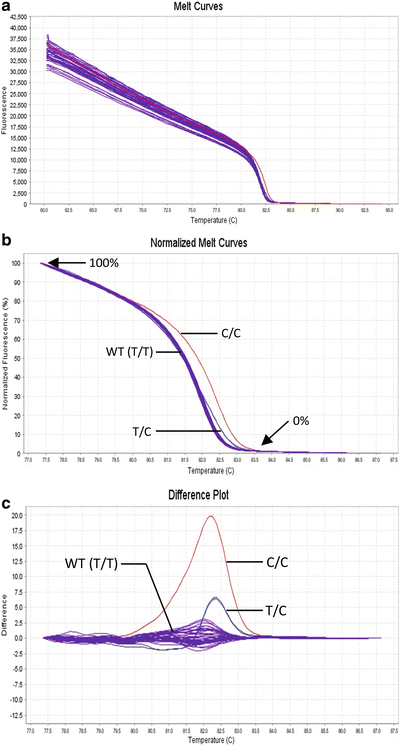
Fig. 11.6.
High–resolution melt analysis. High-resolution melt curves collected” from the real-time PCR instrument (A). Wild-type (T/T), heterozygous (T>C), and homozygous (C/C) single-nucleotide changes can be easily distinguished in the normalized melt curves (B) and derivative difference plots (C). The difference plots are another mathematical presentation of the same normalized melt curve data. Several control samples of wild-type (WT) sequence need to always be run to establish the “normal” melting curve shape. The difference between the normal melting curves and each of the patient samples is plotted on the difference plot.
Basic Technical Steps
♦
PCR amplification is performed in the presence of an intercalating fluorescent dye which generates a fluorescent signal when binding to double-stranded (but not single-stranded) DNA
♦
After PCR amplification is complete, a high-resolution DNA melt curve will be generated for each PCR reaction. It collects the progressively decreasing fluorescent signal of the intercalating dye as the temperature increases and the double-stranded DNA is converted (melts) into single-stranded DNA
♦
A melt curve deviation from the normal reference curves (of control DNA with wild-type sequence) suggests a sequence change in the patient sample
♦
After a positive HRM screen, another mutation detection method, typically Sanger sequencing, needs to be performed to confirm the exact identity of the sequence change inferred from HRM analysis
Benefits
♦
HRM is fast, simple, and cost-effective. It is a closed system, and there is no need to open the PCR reactions to begin the subsequent HRM data collection
♦
It is a good method for detecting rare but heterogeneous sequence variants in a short DNA segment (typically an exon of a gene)
♦
PCR products generated for HRM analysis can be used directly for reflex Sanger sequence confirmation. It saves time and resources to not have to do another PCR for Sanger confirmation
Limitations
♦
It is a mutation/variant screening technology. Any potential sequence changes observed from the HRM analysis need to be confirmed by another method
♦
If too many benign sequence polymorphisms are present in a gene, the frequency of having to do reflex Sanger sequencing annuls the ease of this screening method
Examples
♦
Detection of K-RAS somatic mutation in colorectal tumor samples
♦
SLC26A4 mutation analysis in Pendred syndrome by HRM
Real-Time Quantitative Reverse Transcription PCR
Basic Technical Steps
♦
RNA is extracted from tissue or cells of interest
♦
cDNA is generated from RNA by traditional reverse transcription methods
♦
Real-time PCR is performed using two standard oligonucleotide primers plus one (or two) fluorescently labeled DNA probes
♦
With each cycle of annealing, the probes hybridize to newly synthesized PCR products, and a measurable fluorescent signal is generated in a product-dependent manner
♦
The PCR cycle number at which the PCR product is first detectable (the so-called crossing point or cycle threshold) is directly proportional to the concentration (log) of the input DNA target
♦
A ubiquitously-expressed internal control gene (i.e., GAPDH) is often used to normalize results and control for the quality and quantity of the input cells or RNA
Benefits
♦
It is highly sensitive for detecting and quantitating low levels of transcript
♦
Results are generated in a single day
Limitations
♦
Quantitative calibration can be tedious and difficult
♦
It can be difficult to work with RNA, which is highly susceptible to degradation
Example
♦
Quantitating BCR–ABL1 fusion transcripts in patients with CML undergoing tyrosine kinase inhibitor therapy (Fig. 11.7)
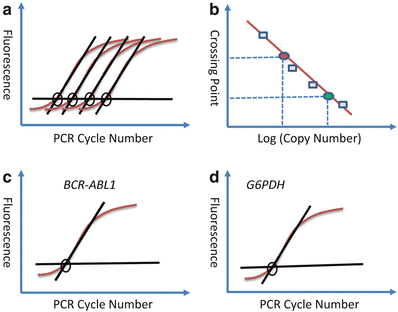

Fig. 11.7.
Real–time RT–PCR for quantification of BCR–ABL1 transcripts for monitoring the molecular response of CML to imatinib therapy. The standard curve resulting from amplifying calibration controls with known amounts of transcript are shown as raw amplification curves (A) and a resultant calibration curve (B). There is a linear relationship between the crossing point (PCR cycle at which the amplification curve rises above baseline) and the input copy number (log) of original transcripts. For BCR–ABL1, the specific fluorescent signal results from the presence of a fluorescently labeled hybridization probes to ABL exon a3. (C) (BCR–ABL1 primers and probes) and (D) (G6PDH housekeeping gene primers and probes) show the amplification curves from a patient that is not responding to imatinib therapy – as assessed by the approximately equal crossing point (concentration) of BCR–ABL1 RNA compared to G6PDH RNA. A good imatinib response would be indicated by a significant right shift of the BCR–ABL1 curve – indicative of a lower BCR–ABL1 transcript burden.
Sanger DNA Sequencing
Basic Technical Steps
♦
DNA from the gene of interest is first amplified by PCR
After PCR, the amplicon is subjected to an enzymatic chain termination cycle sequencing reaction using a single primer (may be one of the PCR primers), DNA polymerase, the four deoxynucleotides (dATP, dCTP, dGTP, dTTP), and one fluorescently labeled dideoxynucleotide (i.e., ddTTP) at a much lower concentration
One strand of the amplified DNA is extended from the annealed primer. When a dideoxynucleotide (i.e., ddTTP) is added to the growing strand, chain elongation stops
The reaction yields molecules of various sizes, each ending where a ddTTP has been added. Four reactions are performed, each with a different dideoxynucleotide. Collectively, the results yield the sequence of nucleotides within the region of interest – by a heterogeneous collection of fragments of varying sizes
If the ddNTPs are fluorescently labeled, four reactions (TACG) can be performed in a single tube, with each nucleotide represented by a different color
Samples are separated by capillary electrophoresis, each peak representing a single-sized fragment
Heterozygous samples are indicated by two different colored peaks at the same location (Fig. 11.8)
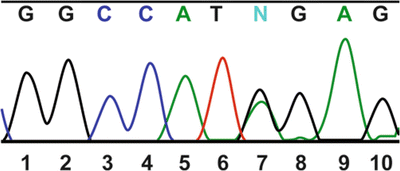
Fig. 11.8.
Results of Sanger fluorescent dideoxynucleotide sequencing and capillary electrophoresis. This patient is heterozygous at nucleotide 7; one allele has a G (black) at this location and the other has an A (green).
Benefits
♦
Visualization of each nucleotide makes sequencing the gold standard for mutation detection
♦
Reactions can be completed in a single day and from a variety of different sample types (including FFPE)
Limitations
♦
Reagents can be expensive
♦
Sequencing an entire gene can be labor-intensive
♦
Insertion or deletion mutations may be difficult to interpret
Example
♦
Sequencing the BRCA1 gene in patients with hereditary breast cancer
Digital PCR (Fig.11.9)
Basic Technical Steps
♦
Determine the amount of the genomic DNA or any template DNA added into the digital PCR reactions, in order to reach the average 0.5 copies of the target gene of interest in each digital reaction (i.e., some reactions will have and some won’t have the template DNA in the digital PCR reactions)
♦
The amount of DNA determined from the above will be mixed together with all the necessary components for the digital PCR reactions in one single container, including a real-time fluorescent PCR probe to detect the PCR amplification in each digital reaction
♦
The above cocktail will be aliquoted into a large number of very small-volume digital PCR reactions. The digital PCR reactions can be performed in PCR plate format (96- or 384-well plate) or through emulsion PCR. If emulsion PCR is performed for the digital PCR, oil would be added in the above mixture (Fig. 11.9B). Usually an electric mixer is used to generate micro-emulsion droplets. Each of the micro-emulsion droplets contains all the components for PCR and serves as a micro-PCR reaction chamber for digital PCR
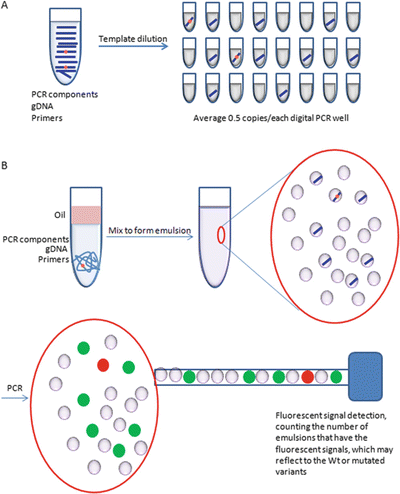

Fig. 11.9.
Schematic illustration of the digital PCR . Digital PCR is achieved by template dilution of the DNA template into multiple digital PCR reactions at very low copy numbers, for example, 0.5 copies for each digital PCR reaction (A). Digital PCR can be performed in a well format or by emulsion PCR (B). However, a fluorescent signal reader will be used to count the number of microemulsion droplets with or without PCR amplification to quantify the template DNA.
♦
PCR amplification in each digital reaction can be detected directly on a 96- or 384-well plate. For emulsion PCR, all the micro-droplets will pass through a fluorescent detector one by one to determine the amplification in digital PCR reactions
♦
Quantification by digital PCR is based on the Poisson distribution. Without knowing the concentration of the original DNA template, multiple dilutions are necessary for a successful DNA quantification based on Poisson calculation of the digital PCR results
Benefits
♦
It can be used to quantify the copy number of a template DNA. However, digital PCR on multiple dilutions of the template DNA is necessary for accurate quantification
♦
Emulsion digital PCR can be used at the next-generation sequencing (NGS) clonal amplification step
♦
Digital PCR enables mutation detection at a very low level. Mutation detection can reach a very high sensitivity by adding more templates in the mixture and partition the mixture to a higher number of digital PCR reactions
Limitations
♦
For mutation detection, relatively accurate quantification of the template DNA is necessary to have the proper template dilution for digital PCR. Otherwise, a mixture of too many copies of templates in a single digital PCR reaction can complicate data interpretation
♦
For emulsion digital PCR, a special fluorescent reader is needed to distinguish an emulsion digital PCR with PCR amplification from that with no amplification. For 96- or 384-well plates, real-time PCR instrument can read the fluorescent signal
Example
♦
Detection of K-RAS and BRAF somatic mutation in tumor samples
♦
NGS uses the digital emulsion PCR for clonal amplification
Next-Generation Sequencing
Basic Technical Steps
♦
Step 1: NGS library preparation (Fig. 11.10)
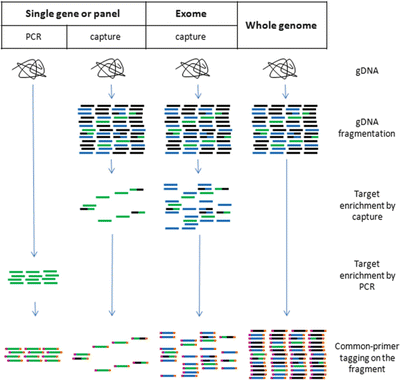

Fig. 11.10.
NGS, library reparation. In order to achieve sequencing efficiency, all of the fragments in the library are tagged with common primers that will serve as sequencing primers in the NGS reactions.
For sequencing a single gene or a small panel of genes, PCR amplification can be used to enrich the sequence of interest, followed by tagging the common sequencing primers at each end of the enriched fragments
For sequencing a panel of genes or an exome (all the coding sequences of the genome), gDNA will be fragmented first, then the targeted region will be enriched by sequence capture using oligo probes of the region of interest as baits to “fish out” the DNA fragments containing the panel of genes or the exome region. The captured fragments will be tagged by the common sequencing primers at each end of the enriched fragments as the PCR amplification method. These common primers are two synthetic oligos for clonal PCR amplification and serve as sequencing primers at sequencing step. These common primers are not homologous to any target gene
For whole-genome sequencing, the gDNA only need to be fragmented and the common sequencing primers tagged at each end
♦
Simultaneous PCR clonal amplification of the fragments from the NGS library, using the common primers tagged during library preparation
Each library fragment can be clonally amplified in situ on the sequencing matrices (e.g., Illumina’s technology) (Fig. 11.11A)
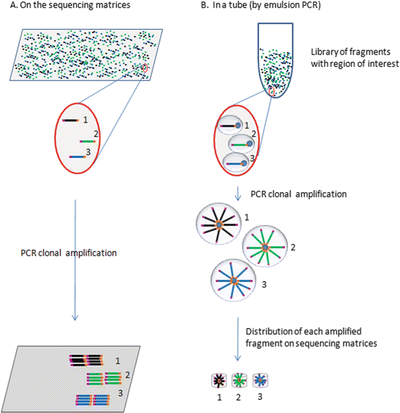
Fig. 11.11.
NGS, PCR clonal amplification of the library fragments. Before the actual sequencing reaction, all the fragments from the library are clonally amplified using the tagged common primers. The amplification happens either on the sequencing matrices (A) or by emulsion PCR (B). Note: 1, 2, and 3 are examples of three different fragments as templates of an NGS library.
Library fragments can also be clonally amplified by emulsion PCR (Life’s PGM) (Fig. 11.11B). Each emulsion droplet is equivalent to a micro-PCR reaction chamber, containing one tagged library fragment, PCR common primers, other components of PCR, and a micro-magnetic bead that will have all the amplified PCR products bound to. Each bead with clonally amplified PCR products will be loaded onto the micro-sequencing wells
♦
Massively parallel sequencing – each of the millions of clonally amplified library fragment is sequenced simultaneously
Sequencing by reverse terminator (Fig. 11.12): The addition of one fluorescently labeled nucleotide will be captured by images taken at the end of each cycle for each of the clonally amplified library fragments on the sequencing matrices; therefore, the collections of the images record the sequencing information of the template library fragments
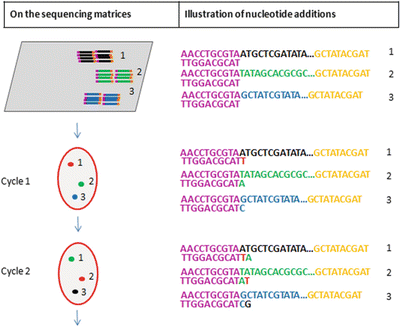
Fig. 11.12.
NGS, massively parallel sequencing by reverse terminator. Nucleotide addition on representative library fragments on the sequence matrices is illustrated. The addition of each fluorescently labeled nucleotide is captured by images taken.
Sequencing by measuring the release of hydrogen ion during DNA synthesis (Fig. 11.13): In each cycle, four dNTPs will be added sequentially into the sequencing reactions (i.e., only one type of dNTPs at one time). At the end of each dNTP addition, a hydrogen ion will be measured simultaneously for each of the micro-NGS reactions (by monitoring the local pH of the well). Therefore, there will be four pH measurements at the end of each cycle
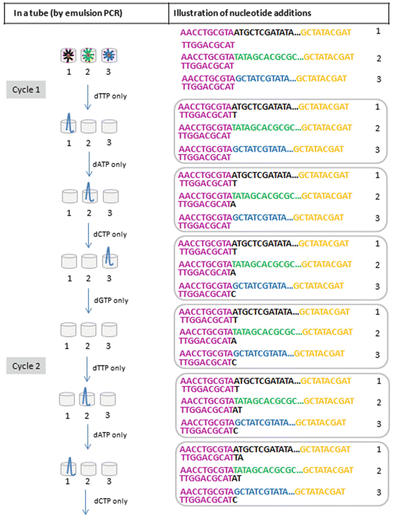
Fig. 11.13.
NGS, massively parallel sequencing by measuring released hydrogen ion (H+). Nucleotide addition on representative library fragments in a tube (by emulsion PCR) is illustrated. The addition of each dNTP is monitored addition by measuring the local pH change due to hydrogen ion released during DNA synthesis.
♦
NGS data analysis
After collecting the instrument signals from the sequencing reactions, primary data analysis is conducted to translate the machine signals to a stretch of nucleotide sequence. Each clonally amplified library fragment will generate one stretch of nucleotide sequence, which is called a “read” in NGS terminology
Then each “read” will be mapped to a known reference genome (e.g., human genome sequences). “Reads” which cannot be mapped to the reference genome will be discarded or used for analysis of possible large aberrant genetic events (translocations, insertions, deletions) at this step. Variant calls (compared to the reference sequence) will be generated based on the mapping results. This is the secondary data analysis
To make sense of the sequence “reads,” a tertiary analysis will be conducted based on the intended purpose of the NGS assays. All the “benign” variants (depending on the intent of the experiment) will be filtered out at this step to allow for annotation of the variants. For example, to find any sequence changes of a matched normal and tumor pair, all the reads will be compared to each other to both identify sequence changes that may be specific for the tumor cells and exclude benign variants (presumably non-tumor related) that may differ from the reference sequence but be identical in both the tumor and normal samples
Benefits
♦
NGS is a high-throughput technology. Once the system is set up, it is possible to scale up to either increase the number of genes or targets for sequencing or increase the number of simultaneous patient samples to be tested. Samples from individual patients can be tagged with a unique barcode (i.e., a stretch of DNA sequences with eight to ten nucleotides). Samples from different patients (each with a unique barcode) can then be pooled together in one of the sequencing runs
♦
For somatic mutation analysis, it is possible to increase the detection sensitivity by increasing the depth of the coverage (i.e., the number of NGS reads) on that nucleotide location. For example, an increase in the depth of coverage from 200 reads to 1,000 reads at a genomic location will increase the mutation detection sensitivity by approximately fivefold
♦
NGS can streamline the laboratory operation. NGS technology can detect different types of sequence changes, including single-nucleotide changes, small insertions, and deletions. NGS is often less efficient (but can be optimized) at detecting large deletions, translocations, and copy number variations. A heterogeneity of different mutation analysis tests can be developed on the NGS platform; therefore, different tests can be performed in the same sequencing run to make the laboratory operation more efficient
♦
NGS is able to detect both known and unknown mutations
Limitations
♦
With the high-throughput nature of the technology, designated bioinformatics support is often required to create an efficient data analysis workflow based on an individual laboratory’s needs
♦
Significant resources are necessary to annotate (i.e., categorize) the sequence changes of gene panels, exomes, or whole genomes, especially the many resulting variants of unknown significance (VUS) that will be discovered
♦
Storage of the large amount of data can be challenging. Security and privacy of the data storage can be an issue, because each patient can be identified only based on the collection of the large amount of genetic information generated from the NGS technology
♦
Development, validation, and verification of NGS as a new diagnostic test can take much more effort than a traditional single gene test
♦
Frequent improvements in hardware, software, and bioinformatics algorithms are difficult and laborious to clinically validate once the entire procedure is “locked down” for clinical diagnostic use
Examples
♦
Hotspot cancer panels of cancer-related genes to identify patients who could benefit from targeted therapy
♦
Exome or whole-genome sequencing to diagnose pediatric patients with rare inherited disorders
Gene Expression Profiling Microarray (Fig. 11.14)
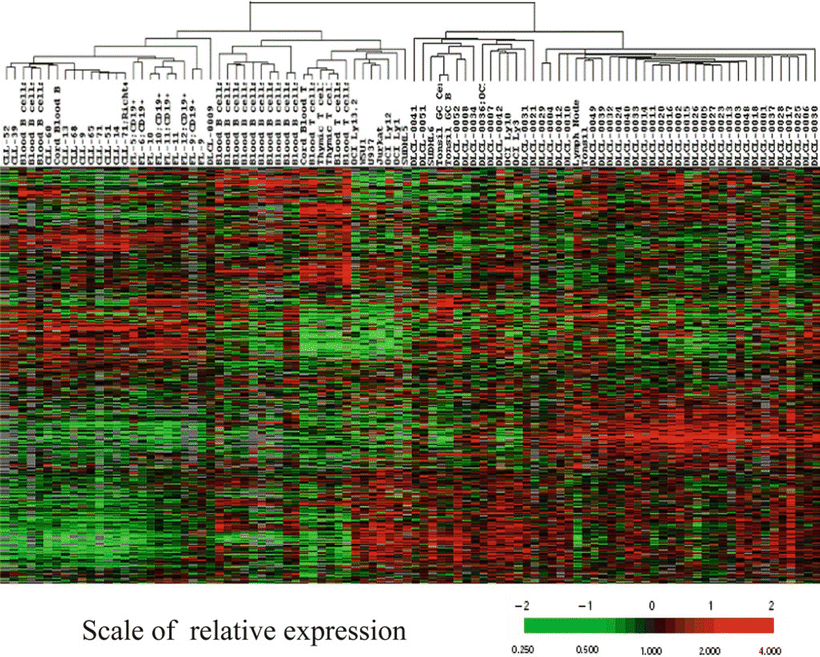
Fig. 11.14.
Hierarchical clustering of 96 samples of normal and malignant lymphocytes, clustered based on the expression of 2,000 known genes as analyzed by microarray analysis. Each row represents a separate gene and each column a separate lymphocyte cell sample. Fluorescent cDNA probes prepared from each experimental RNA sample are hybridized to the array chip, each containing thousands of immobilized cDNA or oligonucleotide sequences. Shown are the relative ratios of hybridization of each lymphocyte sample to each reference gene. These ratios are a measure of relative gene expression in each experimental sample and are depicted according to the color scale shown at the bottom. As indicated, the scale extends from fluorescence ratios of 0.25–4 (−2 to +2 in log base 2 units). Red indicates overexpression. Green indicates underexpression. Gray indicates missing or excluded data. In this manner, the experimental lymphocyte samples can be classified into “clusters” (or groups), each with a similar pattern of global gene expression. For some tumors, this type of gene expression “clustering” analysis can subclassify morphologically indistinguishable tumors into biologically distinct prognostic categories.
♦
Assess the global gene expression profile or focused gene expression signatures by simultaneous hybridization of fluorescently labeled tumor RNA (or cDNA or cRNA) to thousands of “probes” immobilized as an array onto a miniaturized solid support
♦
Two platforms available: cDNA and oligonucleotide microarrays
♦
High throughput
♦
Can be done with fresh tissue or formalin-fixed and paraffin-embedded tissue
♦
Genes expressed at low levels or genes with unstable mRNA may not be detected
♦
Interpretation is technically challenging, especially when the tissue samples contain admixed benign and malignant cells
♦
It has been validated and FDA-cleared to identify the primary tumor site in patients with carcinoma of unknown primary
MicroRNA Profiling
♦
MicroRNAs (miRNA) are single-stranded RNA molecules of about 21–23 nucleotides in length
♦
miRNAs are not translated into protein
♦
miRNA molecules are partially complementary to one or more messenger RNA (mRNA) molecules, and their main function is to downregulate gene expression
♦
Many microRNAs exhibit organ-enriched or organ-specific expression in normal human tissues
♦
Specific microRNAs are up- or downregulated in solid tumors relative to normal adjacent tissues
♦
DNA oligonucleotide arrays allow for high-throughput microRNA expression profiling. The miRNA signatures may enable further classification of cancer
♦
miRNA are potential therapeutic targets because their function can be efficiently and specifically inhibited by chemically modified antisense oligonucleotides
Antigen Receptor Gene Rearrangement Assay
♦
Genetic rearrangements in the immunoglobulin and T-cell receptor genes determine the diversity of immune responses
♦
In the germline (unrearranged state), the IG and TCR genes are composed of discontinuous coding regions (Table 11.1)
Table 11.1.
Immunoglobulin and T-cell Receptor Gene Structure
Gene segments | IG | TCR | |||||
|---|---|---|---|---|---|---|---|
(# available gene segments) | (# available gene segments) | ||||||
H | κ | λ | α | β | γ | δ | |
V (variable regions) | 50 | 25 | 30 | 60 | 46 | 8 | 10 |
D (diversity regions) | 24 | 0 | 0 | 0 | 2 | 0 | 3 |
J (joining regions) | 6 | 5 | 4 | 50 | 12 | 5 | 3 |
♦
Each individual lymphocyte contains a uniquely rearranged DNA pattern within the IG or TCR genes
♦
Routine molecular methods (Southern blot and/or PCR) are not sufficiently sensitive to detect VDJ genetic rearrangements in a single cell
Immunoglobulin Heavy Chain and Light Chain Gene Rearrangements and B-Cell Clonality Assay
♦
Mechanism of immunoglobulin gene rearrangement
Unique V, D, and J region DNA rearrangements in each B cell generate the variable regions (antigen-binding domains) of the Ig light and heavy chains (Fig. 11.15)
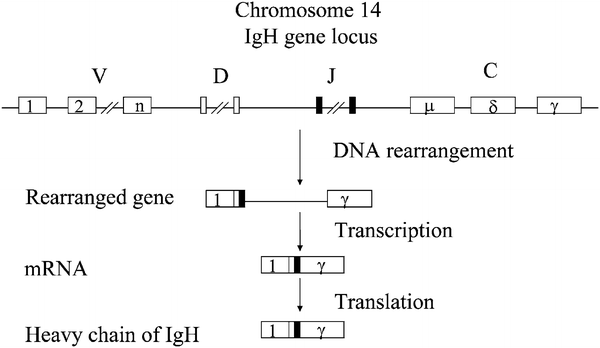
Fig. 11.15.
The process of B–cell receptor immunoglobulin heavy (IGH) chain gene rearrangement during B–cell differentiation. The DNA in the IGH gene locus is cut and recombined to make a rearranged gene that is able to produce one of millions of functionally active immunoglobulin heavy chains. This gene can then be transcribed into mRNA, which is, in turn, translated into the specific heavy polypeptide chain.
First rearrangement: DH to JH with insertion of random number of nucleotides (N) between DH and JH
The VH gene then joins to the DHNJH segment with insertion of random number of nucleotides (N) between VH and DH
The V H ND h NJ h segment then joins with a CH constant region gene and its switch region to generate VHNDHNJHCH
VDJC is transcribed and translated into an Ig heavy chain
Failed rearrangements are followed by attempts at rearranging the second immunoglobulin heavy (IGH) allele
κ and λ undergo VJC gene rearrangements similar to heavy chain genes (except no D regions for light chain genes)
Light chain genes rearrange after successful Ig heavy chain gene rearrangement. λ light chain genes rearrange only after both k alleles fail to successfully rearrange
Approximately 1014 different variable region configurations exist (for immune diversity)
♦
PCR assay for B-cell clonality determination
Sense PCR primers: from conserved sequences within the VH region (frameworks I, II, or III)
Antisense PCR primers: from conserved sequences within JH region
Depending on primer pairs chosen, PCR product from a clone of rearranged B cells will be 70–380 bp in length
Multiplex PCR assays have successfully been developed and standardized for the detection of clonally rearranged Ig and TCR genes through the European BIOMED-2 collaborative study
VH and JH regions in germline (unrearranged) cells are too distant for successful PCR amplification and yield no PCR product. Only rearranged cells (clones) yield detectable PCR bands
A distinct (above background) PCR band of expected size range suggests a clonal B-cell population
A clone of B cells representing >0.1–10% of all cells is needed to yield a detectable PCR band which is also dependent on primers, tissue source, and PCR conditions
Only ~70–90% of known lymphomas will yield detectable IGH PCR products
Sequence heterogeneity in the VH and JH regions may prevent primer binding in some clones
False-negative results are more frequently seen in the follicular lymphomas and plasma cell malignancies due to somatic mutations of the immunoglobulin heavy chain gene which alter the sequence of the region to be amplified
Most tests that employ consensus primers can detect only one clonal cell in 100 polyclonal cells
PCR tests for rearrangement of the kappa light chain gene can detect clonality in up to 50% of B-cell lymphomas. It is particularly helpful in detecting a clonal population in plasma cell disorders that give false-negative results for the IGH PCR test due to somatic hypermutation of the immunoglobulin heavy chain gene
Stay updated, free articles. Join our Telegram channel

Full access? Get Clinical Tree


