24 Introduction to Public Health

Thus far in this book, the discussion has focused mostly on what individuals and their clinicians can do to promote health and prevent disease and injury. Section 4 of this book focuses on public health. As the Institute of Medicine (IOM) indicated in its 1988 report The Future of Public Health, “Public health is what we, as a society, do collectively to assure the conditions in which people can be healthy.”1
To ensure better health, the responsibilities in public health are threefold: assessment, policy development, and assurance1 (i.e., ensuring that appropriate services are available and accessible to meet the needs of the population). Chapter 2 provides tools for estimating the health of a population, and Chapter 14 discusses several definitions of health and their limitations. This chapter summarizes the current health of the U.S. population in the second decade of the 21st century and discusses data sources that public health practitioners can use to better understand the health issues in their communities. Injuries are also discussed in this chapter, both as a significant source of premature mortality, and as an example of how to think systematically about public health prevention efforts. Chapters 25 and 26 outline the U.S. public health system and how communities can improve their health. Chapters 27 and 28 address the specific public health topics of preparing for emergencies and ensuring the best quality of health care. Chapter 29 considers the complex and sometimes contradictory efforts of the medical care system to provide medical care, some of which can be considered preventive. Lastly, Chapter 30 outlines the important connections among environmental/ecological health, the health of other species, and human health and highlights new, integrative approaches for enhancing the “one health” we all share.
I Definitions of Public Health
The term public health has the following two meanings:
 Health status of the public (i.e., a defined population)
 Organized social efforts to preserve and improve the health of a defined population
The best-known definition of public health in terms of this second meaning was written in 1920 by C.-E. A. Winslow2 and is still remarkably current:
This definition is especially significant in the following three ways:
1. It states the central emphasis of all public health work—promoting health and preventing disease.
2. It emphasizes the diverse strategies required to promote health and prevent disease, including environmental sanitation, specific disease control efforts, health education, medical care, and an adequate standard of living.
3. It clarifies that for these goals to be achieved, organized social action is required. This action is largely expressed in the policies of the federal, state, and local governments and in the activities of the agencies designed to promote and protect the health of the public.
II Health in the United States
A Major Sources of Mortality and Morbidity
All efforts to improve public health start with an assessment. Table 24-1 shows major metrics of public health in the United States. Overall metrics of mortality have been steadily improving since 1950. Life expectancy at birth has improved to 78.2 years, and overall infant mortality has declined to less than 7 per 1000 newborns.3
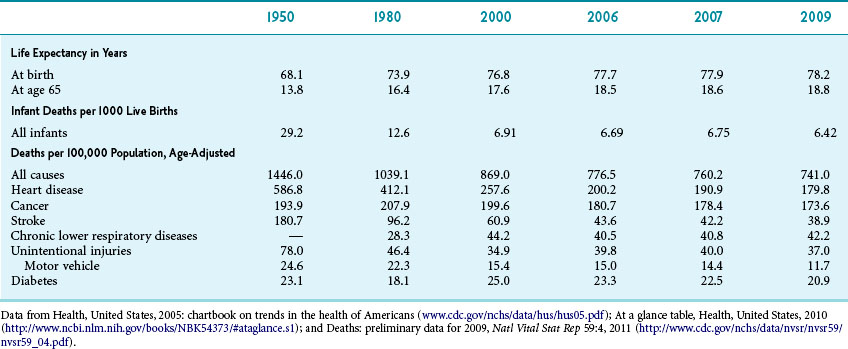
The three leading causes of death have changed recently. Historically, heart disease has been the number-one killer (which it remains), followed by cancer and stroke (cerebrovascular accident). As the mortality of all these diseases has decreased, mortality from chronic lower respiratory diseases has increased and is now third on the list. Mortality from Alzheimer’s dementia has also increased, surpassing that from diabetes in 2009. The three leading cancers have long been lung, breast/prostate, and colorectal cancer. The trends over time have shown a large increase in lung cancer after the widespread use of tobacco. This peak has leveled off for men (Fig. 24-1). For women, the trend came later and has yet to level off (Fig. 24-2).
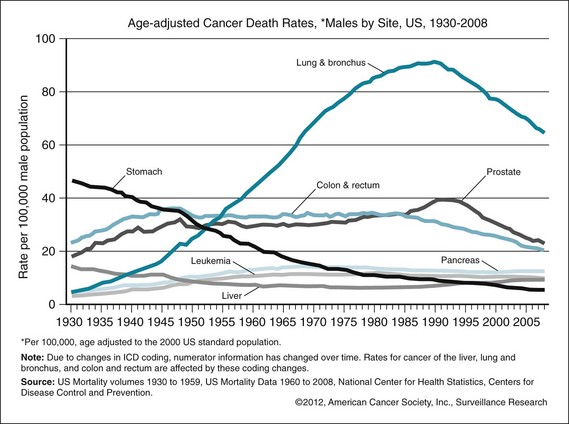
Figure 24-1 Age-adjusted cancer death rates for males by cancer site, United States, 1930–2008.
(From American Cancer Society: Cancer facts and figures: 2012, Atlanta, 2012, ACS. http://www.cancer.org/acs/groups/content/@epidemiologysurveillance/documents/document/acspc-031941.pdf)
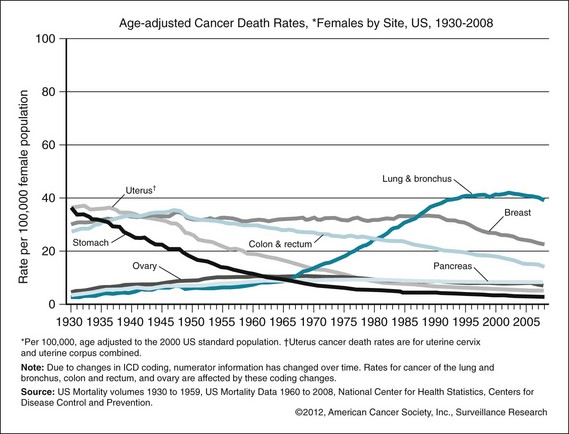
Figure 24-2 Age-adjusted cancer death rates for females by cancer site, United States, 1930–2008.
(From Anerican Cancer Society: Cancer facts and figures: 2012, Atlanta, 2012, ACS.)
Globally, developing countries are undergoing a demographic and epidemiologic transition. Demographically, the population in these countries ages; epidemiologically, infectious diseases become less important as causes of death and chronic disease and cancers more important. In keeping with this trend, the global cancer burden is rising. Cancer trends in many developed countries are similar to U.S. trends. Developing countries have a larger burden of cancers from preventable infectious causes, such as cervical cancer.4 Further data on global cancer statistics can be found online.5
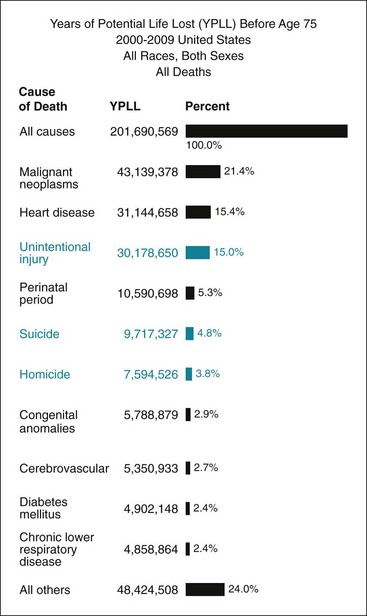
Society should have an interest in reducing all mortality, but many public health officials have an appropriate and particular interest in reducing premature deaths. One way to account for the impact of mortality causes on premature death is to calculate years of potential life lost (YPLL). Figure 24-3 shows the 10 leading causes of YPLL before age 75 between 2000 and 2009. Analyzing the data in this way reverses first and second places on the mortality list; cancer is now the number-one cause of premature death because it affects more young people. Calculating the data this way also shows that chronic diseases such as chronic lower respiratory diseases and diabetes are less important in causing premature mortality. Intentional and unintentional injuries play a major role in premature death because they disproportionately affect younger people.
B Actual Causes of Death
The previous death statistics are based on death certificates filled out by clinicians and do not account for the full causal pathway leading to death. One metric that attempts to account for this fact is actual causes of death. This metric was outlined for the first time in a landmark paper by McGinnis and Foege and last updated in 2004.6 This analysis showed that smoking, poor diet, and lack of physical activity were the main drivers of mortality. However, analyzing actual causes of death should not be interpreted as a reduction of all mortality on individual behavior and an exoneration of structural determinants of health. As discussed in Chapters 14, 20, and 26, poverty, food environments, and safe environments all play an important role in shaping or enabling behavior.
C Disability-adjusted Life Years
With death rates falling, many persons live with serious illness and disability for many years. To assess this burden of disease, a metric called disability-adjusted life years (DALY) has been developed. This metric captures both the length of life lost from premature death and the time spent in poor health.7 By this metric, the leading sources of premature death and disability were cardiovascular disease, cancer (especially breast and lung), depression, osteoarthritis, diabetes, and alcohol use. There were significant differences between genders and among ethnic groups. For example, for women, depression was the second leading cause of DALY (10 for males), whereas motor vehicle injuries and HIV-related deaths accounted for more DALY among ethnic minorities.
D Health Care Disparities
The goal of public health is not just to decrease mortality and morbidity overall but also to decrease disparities. Historically, there has long been a gap between male and female life expectancy, as well as between whites and blacks. This gap has decreased somewhat but still exists; overall, white women live the longest, and black men are most likely to die early (Fig. 24-4). In this analysis, race is likely not the causative agent but may be a correlate of proximate causes of decreased life expectancy, such as socioeconomic status and empowerment. Effective strategies to address health care disparities have been identified at the state and local level (see Chapter 26).
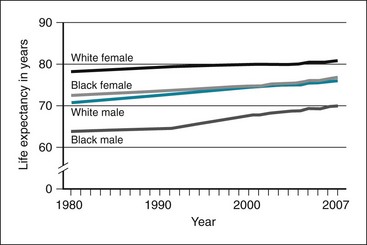
Figure 24-4 Life expectancy at birth, by race and gender, United States, 1980–2007.
(From Health of the United States 2010, Washington, DC, 2010, US Department of Health and Human Services. http://www.cdc.gov/nchs/data/hus/hus10.pdf)
Health care disparities occur in all age groups but are exacerbated in particular groups. Although mortality rates and infant and child mortality all have improved significantly in the past five decades, this is not the case for young persons age 15 to 24.8 The three leading causes of death in this age group include unintentional injuries (mainly motor vehicle crashes), homicide, and suicide (Fig. 24-5).
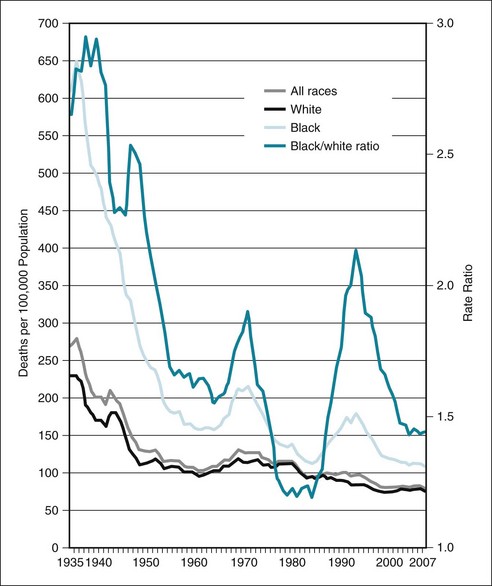
Figure 24-5 Mortality rates among youth ages 15 to 24 by race, 1935–2007.
(From Singh GK: Youth mortality in the United States, 1935–2007, Rockville, Md, 2010, DHHS.)
See Figure 24-6 on studentconsult.com for youth mortality by causes of death and ethnicity.
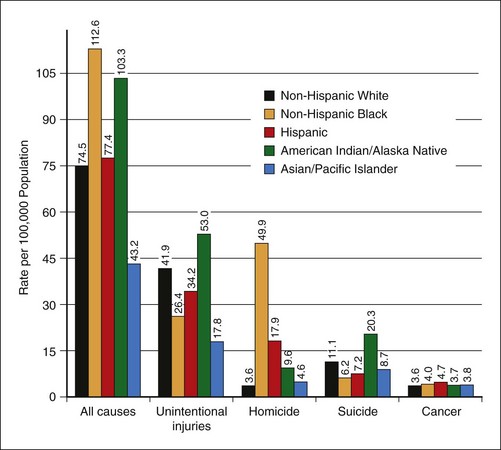
Figure 24-6 Youth mortality by causes of death and ethnicity.
(From Singh GK: Youth mortality in the United States, 1935-2007, Rockville, Md, 2010, DHHS.)
III Data Sources in Public Health
The increasing availability of electronic medical records and other digitized repositories constitutes an explosion of public health data. The main challenge is no longer to find data, but to find useful data in a sea of sources. Box 24-1 illustrates an example of pulling information together for assessing the burden of disease from asthma in a community.
Box 24-1 Using Data from Multiple Sources to Assess Level of Asthma Morbidity in a New York County
A. Describe the asthma prevalence and mortality among adults and children in the state, and describe trend.
B. Assess health care utilization resulting from asthma.
C. Describe overall health of the county.
D. Perform primary data collection.
E. Review primary data and determine if other data sources need to be accessed.
Modified from Epi Info Community Health Assessment Tutorial 2.0, 2005, Department of Health and Human Services, CDC, National Center for Public Health Informatics. ftp://ftp.cdc.gov/pub/Software/epi_info/EIHAT_WEB/EIHAT2.0.pdf
The most important uses of the data remain to foster accountability and to spur change. In an ideal world, everyone would use a coherent set of population health metrics to drive such change. To date, however, no coherent and consistent set is available.9 Health knowledge should not devolve into its converse, morbidity and mortality (Fig. 24-7).10 In keeping with theories of health and its determinants, such a consistent set of health indicators should measure not only disease burden but also health equity, social determinants of health, environmental monitoring, quality of life, and aspects of health system performance.
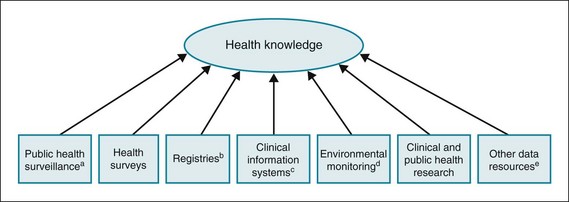
Figure 24-7 Knowing about health.
aThe ongoing, systematic collection, analysis, and interpretation of health-related data with the a priori purpose of identifying unusual events of public health importance, or preventing or controlling disease or injury, followed by their dissemination for public health action. For example:
bVital registration, cancer registries, exposure registries.
cMedical and laboratory records, pharmacy records.
dWeather, climate change, pollution.
eCriminal justice information, Lexis-Nexis, census.
(From Lee LM, Thacker SB: Public health surveillance and knowing about health in the context of growing sources of health data, Am J Prev Med 41:636–640, 2011.)
A Surveillance and Databases
Public health surveillance is defined as the ongoing systematic collection, analysis, and dissemination of data regarding a health-related event for use in public health action to reduce morbidity and mortality and to improve health.11 Many entities on the local, state, and federal level are engaged in collecting such data. The data are usually used descriptively to do the following12:
 Measure the burden of disease or trends in the burden of disease.

 Guide action and develop priorities for public health action.
 Acquire resources (e.g., state grants).

 Guide the planning, implementation, and evaluation of programs.

Data from public health databases differ from research data in a variety of ways. The data are usually reported based on regulatory requirements or by law. Public health data come from a patchwork of local and state sources. Data may be incomplete or of low quality, and changes in data definition or wording of questions make it difficult to compare data over time. When reviewing any metric, it is important to ask the following questions to understand data attributes13:
 Is the survey based on a sample, or is it population-based?

 Do data points represent individual records or the aggregate?
 What are the criteria for reporting the location of the event?
Stay updated, free articles. Join our Telegram channel

Full access? Get Clinical Tree


