19 Interpreting key investigations
Although the history and examination remain the key to most clinical problems, investigations are usually required to confirm the diagnosis or to narrow the differential diagnosis. Such investigations are frequently performed in emergency situations, so familiarity with the key tests is vital to practising physicians in all specialties.
ELECTROCARDIOGRAPHY (ECG)
SYSTEMATIC APPROACH TO ECG INTERPRETATION
PATIENT DETAILS AND ECG CALIBRATION
Always record and check the patient’s name and date of birth, as well as the date and time, on an ECG. Also check the calibration; ECGs are usually recorded at a paper speed of 25 mm/s and calibrated so that a signal of 1 mV = 10 mm.
THE NORMAL ECG
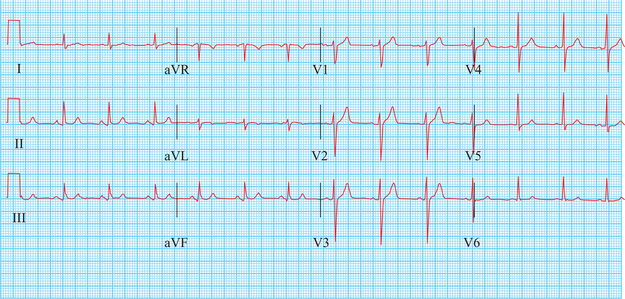
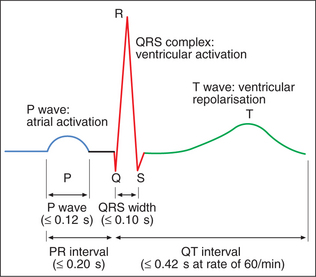
Figure 19.1 shows a normal 12-lead ECG, and the terminology and limits of normality for the key waves and intervals are shown in Figure 19.2.
QRS COMPLEX
The QRS complex is caused by ventricular depolarisation.
Non-pathological small Q waves are often seen in leads I, aVL, III, V5 and V6.
ST SEGMENT
The ST segment is usually isoelectric.
T WAVE
CARDIAC AXIS
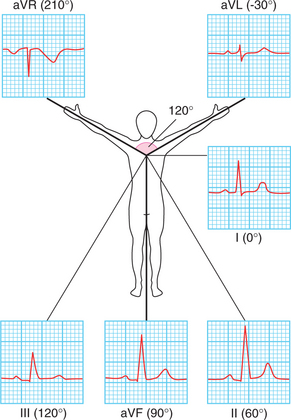
This is the mean direction of ventricular depolarisation in the coronal plane. It is most accurately estimated from the limb leads using the hexaxial system (Fig. 19.3). Firstly, identify the equiphasic lead (where the positive and negative deflections of the QRS complex are roughly equal). Then find the lead at 90° to this on the hexaxial diagram.
Stay updated, free articles. Join our Telegram channel

Full access? Get Clinical Tree


