28 Health Management, Health Administration, and Quality Improvement
Improving an organization first requires understanding it, and managerial skills are universally important. The requirements to run a project successfully are the same for managing a local health department, a clinic for underserved groups, leading a small quality improvement (QI) team, or running a large health care system. Health managers must understand the environment in which they operate; be able to assess organizational performance in regard to finance, clients or patients, and other stakeholders; know how to keep improving; and understand how to hire, promote, and fire the right people. This chapter explores these issues, as in other chapters, through a few of the important concepts. The goal is not to transform the reader into a human resource manager or an accountant. The goal is to familiarize readers with the basics so that they can have an educated conversation with such staff members and understand how each person’s work influences the other. Readers who want to know more should consult the specialized literature (see Select Readings).
I Organizational Structure and Decision Making
Not everybody responds to the same motivations, however. Key motivators may be caring about doing a job well, job security, job title, the ability to mold things, the chance to learn new things, and the pleasure of working with likable people. These differences in motivators stem from personality types. There have been many ways of distinguishing different personality styles, such as the Myers-Briggs Personality Inventory that famously established introverts and extroverts. One popular rubric divides people into four types: the architect (interested in how things are put together), the strategist (interested in the “big picture”), the diplomat (interested in how things will be perceived and affect relationships), and the fact finder (interested in data, deadlines, and the bottom line).1 Whatever system one prefers, what is most important is to recognize that such differences exist, and that effective managers address a performance challenge and its possible solutions in ways that meet as many of these dimensions as possible. In any case, when supervising employees, it is better to ask them what is important to them rather than to rely on a theoretical construct of what they ought to care about.
II Assessing Organizational Performance
If an organization is to survive, it must periodically assess various dimensions of its performance: finances, processes, people, and mission. Usually, assessment begins with the organization’s mission as the basis for goals and measurable objectives. Performance measurement is a cyclical process with these four steps2:
1. Setting performance standards. The organization identifies relevant standards, selects indicators, sets goals and targets, and communicates expectations.
2. Performance measurement. The organization defines measures and valid indicators. It establishes systems for data collection.
3. Performance reporting. Data are analyzed and reported to managers, staff, policy makers, and constituents.
4. Quality improvement. Based on the analysis, the organization refines or reworks policies and programs and manages the human side of change.
A Measurement Tools and Budgeting
An important way to assess operational organizational performance is benchmarking. To benchmark, an organization conducts a self-assessment and then compares itself to other, similar organizations to gauge its relative performance. For public health agencies, the National Public Health Performance Standards Program has developed such standards, for both state and local health agencies.3 The Joint Commission provides similar guidance for health care providers (see later).
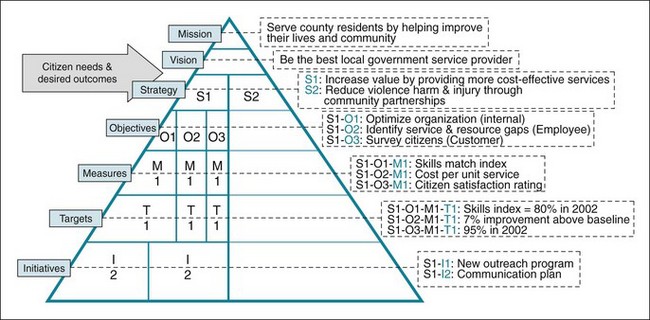
Instruments to report performance include dashboards and balanced scorecards. Dashboards are operational management tools that track many indicators together. For each indicator, there are benchmarks; indicators outside acceptable benchmarks may be shaded red or yellow, whereas acceptable ones may be green. This allows managers and personnel to see immediately which domains are working well and which are not. Balanced scorecards provide similar feedback but present a more holistic picture of an organization to link strategic and operational domains. In balanced scorecards an organization’s vision, mission, and strategy are followed down into performance measures and initiatives, so that a mission goal can be followed all the way to a specific output and outcome metric4 (Fig. 28-1).

Figure 28-1 Example of balanced scorecard for a local government.
(From Rohm H: Perform 2[2]. Available at www.balancedscorecard.org/LinkClick.aspx?fileticket=ph%2b8b3YMoBc%3d&tabid=56)
B Variance Analysis
The act of comparing actual performance to budgets is called variance analysis. This is an extremely important step, because it allows managers to decide if they need to take action now to spend more or less in the future.5 Budget variances are traditionally called favorable and unfavorable.
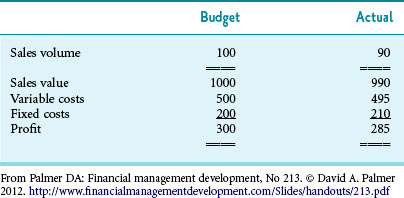
Table 28-1 provides a simple example of budget variance analysis. Budget variance can be caused by unexpected changes in clients, client mix, reimbursement, or expenses. Variance analysis needs to account for fixed and variable costs. As the name implies, fixed costs do not change with volume. For example, if one receptionist handles all the calls to an agency, that person’s salary is a fixed cost; the pay will not change, whether the receptionist answers 1 or 100 calls per day. In contrast, variable costs change with volume (e.g., test strips needed for exam, mileage costs for car).
Other types of variance include the following:
 Volume variance. There were fewer or more people served (e.g., more homeowners requested water safety assessment).
 Quantity (use) variance. It took more of a certain resource to deliver a certain service (e.g., restaurant inspector needed double the number of test strips per restaurant inspection than anticipated).
 Price (spending, or rate) variance. This variance occurs if the price of an input is different from the budgeted price. Price could be the price of a supply item such as radiology equipment.6
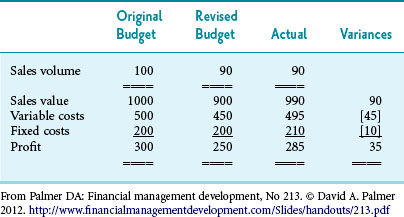
Table 28-2 provides another way to look at variances. Although the example shows a simple part of a budget from a company, the variance in a public health agency’s budget could be analyzed similarly. When analyzing budget variances, it is important to identify expected fluctuations from unexpected fluctuations. Unexpected fluctuations can usually be found by comparing revenue or expense fluctuations to previous years. If the differences are real, a manager needs to look for reasons. However, it is important first to make sure that there are no faulty calculations in the original budget and no errors in the actual results. It is also important not to respond to budget variances that are caused by singular, unexpected events (e.g., natural or man-made disasters). The most common reason for budget variance is a difference between assumptions and reality. Since budgets are informed guesses, it is easy to guess wrong. However, such differences require managerial action before the organization is in trouble.7
For a public health agency, the budget in Table 28-2 might represent the fees brought in for new home inspections. By custom, favorable variances are shown as positive numbers; negative variances are shown in brackets. Since the revenue was below what was budgeted, one would expect a variance. However, since sales were below expected, the costs have to be adjusted for actual sales volume before further analysis.
Table 28-2 shows the budget revised for the actual volume. Now it is apparent that the sales value was actually higher (a good thing), but that both variable costs and fixed costs were also higher than expected (a bad thing). Armed with these numbers, the manager can investigate further and put fixes in place. For example, the manager might investigate why there is a different demand for the service, commend the salesperson for getting higher prices, and investigate why the fixed and variable costs were higher.
1 Break-even Calculation
Box 28-1 outlines the process for buying a new piece of equipment for a physician’s office.
Box 28-1 Break-even Calculations for Buying a Piece of Medical Equipment
Estimate the number of procedures you will perform with the new medical equipment:
Estimated number of procedures for the first year:
Estimate the additional net revenue you expect to receive from the new procedure:
Estimated adjustments to revenue:
Estimated net revenue per procedure:
Estimate the lost revenue per year:
Estimated lost revenue per year:
Estimate the acquisition costs of the equipment:
Estimate the fixed costs of the equipment:
Estimated fixed costs per year:
Estimate the variable costs of the equipment:
Estimated variable costs per procedure:
Estimated total variable costs per year:
Estimate the rate of return on your alternative investments:
What percent return do you expect to make on your other investments during the duration of the analysis?
Modified from Willis DR: How to decide whether to buy new medical equipment. Fam Pract Manage 11:53–58, 2004. http://www.aafp.org/fpm/2004/0300/p53.html
III Basics of Quality Improvement
The quality of medical practice has been a major concern since the early 20th century. In 1910 the historic Flexner Report advocated for higher standards in medical education.8 After World War II, investigators began to define more clearly the dimensions of quality. In 1969, Donabedian9 pioneered the study of health care quality by proposing that quality should be examined in terms of structure (the physical resources and human resources that a hospital or HMO possesses for providing care), process (the way in which the physical and human resources were joined in the activities of physicians and other health care providers), and outcome (the end results of care, such as whether the patients actually do as well as would be expected, given the severity of their problems). Another important pioneer of medical quality research was Wennberg, who developed a method of determining population-based rates for the utilization and distribution of health care services. This method, called small-area analysis, revealed large variations in health care usage among different areas and was important in determining which procedures or diagnoses most needed standardization or improvement.10
Several institutions and programs evaluate the quality of health institutions. State accreditation of facilities usually emphasizes structural and procedural issues. The Joint Commission11 (TJC), formerly the Joint Commission on Accreditation of Healthcare Organizations (JCAHO), is an independent, not-for-profit organization that evaluates the quality and safety of most health care institutions in the United States. Quality review programs of the past, including the programs of professional review organizations (PROs), tended to focus on particular aspects of process called procedural end points and offered a detailed review of the methods of care provided and an analysis of how well certain disease-specific treatment criteria were met. In contrast, current quality improvement efforts emphasize quality monitoring and focus increasingly on outcomes.
One of the primary national data sets on quality of care focuses on the services provided by managed care organizations (MCOs), with particular attention to prevention and health maintenance aspects of their health plans. Called the Healthcare Effectiveness Data and Information Set (HEDIS),12 this includes the following areas of prevention:
 Counseling patients to quit smoking.
 Screening for breast cancer, cervical cancer, hypercholesterolemia, and Chlamydia infections.
 Providing prenatal and postpartum care.
 Instituting measures to manage mental illness, menopause, and chronic conditions such as asthma, depression, diabetes, and hypertension.
 Counseling patients regarding the proper use of medications for several diseases.
Stay updated, free articles. Join our Telegram channel

Full access? Get Clinical Tree


