Figure 6-1. Definition of health disparities in health care. (Reproduced with permission from Smedley BD, Stith AY, Nelson AR, eds. Unequal Treatment: Confronting Racial and Ethnic Disparities in Healthcare. Washington, DC: Institute of Medicine; 2003.)
As will be discussed later in greater detail, for almost every category of disease, including CVD, diabetes, cancer, and renal disease, African Americans have poorer health, and other racial and ethnic minorities have poorer health outcomes than European Americans. For example, mortality rates due to hypertension are about 15 deaths per 100,000 people for European men and women, about 40 per 100,000 for African American women, and more than 50 per 100,000 for African American men. Moreover, an estimated 13.2% of African Americans and 11.9% of Hispanics have diabetes compared with 7.1% of European Americans. Prostate cancer death rates, although decreasing in men of all racial/ethnic groups, remain twice as high among African Americans as any other group. Overall, the death rate for cancer among African American men is 27% higher than for European American men, and the death rate for cancer among African American women is 11% higher than for European American women. For HIV/AIDS, in 1987, African Americans’ mortality rate was three times higher than for European Americans; in 2011, African Americans’ HIV/AIDS mortality rate was 1.9 times greater than that for European Americans. In 2011, 28% of African Americans and 25% of Hispanics/Latinos lived below the poverty line compared with 10% of European Americans. In Chapter 5, we learned that social determinants, such as income, are strong predictors of health outcomes. Even when socioeconomic status (SES) is taken into account, however, racial and ethnic disparities often persist.
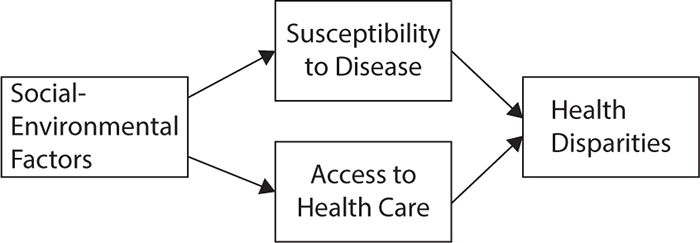
The interface between social and economic health status determinants and the presence of racial and ethnic disparities in health outcomes is well documented. Race is associated with societal prejudices, which in turn produce increased susceptibility to disease; reduced access to health care; and subsequent health disparities in disease incidence, prevalence, morbidity, and mortality. From this perspective, race interacts with social and environmental factors, such as lack of access to grocery stores that provide healthy foods or access to safe areas in which to engage in physical activity. These social inequities in turn lead to increased susceptibility to disease. Socioeconomic factors such as employment and lack of health insurance negatively impact access to health care. The model in Figure 6-2 depicts these relationships. Together, the factors in this model have significant contributions to observed health disparities.
Figure 6-2. Impact of social determinants of health on health disparities. (Reproduced with permission from Baker TA, Whitfield KE. Handbook of Minority Aging. New York: Springer; 2013.)
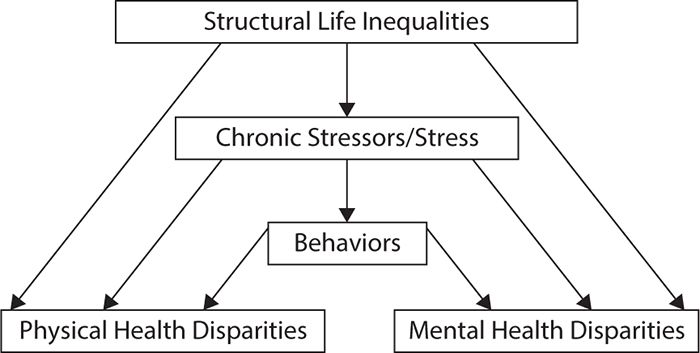
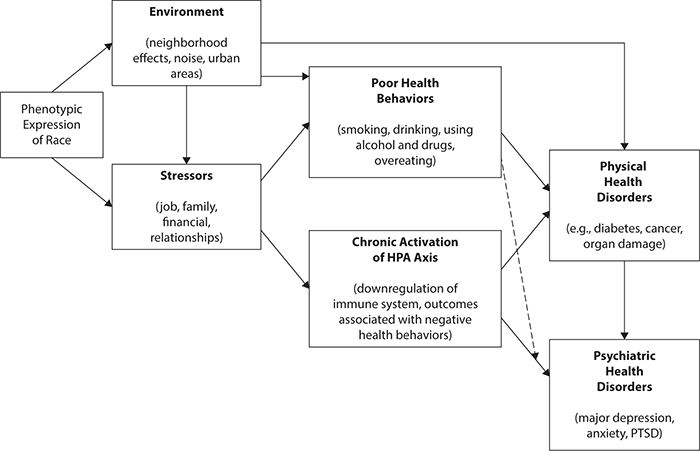
Slightly more complex models are shown in Figures 6-3 and 6-4, which suggest that structural life inequalities based on access to high-quality education, good nutrition, well-paying jobs, safe living environments, reliable transportation, adequate health insurance coverage, and culturally competent health care are chronic stressors for people who face these inequalities on a daily basis. Facing these chronic stressors results in chronic activation of the hypothalamic–pituitary–adrenal axis system and subsequent downregulation of the immune system. Therefore, in response to chronic stressors, people tend to engage in activities that make them feel good and bring a temporary relief from the stressors, such as eating comfort food, smoking, and overusing drugs and alcohol. Others may develop health-damaging psychological responses to the structural life inequalities, such as internalized racism or feelings of self-blame for poor living conditions. It has been noted that engaging in these activities initially reduces activation of the stress-response network. The unfortunate consequence lies in the fact that the very activities that people use to temporarily reduce their levels of stress eventually lead to increased risk of disease and to poor health outcomes, contributing ultimately to further long-term stress.
Figure 6-3. Impact of social determinants of health on health disparities. (Data from Williams DR, Mohammed SA. Racism and health II: a needed research agenda for effective interventions. Am Behav Sci. 2013;57(8):1200-1226.)
Figure 6-4. Environmental stressors, physiologic stress responses, negative behavioral coping strategies, and subsequent physical and psychiatric health disorders. HPA, hypothalamic–pituitary–adrenal; PTSD, posttraumatic stress disorder. (Data from Baker TA, Whitfield KE. Handbook of Minority Aging. New York: Springer; 2013.)
MEASUREMENT ISSUES IN HEALTH DISPARITIES RESEARCH
As noted earlier, race and ethnicity interface with social determinants of health to produce health disparities. Before these disparities can be accurately evaluated and described, however, race and ethnicity first must be accurately defined and conceptualized.
By the year 2050, racial and ethnic minorities will comprise 47.5% of the total U.S. population. In 2010, African Americans made up 12.6% of the U.S. population, an increase from 12.3% in 2000. In 2010, Hispanics/Latinos comprised 16.3% of the total U.S. population, almost half again as high as it was a decade earlier.
Race and ethnicity are complex and multidimensional constructs. For racial and ethnic categorizations to be most meaningful, they should lead to consistent data over time, allow data from populations and surveys to be compared, and use terms that are understood by the people who complete the surveys (Sawyer, 1998).
What Is Race?
Despite the use of phenotypic expressions of racial group membership (e.g., skin color) as a social construct that is associated with the allocation of resources such as education, housing, and employment, the validity of race as an indicator of genetically different population groups has been questioned widely. No racial group possesses a completely discrete set of genetic characteristics. In fact, there is significantly greater genetic variation within phenotypically defined racial groups than there is between them, with 85% variation within racial group and 15% variation between groups. All individuals are 99.0% to 99.5% identical at the DNA level. In addition, definite biologic links between racial group and disease have been found only rarely (e.g., sickle cell disease). Instead, differences in disease prevalence may be due to genetic differences; dietary, cultural, environmental, and socioeconomic factors; or a mixture of both.
As a social construct, the phenotypic expressions of race influence social interactions that predict exposure to health risks posed by environmental, social, and behavioral factors. From this perspective, health disparities are seen largely as arising from social-environmental factors (e.g., structural inequalities in access to high-quality education, employment, and housing) that influence disease susceptibility, as well as access to medical care. For example, the single most important type of structural inequality that negatively affects health may be residential segregation, which impacts access to adequate educational systems and medical care. Thus, as shown in Figure 6-4, structural inequalities, based on phenotypic expression of race, result in the persistence of health disparities.
What Is Ethnicity?
Although the terms “race” and “ethnicity” sometimes are used interchangeably, they actually represent two different constructs. Ethnicity, similar to race, is a social-political construct. However, ethnicity refers to sharing a common culture, language, religion, and cultural traditions.
Ethnicity embodies cultural identification. An important point to make is that such identification is fluid and may change over time. For example, a young third-generation Armenian American might culturally identify more strongly with the general American culture than with Armenian culture. However, as the person ages, he or she might adhere more strongly to the values and traditions of Armenian culture and may begin to self-identify more with Armenian culture. Ethnic self-identification becomes important during life passages such as selecting a marriage partner, becoming parents, and raising children. This means that survey results based on responses to ethnic identity may change over the life course.
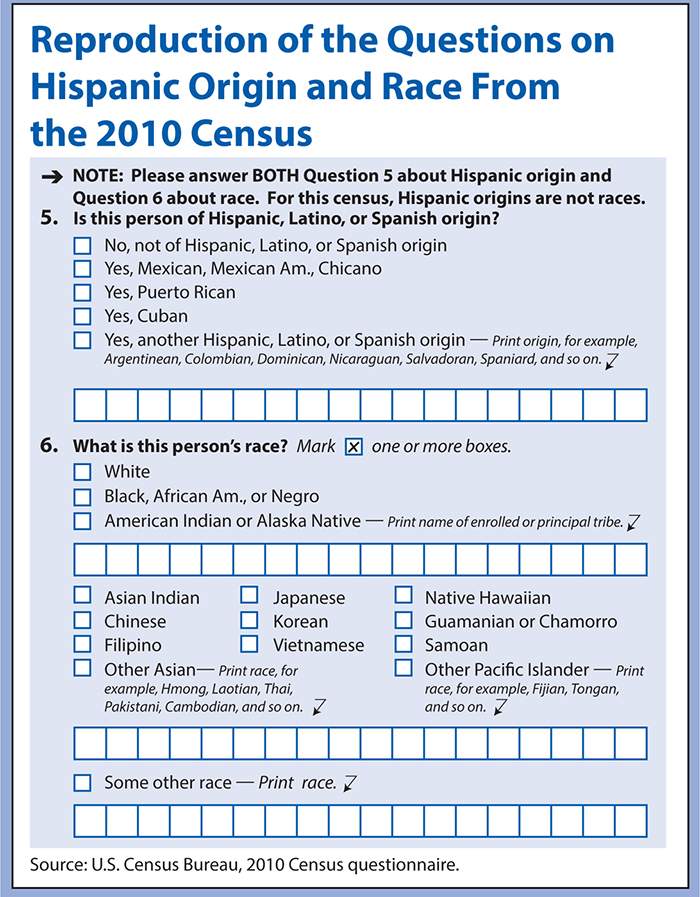
The revised Directive Number 15 of the Office of Management and Budget (OMB) includes criteria to use to classify people into categories of race and ethnicity. A minimum of five separate categories is mandated for self-identified racial classification: (1) white, (2) black, African American or Negro, (3) American Indian or Alaska Native, (4) Asian, or (5) some other race. Directive Number 15 defines white as a person having origins in any of the original peoples of Europe, the Middle East, or North Africa; black, African American or Negro is defined as a person having origins in any of the phenotypically black racial groups of Africa; American Indian or Alaska Native is defined as a person having origins in any of the original peoples of North and South America, including Central America; and Asian is defined as a person having origins an any of the original peoples of the Far East, Southeast Asia, or the Indian subcontinent, including people from Cambodia, China, India, Japan, Korea, Malaysia, Pakistan, the Philippine Islands, Thailand, and Vietnam.
The application of Directive Number 15 as used in Census 2010 is shown in Figure 6-5. It is important to note that although most surveys of population health status and outcomes using the format mandated in Directive Number 15 include ethnic groups only for Hispanics/Latinos and Asian Americans, every racial group includes multiple ethnic subgroups. For example, among phenotypically defined European Americans, ethnic subgroups include Germans, Hungarians, Ukrainians, and so on. Among phenotypically defined African Americans, ethnic subgroups include Nigerians, Kenyans, Jamaicans, Haitians, and so on. In 2002, Ford et al. suggested that the Directive Number 15 categories be used as core modules to categorize race and ethnicity. Then, in regions of the country where larger ethnic subpopulations exist, in addition to the standardized core modules, population-specific modules could be added. This approach could allow investigators to collect data on race using a standardized format to allow cross-site comparisons of study outcomes while at the same time collecting data on population-specific ethnic subgroups whose culturally based attitudes, behaviors, and social positions related to structural inequalities could influence the outcomes under study.
Figure 6-5. Reproduction of the questions on Hispanic origin and race from the 2010 Census (Data from Humes KR, Jones NA, Ramirez RR. 2010 Census Redistricting Data (Public Law 94-171) Summary File. U.S. Department of Commerce Economics and Statistics Administration. U.S. Census Bureau. http://factfinder2.census.gov/main.html. Retrieved November 19, 2014.)
HEALTH DISPARITIES IN THE UNITED STATES
The burgeoning of health disparities research was stimulated by specific mandates to address broadly adverse health outcomes, which have exposed persistent health and health care disparities. A number of policies have been instituted to support studies in examining the contributing factors and intervention targets that work toward reducing and eliminating differences in the burden of disease and medical care among population subgroups. With the high prevalence and mortality rate of specific chronic conditions across disadvantaged populations, the following disease categories exemplify health disparities that require an in-depth view and targeted efforts to make substantial impacts on health outcomes in the United States.
Cardiovascular Disease
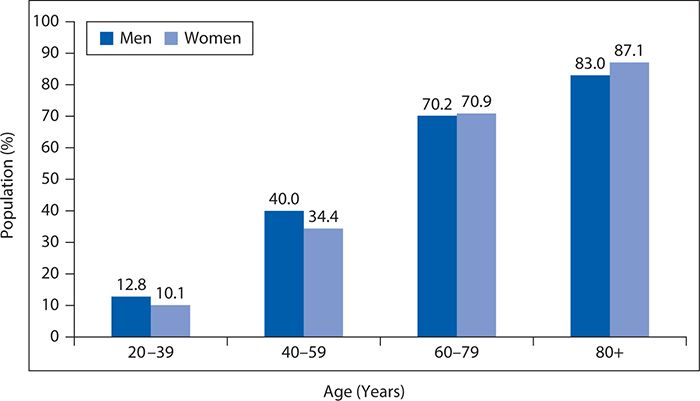
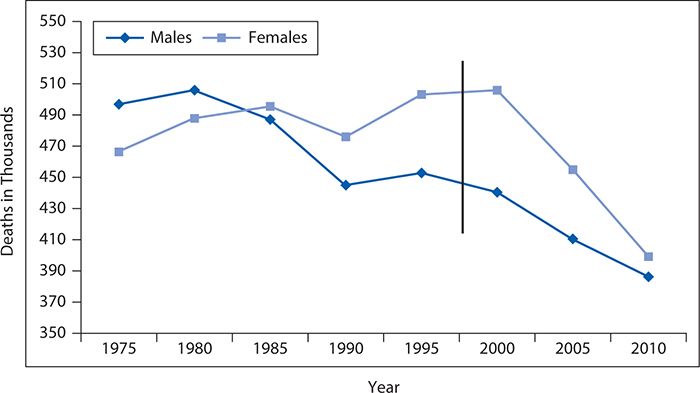
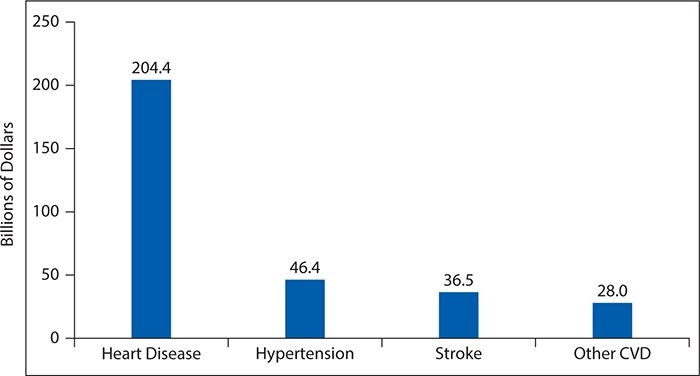
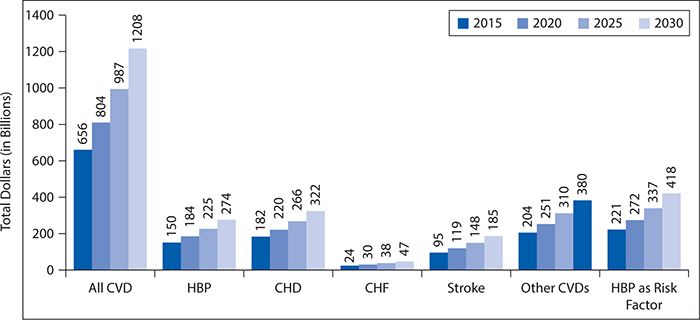
Cardiovascular disease remains the most prevalent disease in the United States, affecting more than 83 million men and women 20 years of age and older. Figure 6-6 shows the prevalence of CVD in adults 20 years of age and older by age and gender. Diseases such as stroke, coronary heart disease, and heart failure also contribute to the escalating numbers of individuals diagnosed with CVD. Although mortality rates have declined by one third between 2000 and 2010, CVD remains the leading cause of death in the United States, accounting for one in three deaths. Figure 6-7 shows CVD mortality trends for men and women (United States: 1979–2010). In 2009, it was estimated that $312.6 billion was spent on CVD. A total of $192.1 billion was spent in direct patient care. By 2030, total expenditures for CVD are expected to reach more than $800 billion. See Figure 6-8 for costs of CVD and stroke in the United States in 2010 and Figure 6-9 for projected costs in 2015 to 2030.
Figure 6-6. Prevalence of cardiovascular disease in adults by age and gender. (Reproduced with permission from Go AS, Mozaffarian D, Roger VL, et al. American Heart Association Statistics Committee and Stroke Statistics Subcommittee. Heart disease and stroke statistics—2013 update: a report from the American Heart Association. Circulation. 2013;127(1):e6-e245. © 2013 American Heart Association, Inc.)
Figure 6-7. Prevalence of cardiovascular disease in men and women. (Reproduced with permission from Go AS, Mozaffarian D, Roger VL, et al. American Heart Association Statistics Committee and Stroke Statistics Subcommittee. Heart disease and stroke statistics—2013 update: a report from the American Heart Association. Circulation. 2013;127(1):e6-e245. © 2013 American Heart Association, Inc.)
Figure 6-8. Direct and indirect costs of cardiovascular disease (CVD) and stroke (in billions of dollars), United States, 2010. (Reproduced with permission Go AS, Mozaffarian D, Roger VL, et al. American Heart Association Statistics Committee and Stroke Statistics Subcommittee. Heart disease and stroke statistics—2013 update: a report from the American Heart Association. Circulation. 2013;127(1):e6-e245. © 2013 American Heart Association, Inc.)
Figure 6-9. Projected expenditures for cardiovascular disease (CVD), United States, 2015 to 2030. CHD, coronary heart disease; CHF, congestive heart failure; HBP, high blood pressure. (Reproduced with permission from Go AS, Mozaffarian D, Roger VL, et al. American Heart Association Statistics Committee and Stroke Statistics Subcommittee. Heart disease and stroke statistics—2013 update: a report from the American Heart Association. Circulation. 2013;127(1):e6-e245. © 2013 American Heart Association, Inc.)
Marked disparities—gender, racial/ethnic, geographic—exist in the prevalence, morbidity, and mortality associated with CVD and its related risk factors. Subgroups including African Americans, Hispanics, particularly Mexican Americans, persons with lower SES, people residing in the Southeastern United States and Appalachia, and people with lower educational levels (less than high school) tend to have a higher burden of CVD and its related risk factors. In a systematic review of racial and ethnic differences in CVD risk factors, Kurian et al. found elevated risk and higher prevalence for racial/ethnic minority groups in hypertension, diabetes, obesity, and physical inactivity. Risk and prevalence were nearly equivalent for all racial/ethnic groups in terms of assessing hypercholesterolemia and smoking status.
With a higher prevalence of CVD in the U.S. population, greater acknowledgement of differences in risk factors and medical care of those living with these chronic diseases has been the focus of much research effort in the past 2 decades. To date, initiatives targeting reduction of adverse CVD-related outcomes lack breadth and depth among racial/ethnicity minority populations in regards to access to care, treatment intensity, risk factor management, and prevention. This subgroup layered with low SES status or rural residence places them at an even greater risk of poor CVD outcomes.
The rate of CVD mortality has likely been tempered by a range of advancements in technology, from better diagnostic and therapeutic approaches for cardiac revascularization to more effective management of CVD risk factors. Greater attention to risk factors for CVD also has resulted in substantial efforts to target smoking reduction and cessation; increase physical activity; address overweight and obesity; and control cholesterol, blood pressure, and blood glucose levels.
Diabetes
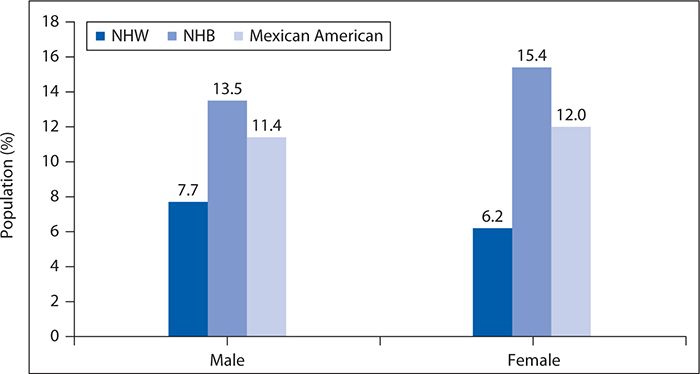
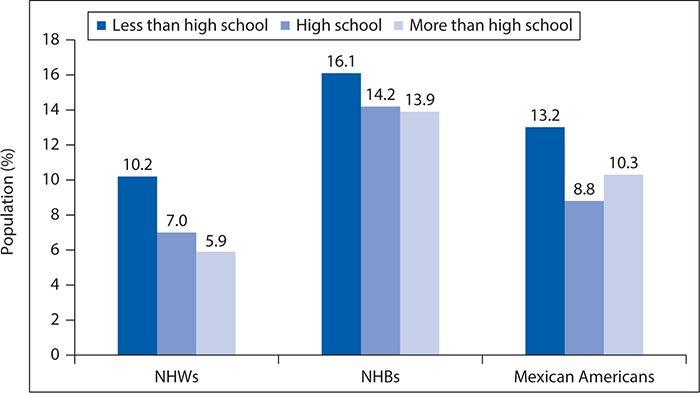
Diabetes affects 25.8 million people, or 8.3% of the United States population, and is the seventh leading cause of death in the United States. It is also the leading cause of kidney failure, nontraumatic lower limb amputations, and new cases of blindness among adults and is a major cause of heart disease and stroke. Ninety percent of all cases of diabetes are categorized as T2DM, characterized by insulin resistance rather than absolute insulin deficiency. Figures 6-10 and 6-11 show the prevalence of diagnosed diabetes by race/ethnicity and gender and race/ethnicity and years of education, respectively.
Figure 6-10. Age-adjusted prevalence of physician-diagnosed diabetes mellitus in adults age 20 years of age and older by race/ethnicity and sex. NHB, non-Hispanic black; NHW, non-Hispanic white (National Health and Nutrition Examination Survey, 2007–2010). (Reproduced with permission from Go AS, Mozaffarian D, Roger VL, et al. American Heart Association Statistics Committee and Stroke Statistics Subcommittee. Heart disease and stroke statistics—2013 update: a report from the American Heart Association. Circulation. 2013;127(1):e6-e245. © 2013 American Heart Association, Inc.)
Figure 6-11. Age-adjusted prevalence of physician-diagnosed type 2 diabetes mellitus in adults 20 years of age and older by race/ethnicity and years of education. NHB, non-Hispanic black; NHW, non-Hispanic white (National Health and Nutrition Examination Survey, 2007–2010). (Reproduced with permission from Go AS, Mozaffarian D, Roger VL, et al. American Heart Association Statistics Committee and Stroke Statistics Subcommittee. Heart disease and stroke statistics—2013 update: a report from the American Heart Association. Circulation. 2013;127(1):e6-e245. © 2013 American Heart Association, Inc.)
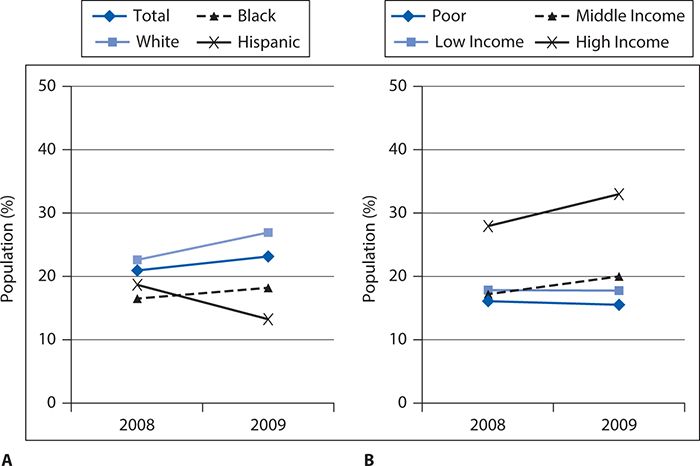
The rate of diagnosed diabetes has steadily increased and is projected to continue, creating a disease of epidemic proportions. Additionally, NHBs have poorer outcomes than NHW population across several indicators of care. Figure 6-12 shows quality of care indicators by race/ethnicity for adults with T2DM. NHBs and Hispanics continue to receive lower quality of care than NHWs. Similarly, patients of lower SES also continue to receive poorer quality of care than those with higher SES.
Figure 6-12. Racial/ethnic differences in quality of care indicators for adults with diabetes. Adults, age 40 and over with diagnosed diabetes who reported receiving four recommended services for diabetes in the calendar year (2+ hemoglobin A1c tests, foot exam, dilated eye exam, and flu shot) by (A) race/ethnicity and (B) income. (Reproduced from Agency for Healthcare Research and Quality. National Healthcare Quality & Disparities Reports. Rockville, MD; March 2012. http://www.ahrq.gov/research/findings/nhqrdr/index.html. Retrieved November 19, 2014.)
Although T2DM is a concern for all racial and ethnic groups, minorities have elevated prevalence, risks from complications, and mortality rates. Compared with NHW adults, the risk of diagnosed diabetes was 77% higher among NHBs. After being diagnosed, NHBs are four times more likely to develop end-stage renal disease and more likely to undergo lower limb amputations compared with NHWs. Additionally, the average life years lost by diagnosis vary by ethnicity, with NHB women losing on average 12 years compared with NHW women losing 10.3 years and NHB men losing 9.3 years compared with NHW men losing 8 years.
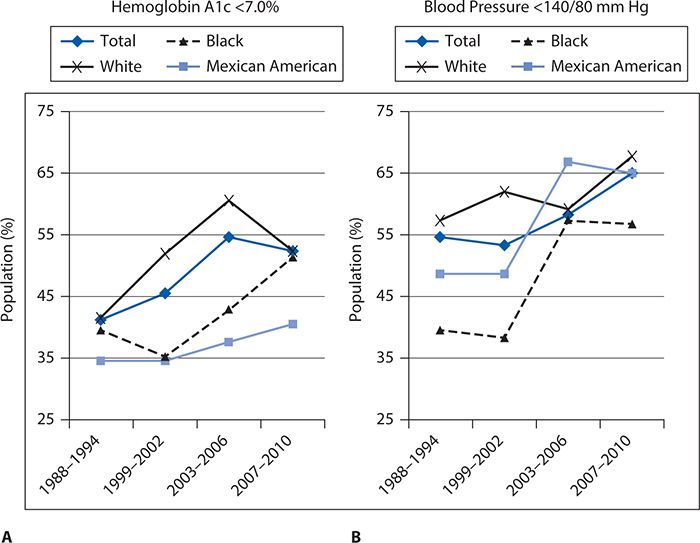
Ethnic differences in poor outcomes in T2DM can be attributed to patient, provider, and health systems level factors. See Figures 6-13 and 6-14 for outcomes by race/ethnicity and race/ethnicity and income, respectively, in adult patients with diabetes. Provider and health system factors account for less than 10% of variance in major diabetes outcomes, including HbA1c, lipid control, and resource use; hence, major emphasis needs to be placed on patient-level factors that have strong explanatory power. Key differences appear to be at the patient level. Of the patient-level factors, consistent differences between African Americans and European Americans with T2DM have been found in diabetes knowledge, self-management skills, empowerment, and self-efficacy or perceived control. An important area that has not been studied adequately is the contribution of social determinants of health to diabetes outcomes and how these factors explain the observed ethnic differences in key outcome variables for T2DM.
Figure 6-13. Outcomes for diabetes by race/ethnicity. (A) Glycemic (blood sugar) control by race/ethnicity based on glycosylated hemoglobin A1c <7.0%. (B) Blood pressure control by race/ethnicity based on measurement < 140/80 mm Hg. (Reproduced from Agency for Healthcare Research and Quality. National Healthcare Quality & Disparities Reports. Rockville, MD; March 2012. http://www.ahrq.gov/research/findings/nhqrdr/index.html. Retrieved November 19, 2014.)
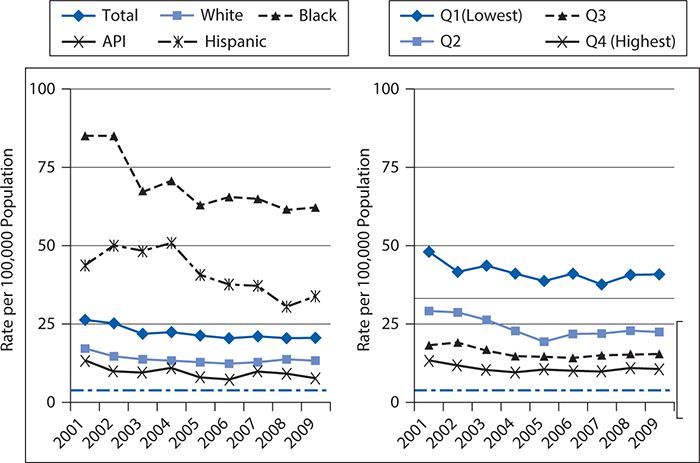
Figure 6-14. Hospitalizations for uncontrolled diabetes by race/ethnicity and area income. API, Asian Pacific Islander. (Reproduced from Agency for Healthcare Research and Quality. National Healthcare Quality & Disparities Reports. Rockville, MD; March 2012. http://www.ahrq.gov/research/findings/nhqrdr/index.html. Retrieved November 19, 2014.)
Cancer
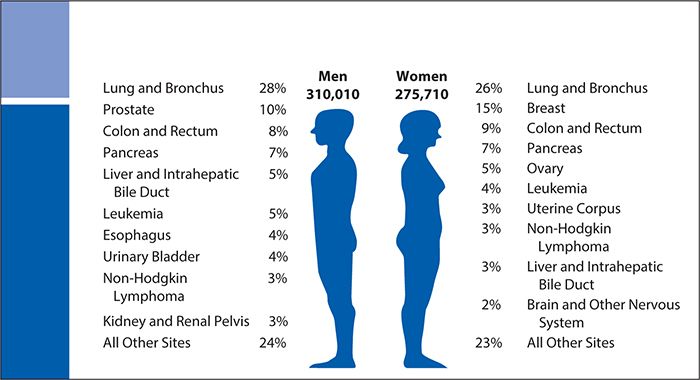
Nearly 14 million Americans currently have a history of cancer, and another approximately 1.7 million new cases of cancer are expected to be diagnosed each year in the United States. As the second leading cause of death in the United States, about 600,000 Americans are expected to die of cancer, averaging approximately 1600 people daily. Figure 6-15 shows the estimated cancer deaths for men and women in the United States in 2014. Additionally, the NIH estimates overall cancer costs more than $215 billion, with nearly $90 billion allocated to direct medical costs and approximately $130 billion for indirect costs.
Figure 6-15. Estimated cancer deaths in the United States in 2014. (Data from Siegel R, Ma J, Zou Z, et al. Cancer statistics, 2014, CA Cancer J Clin. 2014 Jan-Feb;64(1):9-29.)
Overall, NHB men have a 14% higher incidence of cancer compared with NHW men, and NHB women have an overall lower incidence of cancer compared with NHW women. Cancer disparities arise not only from the traditional sources of inequities, such as access, demographic characteristics, SES, and geography, among others (cultural, environmental, and so on), but also from barriers preventing high-quality care for cancer, including prevention, early detection, and treatment. People belonging to lower socioeconomic groups disproportionately have higher rates of cancer deaths than those of higher SES, and efforts to reduce the cancer death rates in persons with lower SES have been slow to occur. Evidence supports the notion that people of lower SES are more likely to engage in behaviors such as smoking, not being physically active, and eating a poor diet that increase their cancer risk (see Chapter 5). People of lower SES are also more likely to be uninsured or lack adequate health insurance coverage, which increases the likelihood of receiving a diagnosis when the cancer has already advanced, reducing viable treatment options. Ultimately, this leads to a lower 5-year survival from the cancer diagnosis.
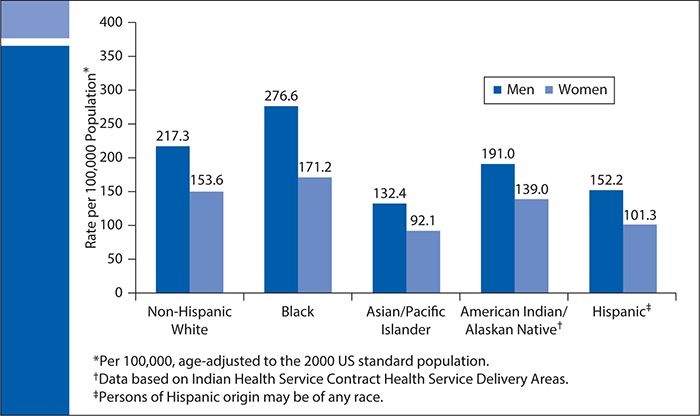
According to the American Cancer Society (ACS), racial/ethnic cancer disparities are due largely to poverty and the barrier it poses to receiving high-quality health care services needed to successfully overcome a diagnosis of cancer. Racial and ethnic minorities, particularly NHBs and Hispanics, are more likely to live below the poverty line compared with NHWs, and as a result, they often receive lower quality care (including delayed diagnosis and less aggressive treatment), resulting in higher rates of death secondary to cancer. Figure 6-16 shows cancer death rates by race and ethnicity. Additionally, it is noteworthy to mention the Hispanic paradox that has existed historically in the United States for nearly 20 years. Despite having lower income and educational levels, Hispanics in the United States often have better health and longer life expectancies by several years compared with NHWs. Research has shown that people who have lower income and educational levels have a higher prevalence of cancer and other chronic diseases and an increased risk of death. In fact, the mortality rate for Hispanics in the United States resembles that of NHWs despite living at poverty levels and having educational levels similar to those of NHBs. The reasons for this paradox are unknown; however, the causes are thought to be multifactorial and social in origin with variations in age, gender, Hispanic subgroup, acculturation, country of birth, and cause of death postulated as associated with this consequence. In addition, cultural factors, including better health habits and stronger social support networks, within the Hispanic community are thought to confer protection against adverse outcomes such as incident disease and higher mortality rates.
Figure 6-16. Cancer death rates by race and ethnicity. (Data from Siegel R, Ma J, Zou Z, et al. Cancer statistics, 2014, CA Cancer J Clin. 2014 Jan-Feb;64(1):9-29.)
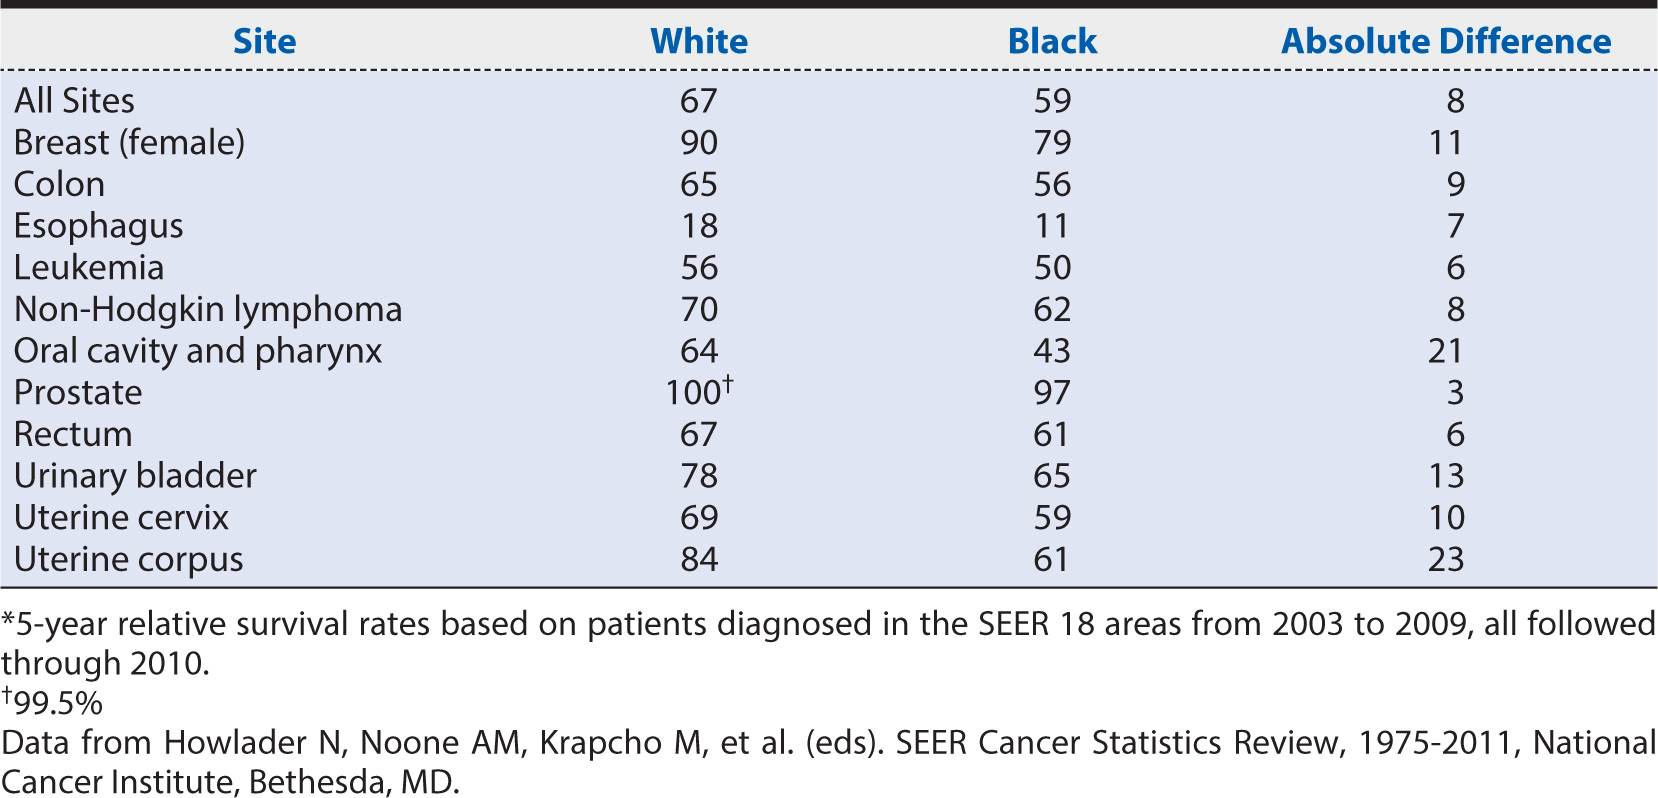
In a study of more than 60,000 people to assess the impact of health care utilization and cancer susceptibility on the incidence and mortality rate of colorectal cancer, Laiyemo and colleagues found NHBs to undergo diagnostic evaluation less often and to have less follow-up for detectable abnormalities compared with NHWs. Furthermore, minority groups are more likely to develop cancer at disproportionately higher rates compared with NHWs. NHBs are more likely to develop and die from cancer than any other racial or ethnic group. NHBs have the highest incidence and mortality from colorectal cancer compared with other racial/ethnic groups. Since 1960, the mortality rate from colorectal cancer in NHB has increased by almost one third, as rates have declined by about 40% in NHWs during that same time period. As racial/ethnic cancer disparities are prominent, gender disparities are also prevalent. For example, NHB men and women have higher incidence and mortality rates from colorectal cancer compared with NHWs of the same gender. Almost a quarter million women are diagnosed with breast cancer annually, with an estimated 40,000 dying from this disease. Disparities in breast cancer exist between women, with NHW women developing it at faster rates but NHB women dying from it at faster rates. See Table 6-1 for differences in cancer survival rates by race/ethnicity. Organizations such as the ACS must continue to advocate for and seek equitable care for populations disproportionately affected by cancer.
Table 6-1. Five-year relative cancer survival rates by race.*
Renal Disease
According to the National Kidney Foundation Kidney Disease Outcomes Quality Initiative (KDOQI) guidelines, chronic kidney disease (CKD) is defined as the presence of markers of kidney damage, including albuminemia or a sustained reduction in estimated glomerular filtration rate (GFR), which progressively reduces over five stages. In 2005 to 2010, the prevalence of CKD was 6.3% compared with 9.3% and 8.5% for diabetes and CVD, respectively, when defined by GFR. When defined by an albumin-to-creatinine ratio, the prevalence of CKD rises to 9.2% in the general population. See prevalence estimates in Figure 6-17. CKD accounts for 5.7% of deaths that occur within 30 days of hospitalization for adults 66 years of age and older.
Figure 6-17. Distribution of National Health and Nutrition Examination Survey (NHANES), 2005 to 2010. ACR, albumin/creatinine ratio; CKD, chronic kidney disease; CVD, cardiovascular disease; DM, diabetes mellitus; eGFR, estimated glomerular filtration rate. (Reproduced with permission from U.S. Renal Data System. USRDS 2013 Annual DataReport: Atlas of Chronic Kidney Disease and End-Stage Renal Disease in the United States. Bethesda, MD: National Institutes of Health, National Institute of Diabetes and Digestive and Kidney Diseases; 2013.)
End-stage renal disease (ESRD) follows the progression of CKD and is the ultimate result of irreversible and complete damage to the kidneys, requiring hemodialysis or transplant. Being relatively stable since 2000, the rate of new ESRD cases per million of the general population has fallen recently, but is still prevalent in the United States, accounting for nearly $15 billion annually in Medicare and non-Medicare costs.
End-stage renal disease is mostly caused by diabetes and hypertension, disorders more prevalent in racial/ethnic minority populations and persons with lower SES. As a result, NHBs have a greater risk of CKD and over the past decade have experienced a four to six times increase in ESRD compared with NHWs. Additionally, Nicholas and colleagues found a more than 17-fold greater rate of hypertension as a cause of ESRD among NHBs. It is noteworthy to recognize also that after they have been diagnosed with CKD, NHBs and Hispanics are four times more likely to develop ESRD and more likely to undergo a lower limb amputations. Surprisingly and despite the alarming prevalence and incidence of CKD and ESRD in racial/ethnic minorities, however, NHBs and Hispanics have a greater adjusted survival rate than NHWs. Evidence shows that this paradox tends to emerge after minority populations, and particularly older members of the group (i.e., those at least 50 years of age), are on dialysis. Compared with NHWs, for example, fewer NHBs receive care from nephrologists and fewer receive referrals for peritoneal dialysis and transplantation. Despite this disparity, however, NHBs with ESRD are reported to have 13% to 45% lower mortality rates when receiving dialysis compared with NHWs. Although the cause of this disparity remains unclear, a unique relationship among multiple factors—biologic, genetic, environmental, sociocultural, and health care system levels—is considered a contributing factor. Specifically, reasons such as differential sensitivity to dialysis dosages and racial differences in nutritional status and levels of inflammation may influence this observed difference between NHBs and NHWs. Additional evidence is needed to reduce this racial/ethnic divide and improve patient outcomes in patients with CKD and ESRD.
The social determinants associated with CKD are numerous. Disparities in CKD are influenced by multiple factors, including access to care, poverty, SES, gender, dietary factors, obesity, food insecurity, and race/ethnicity. For example, Nicholas and colleagues report that women and minorities with CKD who are not on dialysis have lower rates of cardiovascular procedures than NHWs. Because women generally live longer than men, Grams and colleagues report a greater lifetime burden of CKD for women than men. Patzer and colleagues report a possible link between diet quality and SES measures, such as income and education. In a study to assess the effect of food insecurity on CKD in lower SES and poverty-stricken Americans, Crews et al. reports that food insecurity may contribute to disparities in CKD, particularly in persons diagnosed with obesity, diabetes, and hypertension. Because it is common for many racial/ethnic minorities to live below the poverty line compared with majority NHWs, it is not surprising that racial/ethnic minorities carry a higher burden of disease and develop CKD and ESRD at higher rates.
THE CAUSES OF HEALTH DISPARITIES
Determinants of health disparities are shaped by the interaction of multiple factors such as social, environmental, biologic, and behavioral characteristics. An epidemiologic review of studies regarding deaths attributable to social factors estimated that of the nearly 3 million deaths in the United States in 2000, 9% were attributable to low education, 6% each to racial segregation and low social support, 5% to individual-level poverty, and 4% to income inequality. Collectively, these attributable factors point to several areas for intervention (e.g., access to care, quality of care, health decision making, and the legacy of distrust) where policy-, system-, and provider-level effects can impact health outcomes substantially in disadvantaged populations.
Access to Care
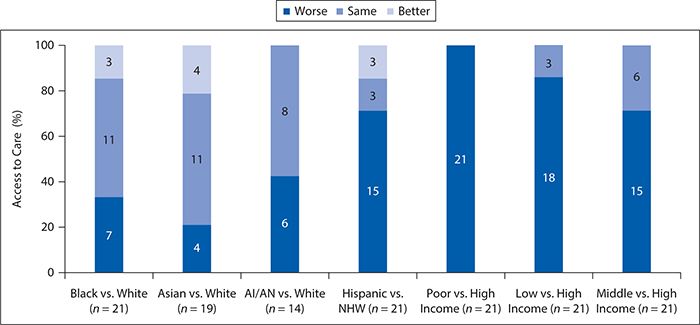
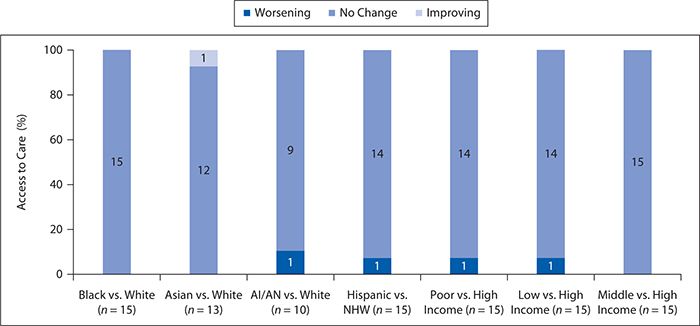
Access to medical care has become a consistent topic of discussion in the examination of health disparities and social determinants of health. In the United States, access to care remains suboptimal as a quarter of Americans report barriers when seeking health care. Figure 6-18 shows the number and proportion of all access measures for which members of selected groups experienced worse, same, or better access compared with the reference group. It shows that minority groups and those classified as “poor” had worse access to care compared with the majority white population. For example, NHBs had worse access to care for 33% of the measures, and Hispanics had 70% worse access to care compared with NHWs. Asian Americans had worse access to care by 20% compared with NHWs. Additionally, those of lower SES had greater than 80% worse access to care compared with those of higher SES. Alarmingly, disparities observed in access to care are worsening, which continues to perpetuate the disparities seen in health care. Figure 6-19 shows disparities in access to care by race and ethnicity, as well as income.
Figure 6-18. Access to care by race/ethnicity and income. AI, American Indian; AN, Alaska Native. (Reproduced with permission from Agency for Healthcare Research and Quality. National Healthcare Quality & Disparities Reports. Rockville, MD; 2014. http://www.ahrq.gov/research/findings/nhqrdr/index.html. Retrieved November 19, 2014.)
Figure 6-19. Disparities in access to care by race/ethnicity and income. AI, American Indian; AN, Alaska native; NHW, non-Hispanic white. (Reproduced with permission from Agency for Healthcare Research and Quality. National Healthcare Quality & Disparities Reports. Rockville, MD; 2014. http://www.ahrq.gov/research/findings/nhqrdr/index.html. Retrieved November 19, 2014.)
In 1993, the IOM defined access to health care as “having the timely use of personal health services to achieve the best health outcomes.” The findings of many clinical studies provide evidence that racial and ethnic minorities experience significant disparities in access to care compared with NHWs. Factors such as lower SES and lower rates of health insurance coverage among minority groups are believed to contribute to the divide seen in care. NHBs and Hispanics are more likely to enroll in managed care health plans and are less likely to have care coordinators, often referred to as “gatekeepers,” and receive referrals for specialty care, when available, compared with NHWs, thus perpetuating the disproportionate access to care experienced by racial and ethnic populations.
In a study to assess racial and ethnic differences in access to medical care in managed care plans, Hargraves and colleagues examined five commonly used measures of access and utilization: having a usual source of care, having a regular provider, making visits to the physician, using emergency services, and accessing specialty care. Compared with NHWs, Hispanics had less access to care and more utilization, lacking a regular provider and frequenting the emergency department more often. Similarly, NHBs were less likely to have regular providers and more likely to seek primary care using emergency services compared with NHWs. Compared with both NHBs and NHWs, however, Hispanics did poorly in all measures of access to care, including being less likely to have terminal visits with specialists. Surprisingly, NHBs received comparable care compared with NHWs in terms of seeing a provider within the previous year and having access to specialty care.
In their study to assess racial and socioeconomic disparities in access to primary care among people with chronic conditions, Shi and colleagues found that racial disparities are associated with not having a usual source of care, provider type, or location. Minority groups were less likely to have a usual source of care and were more likely to use hospitals and facilities for care (instead of a regular physician or other health care provider). One of the goals for Healthy People 2020 is to provide comprehensive and quality health care services to all Americans. To achieve this goal, efforts must be focused on improving the health care of racial and ethnic minorities. By doing so, we may be able to achieve a second goal of Healthy People 2020, which is to reduce health disparities.
Quality of Care
Access to the health care system does not automatically assure high quality of care (see Chapter 15). Evidence exists that minorities experience a higher burden of disease and receive a lower quality of care than nonminorities. Additionally, members of minority groups have higher rates of disability and mortality than the majority population, but they are not receiving equitable and quality care.
In Unequal Treatment: Confronting Racial and Ethnic Disparities in Healthcare, a 2002 report by the IOM, it was documented that racial and ethnic minorities receive lower quality of health care than nonminority populations even when adjusting for factors related to access. Those belonging to minority groups often experience multiple obstacles and barriers to care despite having equivalent resources compared with NHWs. It is postulated that factors such as access, clinical appropriateness, and patient preferences are not solely responsible for the inequalities seen in health care quality. Behavioral, social, economic, cultural, biologic, and environmental factors are all believed to contribute to disparities in quality of care.
The IOM report also suggests that disparities in health care quality are multifactorial, citing historical and contemporary inequities; financial and institutional arrangements of health care systems; and legal, regulatory, and policy environments as additional factors associated with poorer quality of care in minority populations. Furthermore, evidence suggests that provider biases (whether conscious or unconscious), behaviors, and practice patterns also contribute to disparities in quality of care. Provider preferences and practices in referral and treatment continue to perpetuate the divide in quality of care between minorities and nonminorities.
According to the National Health Disparities Report, access to care continues to worsen, while quality of care has begun to improve marginally. In 2009, about one third of all Americans reported not receiving quality care. More efforts need to be devoted to racial/ethnic minorities to improve their access to comprehensive, quality health services.
Health Decision Making
According to the medical literature, three styles of health decision making are used in clinical care. Information transferred between those making health decisions can be one way, either solely from the provider or the patient to the other, or two way, in which decision making is shared between the patient and provider. Whereas one-way information transfer from a provider to a patient is known as a paternalistic style, information from the patient to the provider is termed consumerist. When the exchange of information and deliberation of information occurs between the patient and provider, and the provider offers medical information needed for the patient to make a personal and educated decision, the transfer is known as shared decision making. In this type of health decision making, the patient is responsible for sharing information that the provider needs when suggesting an appropriate course of care. Accounting for the values and beliefs of all parties involved, shared decision making has been shown to have the most benefit in improving health outcomes; it is unclear, however, how often this type of decision making occurs and if it is even preferred by those involved in the decision-making process.
There is a paucity of research on the relationship between SES and clinical health decision making, both of which have an association with health disparities. In their study to assess whether patients received their preferred style of decision making and its association with SES and perceived quality of care, Murray and colleagues found that people of higher SES and those with a regular physician preferred shared decision making compared with those of lower SES, who preferred one of the one-way types of communication. African Americans were reported as preferring the paternalistic style of information exchange. This may result from minority patients feeling less empowered with enough information to make clinical decisions. Additionally, Dovidio and colleagues suggest that the quality of communication is lower between providers and patients with racial discordance.
Dovidio and colleagues report that providers often possess personal beliefs, perceptions, values, and biases that influence their actions in the decision-making process and ultimately contribute to the development and persistence of differences in care among groups. These biases can be explicit—personal beliefs and values known to the individual, or implicit—unintentional, or unconscious perceptions and beliefs. Providers often possess explicit and implicit biases that inherently influence their decisions when caring for patients. These biases become of particular focus and interest when providers care for those of different races and ethnicities. For example, in a landmark case assessing physician recommendations for cardiac catheterization in black versus white patients, NHBs were less likely to be referred for the procedure compared with NHWs. More recently, Dovidio and colleagues reported that minority patients are less likely to be referred by providers for various types of surgeries (i.e., oral surgery and coronary bypass surgery), procedures, and treatments (i.e., pain medications) compared with NHW patients. Furthermore, when minorities are referred to have surgery, the recommendations for surgery are frequently unnecessary and not beneficial to the patients. The researchers hypothesize that black patients are often treated differently because some physicians consider NHBs, for example, less educated and less active than NHWs.
Legacy of Distrust
The legacy of distrust that exists between minority populations and the medical community is an undeniable consequence of historical experimentation on certain groups. One of the most notorious examples was the Tuskegee Syphilis Study of 1932 that was conducted by the U.S. Public Health Service. During that 40-year study, treatment was withheld from African American men diagnosed with syphilis with the intent of gaining a better understanding of the natural history of the disease. The moral problem was that effective treatments, although not available at the outset of the study, were developed while the long-term study was ongoing. Nevertheless, curative antibiotics were never given to the subjects. Moreover, the study subjects were never even informed of the existence of effective treatments for their illnesses or of the potential harm of continuing to be untreated. The subjects were highly vulnerable because they were poorly educated, had limited access to other health care, and were living in communities and at a time when expressing concern about unfair treatment might not have been welcomed or acted upon. As a result of this type of discrimination, minorities developed a distinctive sense of medical mistrust, a legacy that continues to persist.
Evidence suggests that trust is associated with several health-related objectives, including access, routine medical care and utilization of health care services, self-management behaviors, care continuity, health care costs, and quality of care. Higher levels of trust are associated with satisfaction of care, loyalty to providers, and better self-rated health status. Additionally, patients with more distrust often experience disparities in seeking medical care and adhering to medical recommendations. To maximize trust in the patient–provider relationship, provider characteristics, patient characteristics, and factors associated with the relationship must be taken into account.
African Americans represent the minority group with the highest level of distrust in the health care system, including distrust in providers, researchers, institutions, and insurers. Variances in trust of health care providers have been associated with health disparities in race, access to care, and satisfaction with care among African Americans compared with all other racial and ethnic groups. Similarly, Hispanics report high degrees of provider and medical system discrimination when seeking medical care. Discrimination toward Hispanics and medical mistrust are often compounded when cultural issues such as language proficiency and health literacy are taken into consideration. In a study to assess the effects of race/ethnicity and SES on health information seeking, confidence, and trust, Richardson and colleagues found that NHBs, Hispanics, and those of lower SES had a lower level or trust in health care providers compared with NHWs and those of higher SES.
POTENTIAL SOLUTIONS TO HEALTH DISPARITIES
Despite the many health disparities that presently exist in the United States, potential solutions to reducing and even eliminating these disparities are on the horizon. Strategies suggested by the IOM include improved patient–provider communication, using evidence-based algorithms, diversity training for health care professionals, and greater inclusion of diverse populations in the health care workforce. Each of these potential solutions is described in greater detail below.
Reducing Health Disparities by Improving Patient–Provider Communication
In a seminal study on the impact of patient–provider communication on health disparities, Ashton et al. reviewed the literature and found that even when access to care, diagnosis, and disease severity are controlled, NHWs and Latinos use fewer services requiring a physician’s order, such as hospitalization or invasive procedures, than NHWs. As these investigators argue, factors that impact patient–provider communication include a lack of shared language, using different terms to explain medical phenomena, and having different communication styles. All of these factors appear to contribute to poorer health outcomes among members of racially and ethnically diverse populations. Similarly, Levine and Ambady reviewed current literature on patient–provider communication and found that physicians tend to exhibit more disengaged nonverbal behavior with patients from different racial and ethnic groups and have a lower ability to interpret the nonverbal behaviors of these patients.
Although communication behaviors are difficult to change, it is possible for patients and physicians to be taught to communicate more effectively with each other. For example, patients could be taught to provide a health narrative, ask more questions, and express concerns during the medical visit, and physicians could be taught to engage patients by asking about what they perceive as the causes of their symptoms or the impact of the symptoms on the patient’s daily life.
Reducing Health Disparities by Using Evidence-Based Algorithms
Using evidence-based algorithms could play a significant role in reducing health disparities. If algorithms that have been found to be effective in the general population were applied to members of diverse populations, then it is expected that the burden of health disparities that is borne among racial and ethnic minorities in the United States would be reduced subsequently. This assumption has been supported many times in the scientific literature across multiple disease types. For example, Graham-Steed et al. showed that in an observational cohort analysis of 1270 men diagnosed with prostate cancer and followed for 11 to 16 years at nine Veterans Health Administration (VHA) medical centers, an equal-access health care system of U.S. veterans, mortality rates among NHB and NHW men with prostate cancer were comparable.
Similarly, Lee et al. examined data from 1008 VHA patients with pancreatic adenocarcinoma, 15% of whom were NHBs. No disparities were observed in disease management or survival between the NHB and NHW patients in the sample. Among patients with locoregional cancers, the odds of NHB patients receiving surgical resection, chemotherapy, and radiotherapy were not different from those of NHWs. The odds of receiving palliative chemotherapy were similar for NHBs with distant disease as for NHWs with distant disease. In addition, the median overall survival time did not differ between the two groups.
Likewise, Zullig et al. evaluated receipt of guideline-concordant colorectal cancer care among 2222 patients (14% of whom were NHBs) with incident colorectal cancer. No statistically significant differences were found for receipt of computed tomography scans, preoperative carcinoembryonic antigen testing, clear surgical margins, medical oncology referral for stages I and II, fluorouracil-based adjuvant chemotherapy for stage II, and surveillance colonoscopy for stages I to III.
In a study focusing on patients in the U.S. Military Health System, another equal-access health care system, Zheng et al. examined data from 10,181 patients (11% of whom were African American) with lung cancer. These investigators found that racial differences in survival were not statistically significant for adenocarcinomas, squamous cell carcinomas, or large cell carcinomas. More favorable crude survival was seen in NHB patients with small cell lung cancer than in NHWs with this disease but could not be attributed to other clinical factors. These results suggest that improving access of diverse patients to evidence-based treatment will significantly help to reduce disparities in disease outcomes.
Reducing Health Disparities through Diversity Training for Health Care Professionals
Diversity training could help to change the way health care providers interact with diverse patients. Truong et al. conducted a systematic review of cultural competency in skills development and its impact on quality of care. Typically, enhanced cultural competency results in moderate improvement in provider outcomes and health care access and use. Weaker evidence was seen for improvements in patient outcomes.
It has been suggested that medical training incorporating stories about patients that counter negative racial or ethnic stereotypes could result in more positive perceptions of members of these patient groups by medical professionals. In addition, physicians in training could be taught to recognize their own biases and then view intercultural interactions as opportunities to learn. In other words, bias can be unlearned.
A framework for redesigning medical education to meet the needs of an increasingly diverse population is presented by Alexandraki and Mooradian. These authors advocate for patient-centered communication, which has been shown to improve health outcomes, increase patient satisfaction, and enhance patients’ adherence to medical treatment regimens. Other suggestions for diversity training include interactive methods focusing on improving communication skills such as discussion groups and workshops, simulation, use of standardized patients to enhance patient–physician communication, and incorporating communication courses into medical school curricula.
Other innovative approaches for enhancing cultural sensitivity among health care providers include the use of online educational modalities; the use of community-based, longitudinal, ambulatory care training sites; and the use of interprofessional educational experiences targeted at communication, team building, and collective impact.
Reducing Health Disparities by Fostering Greater Inclusion of Diverse Populations in the Health Care Workforce
Although the percentage of medical school students and faculty who self-reported as underrepresented minorities has increased, the fact remains that the sociodemographic characteristics of the U.S. health care workforce are not reflective of the racial and ethnic diversity in the U.S. population. As noted in the Sullivan Commission’s report titled “Missing Persons: Minorities in the Health Professions,” diversity in the U.S. health care professions has lagged behind changing U.S. demographics, which may contribute significantly to disparities in health care access and outcomes.
In two recent observational studies with 64 primary care physicians and 489 of their patients, Thornton et al. made an interesting discovery about the impact of concordance between the physician and patient’s backgrounds in terms of race, ethnicity, and SES. These investigators discovered that when social concordance between physicians and patients was low compared with when social concordance was high, patients reported less positive perceptions of care in terms of lower ratings of satisfaction with the office visit and were also less likely to refer their physician to a friend. It is possible that social concordance is a proxy for better patient–physician communication.
Enhancing diversity among medical students is a step in this direction. Greater diversity among health care providers is linked to improved access to care among racially and ethnically diverse patients and to high-quality, culturally competent health care initiatives.
In summary, developing and implementing effective strategies related to patient–provider communication, evidence-based treatment algorithms, diversity training for health care professionals, and greater inclusion of diverse populations in the health care workforce can play major roles in reducing health disparities.
SUMMARY
This chapter presents a broad overview of health disparities in the United States. The chapter begins by defining disparities in health care as racial or ethnic differences that are not a result of access-related factors, clinical needs, preferences, or appropriateness of treatment intervention. In this context, race is best characterized not as a genetic property but rather as a social construct that influences human behavior, including, at times, prejudicial treatment. Ethnicity is often confused with race but represents a separate categorization of populations based on sharing a common culture, language, religion, and traditions. Disparities in health status and health care delivery according to race and ethnicity often reflect, in part, underlying socioeconomic differences among these groups but typically are not fully explained by these factors alone.
Within the United States, there are many examples of health disparities. Risk factors for chronic diseases, such as hypertension, obesity, and physical inactivity, tend to be higher among minority populations. Diseases such as heart and vascular conditions, T2DM, renal disease, and many forms of cancer also occur with greater prevalence and mortality among minority groups.
Health disparities arise from a variety of reasons, including but not limited to differential access and quality of health care available to various population groups. Variations in behavioral, social, economic, cultural, biologic, and environmental factors also contribute to disparities in health status and quality of care. Personal beliefs, perception, biases, and values also can impact, consciously or unconsciously, how providers make treatment decisions and interact with patients.
Historical overt acts of discrimination in medical research and patient care, such as the infamous Tuskegee Syphilis Study, have produced distrust within many minority communities. Nevertheless, progress can be made in addressing health disparities by addressing provider–patient communications, increasing the diversity of the health care workforce, and incorporating cultural competency skills development in the training of health professionals.
1. Which of the following are included in the Institute of Medicine’s definition of health care disparities?
A. Clinical appropriateness
B. Patient preferences
C. The operation of health care systems
D. The operation of legal and regulatory climates
E. Discrimination: biases, stereotyping, and uncertainties
F. B, D, and E
G. C, D, and E
H. B, C, D, and E
I. All of the above
2. By the year 2050, racial and ethnic minorities will comprise which percentage of the total U.S. population?
A. 20.0%
B. 47.5%
C. 67.5%
D. 87.5%
3. All individuals are 99.0% to 99.5% identical at the DNA level.
A. True
B. False
4. Which of the following is an example of an ethnic group?
A. Native Americans/American Indians
B. African Americans
C. Hispanics/Latinos
D. European Americans
E. Hmong
F. Ukrainians
G. A, C, D, and E
H. C, E, and F
I. All of the above
5. Which Directive of the Office of Management and Budget includes criteria to classify people into categories of race and ethnicity?
A. Directive Number 15
B. Directive Number 16
C. Directive Number 17
D. Directive Number 18
6. Federal policies to reduce and eliminate differences in the burden of disease and medical care among population subgroups include
A. the Minority Health and Health Disparities Research and Education Act of 2000 Public Law 106-525.
B. specific provisions from the Affordable Care Act.
C. the 2010 upgrade of the NIH National Center on Minority Health and Health Disparities to full institute status as the National Institute on Minority Health and Health Disparities.
D. A, C, and D.
E. B and C.
F. All of the above.
7. The causes of health disparities include racial/ethnic differences in
A. access to care.
B. quality of care.
C. health decision making.
D. legacy of distrust.
E. A, B, and C.
F. B, C, and D.
G. all of the above.
8. In the United States, which percentage of Americans report barriers when seeking health care?
A. 26.0%
B. 36.0%
C. 46.0%
D. 56.0%
9. African Americans represent the minority group with the highest level of distrust in the health care system.
A. True
B. False
10. Potential solutions to health disparities include
A. improving patient-provider communication.
B. reducing use of evidence-based algorithms.
C. diversity training for health care professionals.
D. fostering greater inclusion of diverse populations in the health care workforce.
E. A, B, and D.
F. A, C, and D.
G. all of the above.
Stay updated, free articles. Join our Telegram channel

Full access? Get Clinical Tree


