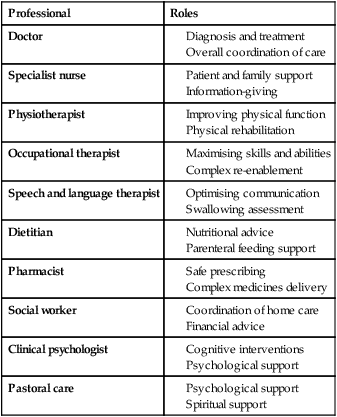
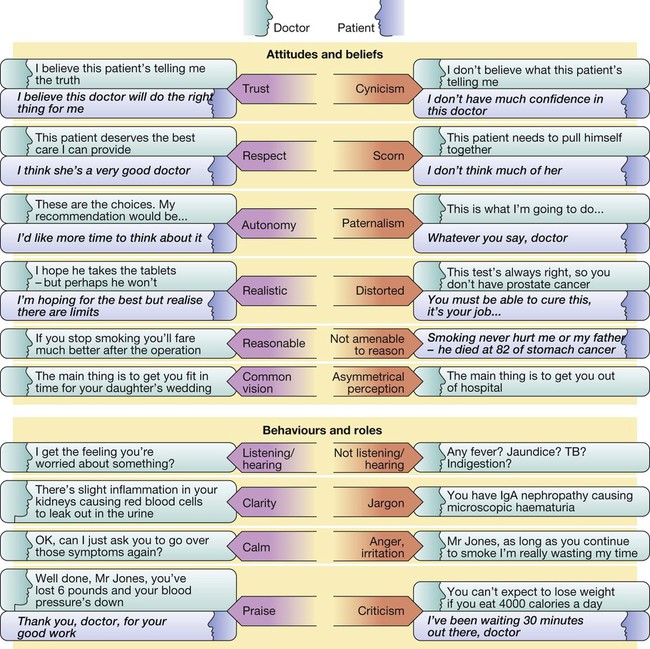
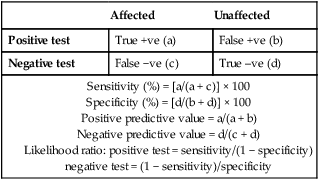
Due to the complexities of many chronic diseases and treatments, and the multifaceted impact of illness on a patient, there is an increasing role for health care to be delivered by a multidisciplinary team (Box 1.1). This model of care recognises the different skills of each allied health professional and focuses patient care beyond surgical procedures or pharmacological manipulation. The doctor usually takes the lead in determining the overall direction of care but must also: • guide the patient through the unfamiliar landscape, language and customs of clinical care • interpret, synthesise and convey complex information • help patients and families to participate fully in the decision-making process. In many clinical disciplines, doctors from several specialties form a multidisciplinary team in order to formulate a treatment plan. In oncology, for example, this ensures that various modalities of treatment (surgical, oncological and palliative) are considered. The doctor–patient relationship is in itself therapeutic; a successful consultation with a trusted and respected practitioner will have beneficial effects irrespective of any other therapy given. The doctor–patient relationship is multilayered, dynamic and bilateral (Fig. 1.1). Regulatory bodies, such as the UK General Medical Council, seek to define the medical side of the doctor–patient relationship in terms of the ‘Duties of a Doctor’ (Box 1.2). It is common for medical schools to require undergraduate students to sign an ethical code of conduct based on statements like this. Regardless of experience and skill, it is inevitable that, at some point in a doctor’s career, the doctor–patient relationship will break down. There can be many reasons for this; sometimes, these are beyond the control of the clinician, but often conflict arises when there is a genuine or perceived failure of the doctor to meet one or more of the duties outlined in Box 1.2. It is important to recognise a breakdown in the relationship quickly and, whenever possible, identify the reason. If patients are unhappy with an aspect of their care, they are entitled to a prompt, open, constructive and honest response that includes an explanation and, if appropriate, an apology. It is also important to reassure the patient that the issues raised will not adversely affect their future care. Failures in communication may lead to poor health outcomes, strained working relations, dissatisfaction among patients, their families and health professionals, anger and litigation. The majority of complaints received by health-care professionals could have been avoided by effective communication. Box 1.3 lists some common barriers to good communication. The main aim of a medical interview is to establish a factual account of the patient’s illness. The clinician must allow the patient to describe the problems without overbearing interrogation, but should try to facilitate the process with appropriate questions (Box 1.4). Techniques such as an unhurried approach, checking prior understanding, making it clear that the interviewer is listening, the use of silence when appropriate, recapping on what has been said, and reflection of key points back to the patient are all important. A major requirement is to express complex information and concepts in language with which the patient can readily engage. Non-verbal communication is equally important. The patient’s facial expressions and body language may betray hidden fears. The clinician can help the patient to talk more freely by smiling or nodding appropriately. Although some tests provide qualitative results (present or absent, e.g. faecal occult blood testing, p. 857), most provide quantitative results (i.e. a value on a continuous numeric scale). In order to classify quantitative results as normal or abnormal, it is necessary to define a ‘normal range’. Many quantitative measurements in populations exhibit a bell-shaped, or Gaussian, frequency distribution (Fig. 1.2); this is called a ‘normal distribution’ and is characteristic of biological variables determined by a complex mixture of genetic and environmental factors (e.g. height) and of test results (e.g. plasma sodium concentration). A normal distribution can be described by the mean value (which places the centre of the bell-shaped curve on the x axis) and the standard deviation (SD, which describes the width of the bell-shaped curve). Within each SD away from the mean, there is a fixed percentage of the population. By convention, the ‘normal range’ is defined as those values which encompass 95% of the population, i.e. the values within 2 SDs above and below the mean. If this convention is used, however, 2.5% of the normal population will have values above, and 2.5% will have values below, the normal range; for this reason, it is more precise to describe ‘reference’ rather than ‘normal’ ranges. ‘Abnormal’ results, i.e. those lying beyond 2 SDs from the mean, may occur either because the person is one of the 2.5% of the normal population whose test result is outside the reference range, or because he or she has a disease characterised by a different result from the test. Test results in ‘abnormal’ populations also have a bell-shaped distribution with a different mean and SD (see Fig. 1.2). In some diseases, there is typically no overlap between results from the normal and abnormal population (e.g. elevated serum creatinine in renal failure, p. 467). In many diseases, however, there is overlap, sometimes extending into the reference range (e.g. elevated serum thyroxine in toxic multinodular goitre, p. 753). In these circumstances, the greater the difference between the test result and the limits of the reference range, the higher the chance that the person has a disease, but there is a risk that results within the reference range may be ‘false negatives’ and results outside the reference range may be ‘false positives’. For some tests, the clinical decision does not depend on whether or not the patient is a member of the normal population. This commonly applies to quantitative risk factors for future disease. For example, higher plasma total cholesterol levels are associated with a higher risk of future myocardial infarction (p. 583) within the normal population. Although a reference range for cholesterol can be calculated, cholesterol-lowering therapy is commonly recommended for people with values within the reference range; the ‘cutoff’ value at which therapy is recommended depends upon the presence of other risk factors for cardiovascular disease. The reference range for plasma cholesterol is therefore redundant and the phrase ‘normal plasma cholesterol level’ is unhelpful. Similar arguments apply for interpretation of values of blood pressure (p. 583), bone mineral density (p. 1065) and so on. Some quantitative test results are not normally distributed, usually because a substantial proportion of the normal population will have an unrecordably low result (e.g. serum prostate-specific antigen, p. 518), and the distribution cannot be described by mean and SDs. Alternative statistical procedures can be used to calculate 95th centiles, but it is common in these circumstances to use information from normal and abnormal people to identify ‘cutoff’ values which are associated with a certain risk of disease, as described below. No test is completely reliable. All diagnostic tests can produce false positives (an abnormal result in the absence of disease) and false negatives (a normal result in a patient with disease). The diagnostic accuracy of a test can be expressed in terms of its sensitivity and its specificity (Box 1.5). In choosing how a test is used to guide decision-making, there is an inevitable trade-off between emphasising sensitivity versus specificity. For example, defining an exercise electrocardiogram (p. 534) as abnormal if there is at least 0.5 mm ST depression will ensure that very few cases of coronary artery disease are missed but will generate many false-positive tests (high sensitivity, low specificity). On the other hand, a cutoff point of at least 2.0 mm ST depression will detect most cases of important coronary disease with far fewer false-positives. This trade-off can be illustrated by the receiver operating characteristic curve of the test (Fig. 1.3). The predictive value of a test is determined by its sensitivity and specificity, and can be expressed in several ways. The positive predictive value is the probability that a patient with a positive test has the index condition, while the negative predictive value is the probability that a patient with a negative test does not have the condition (see Box 1.5). The likelihood ratio expresses the odds that a given finding would occur in a patient with, as opposed to a patient without, the index condition (see Box 1.5); as the odds rise above 1, the probability that disease is present rises. The interpretation and the utility of a test are critically dependent on the circumstances in which it is used. Bayes’ theorem dictates that the value of a diagnostic test is determined by the prevalence of the condition in the test population. The probability that a subject has a particular condition (the post-test probability) can be calculated if the pre-test probability and the sensitivity and specificity of the test are known (Box 1.6). A test is most valuable when there is an intermediate pre-test probability of disease. Clinicians seldom have access to such precise information but must appreciate the importance of integrating clinical and laboratory data.
Good medical practice
Medical practice
The doctor–patient relationship
Difficulties in the doctor–patient relationship
Communication and other clinical skills
Using investigations
The ‘normal’ (or reference) range
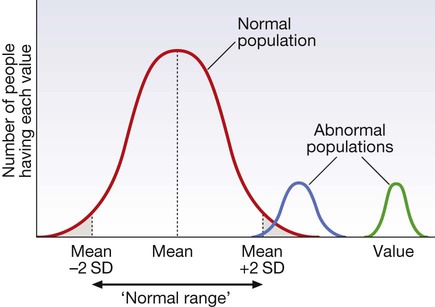
For many tests, the frequency distribution of results in the normal healthy population (red line) is a symmetrical bell-shaped curve. The mean ± 2 standard deviations (SD) encompasses 95% of the normal population and usually defines the ‘normal range’ (or ‘reference range’); 2.5% of the normal population have values above, and 2.5% below, the reference range (shaded areas). For some diseases (blue line), test results overlap with the normal population or even with the reference range. For other diseases (green line), tests may be more reliable because there is no overlap between the normal and abnormal population.
Sensitivity and specificity
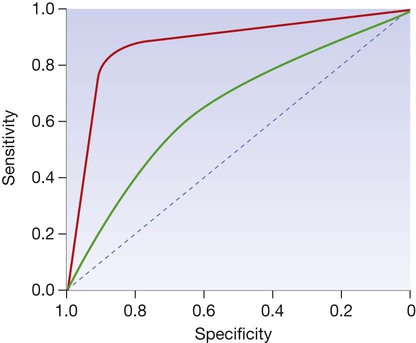
The curve is generated by ‘adjusting’ the cutoff values defining normal and abnormal results, calculating the effect on sensitivity and specificity and then plotting these against each other. The closer the curve lies to the top left-hand corner, the more useful the test. The red line illustrates a test with useful discriminant value and the green line illustrates a less useful, poorly discriminant test.
Predictive value

