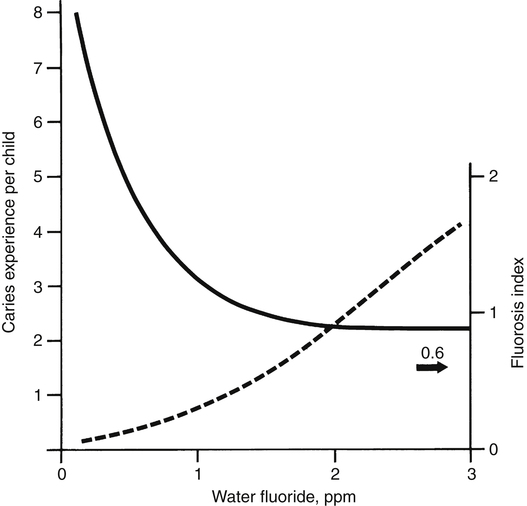
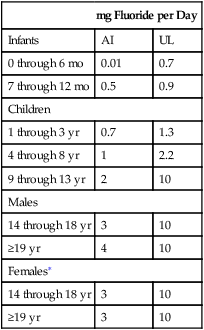
Fluoride (F−), the ionic form of the element fluorine, is the thirteenth most abundant element in the crust of the earth and has been found in all naturally occurring animate and inanimate materials. Because of its high affinity for divalent and trivalent cations, fluoride exists in the earth mainly in combination with calcium, magnesium, aluminum, and other metals. Similarly, the bulk of fluoride in the human body (about 99%) is associated with the skeleton and teeth. Results from early studies with rodents suggested adverse effects on growth, reproduction, and hematopoiesis when the diet contained only traces of fluoride. Based on such findings, fluoride was classified as an essential element by the National Research Council in 1974. Subsequent studies were unable to confirm these effects. Although no longer considered essential, fluoride is regarded as beneficial, owing to its ability to prevent dental decay. Dental fluorosis is a developmental disorder of the enamel that occurs only preeruptively (Fejerskov et al., 1977). After enamel mineralization is complete, no amount of fluoride intake (or of topically applied fluoride) can cause dental fluorosis; it is classified as mild, moderate, or severe, with the degree of involvement depending on fluoride intake during tooth development. In the milder forms, the enamel has whitish, horizontal striations that may be localized to certain regions of the teeth, frequently the incisal thirds (biting edges) of the anterior teeth and cusps of the posterior teeth (“snow-capping”). Mild fluorosis is not easily noticed by the casual observer and requires some experience to recognize. The moderate and severe forms are characterized by graded degrees of brownish discoloration, sometimes with pitting of the enamel. Histologically, the enamel is more porous (i.e., less dense than normal enamel). The discoloration, which is due to diffusion of sulfur, iron, and other dietary pigments into the porous enamel, occurs slowly after the teeth have erupted. Chemically, the enamel has an abnormally high protein content, which accounts for the porosity. Dental fluorosis is generally regarded as an aesthetic problem, not an adverse health effect. The enamel of the incisors, which are the teeth most noticeable, appears to be most susceptible during the second and third years of life—the period when the teeth are in the late secretory and early maturation stages of development (Evans and Darvell, 1995). The investigators who documented the relationship between fluoride concentrations in drinking water and dental fluorosis in the 1930s unexpectedly recorded a striking effect on dental caries (Figure 40-1). It was concluded that the consumption of water containing 1.0 ppm fluoride was associated with the near-maximum protection against dental caries in a community and an acceptably low prevalence of the milder forms of dental fluorosis. That is how 1.0 ppm was established as the “optimum” concentration in drinking water. The optimum range is from 0.7 to 1.2 ppm, depending on the average regional temperature. The lower concentrations are recommended for warmer climates, where water intake tends to be higher. The difference in the prevalence of dental decay between American communities with and without water fluoridation is lower today than it was before 1970. A national survey conducted in 1979 to 1980 found a 33% lower prevalence among 5- to 17-year-old children who had always been exposed to fluoridated water compared with those who had never been exposed; a 1986–1987 survey found a 25% lower prevalence (Brunelle and Carlos, 1990). The widespread use of topical fluoride products and the “halo” effect, which is discussed in subsequent text, appear to largely account for the smaller difference. Three national epidemiological surveys conducted in 1971 to 1973 (National Center for Health Statistics), 1979 to 1980, and 1986 to 1987 (National Institute of Dental Research) revealed a progressive decline in tooth decay. Compared with the 1971 to 1973 data, there were 53% fewer affected tooth surfaces in the 1986–1987 survey. In 1979 through 1980, 36.6% of the 5- to 17-year-old children surveyed had no dental decay; in 1986 to 1987 the percentage had increased to 49.9%. Data summarized by the National Center on Health Statistics (Dye et al., 2007) show that the prevalence of caries has declined further from 1988 to 2004. It is generally agreed that the combination of water fluoridation and increased uses of topical fluoride products and pit and fissure sealants have been responsible for these findings. • Increased resistance of enamel to acid attack • Promotion of remineralization of incipient enamel lesions, which are initiated at the ultrastructural level several times daily according to the frequency of eating or drinking foods containing carbohydrates (Ten Cate, 1990) • Increasing the availability of minerals in plaque, which, especially under acidic conditions, provides mineral ions (ionized calcium, phosphate, and fluoride) that retard demineralization and promote remineralization (Tatevossian, 1990) • A reduction in the amount of acid produced through inhibition of bacterial enzymes (especially enolase) and glucose uptake (Hamilton, 1990) These various mechanisms require frequent exposure to fluoride throughout life to maintain adequate concentrations of the ion in the dental plaque and enamel. The plaque and enamel receive fluoride from the blood via the saliva (saliva is a continuous source of fluoride except during sleep) and from water, food, and dental products (Whitford, 1996). In developing the Dietary Reference Intakes (DRIs), the Institute of Medicine (IOM, 2006) set Adequate Intakes (AIs) for fluoride across the life cycle. The AI is based on estimated intakes that have been shown to significantly reduce the occurrence of dental caries in a population without causing unwanted side effects, including moderate dental fluorosis. Except for infants through the age of 6 months, for whom intake from breast milk is regarded as adequate, the AI values are based on an average daily intake of 0.05 mg/kg body weight. The IOM (2006) also established a Tolerable Upper Intake Level (UL) of 0.10 mg/kg/day (equating to 0.7 to 2.2 mg/day) for infants and children through 8 years of age to minimize the risk of moderate dental fluorosis. The UL was set at 10 mg/day for children older than 9 years and adults. That intake value was based on studies of fluoride exposure from dietary sources or work environments (Hodge and Smith, 1977) that indicated 10 mg/day for 10 or more years carries only a small risk for an individual to develop preclinical or stage 1 skeletal fluorosis. 0.05 to 6 ppm; the great majority are considerably less than 1.0 ppm. The higher concentrations are mainly found in the southwestern United States. The concentrations in foods may increase or decrease depending on the fluoride concentration of the water used for cooking. Tea and marine fish (without bones) have higher concentrations that typically range from 1 to 6 ppm (1 to 6 mg/L or mg/kg). The range for average dietary fluoride intakes as reported in seven studies conducted from 1958 to 1985 was 1.2 to 2.4 mg/day (Burt, 1992). Human milk, like cow and goat milk, has a low fluoride concentration (about 0.01 ppm). Therefore a liter of milk provides not more than 0.01 mg of fluoride, an intake level that has been shown to result in a negative fluoride balance (total excretion > total intake) in infants, which indicates a net loss from calcifying tissues of fluoride that was acquired in utero (Ekstrand et al., 1984). Before 1980 many American manufacturers of ready-to-feed infant formulas prepared their products using fluoridated water, which resulted in concentrations ranging from 0.6 to 1.2 ppm and intakes in excess of 0.10 mg/kg by some infants. However, a number of reports in the 1980s began to show an increase in the prevalence of dental fluorosis and raised concern about this practice. At a meeting sponsored by the American Dental Association, investigators discussed the possible relationship between fluoride intake from infant formulas and an increased risk of dental fluorosis with the manufacturers, who then agreed to prepare their products with low-fluoride water (Pendrys and Stamm, 1990). Today ready-to-feed formulas manufactured in the United States have fluoride concentrations that range from 0.09 to 0.20 ppm (McKnight-Hanes et al., 1988; Siew et al., 2009). These provide 0.20 mg or less of fluoride with each liter consumed. The fluoride concentrations of liquid concentrates and powdered formulas prepared in the home span a wide range (0.1 to 1.2 ppm), depending mainly on the water used in the home to reconstitute these products. Of particular interest is fluoride intake by young children at risk of dental fluorosis. When drinking water containing 1.0 ppm fluoride is the major source of the ion, the average daily intake by young children is approximately 0.05 mg/kg. Table 40-1 shows the results of five studies of dietary fluoride intake by children up to 2 years of age (Burt, 1992). Data were obtained for diets prepared with or without fluoridated water. In 1979, daily fluoride intake by 2- to 6-month-old infants living in areas with fluoridated water ranged from 0.09 to 0.13 mg/kg. These levels of intake were well above the optimum range and due partly to high-fluoride formulas. The more recent studies found lower daily intakes that were remarkably similar and close to 0.05 mg/kg. Table 40-1 also shows lower intakes in areas with low water fluoride concentrations. Average daily dietary fluoride intakes by older children and adults are somewhat less than 0.05 mg/kg because intake does not keep up with body weight. TABLE 40-1
Fluoride
Dental Fluorosis and Dental Caries
Characteristics of Dental Fluorosis
Water Fluoridation and Dental Caries

Topical Fluoride Products
How Fluoride Prevents Dental Caries
Fluoride Intake
Recommended Fluoride Intake
Fluoride Concentrations in Foods
Fluoride Intake by Infants and Young Children
mg Fluoride/Day
mg Fluoride/kg Body Weight/Day
YEAR
AGE
F
No F
F
No F
1979
2 mo
0.63
0.05
0.13
0.01
4 mo
0.68
0.10
0.10
0.02
6 mo
0.76
0.15
0.09
0.02
1980
6 mo
0.21
0.35
0.03
0.04
2 yr
0.61
0.32
0.05
0.03
1985
6 mo
0.42
0.23
0.05
0.03
2 yr
0.62
0.21
0.05
0.02
1988
6 mo
0.4
0.2
0.05
0.03 ![]()
Stay updated, free articles. Join our Telegram channel

Full access? Get Clinical Tree


Fluoride

