Flow Cytometry
Myron R. Melamed
HISTORICAL OVERVIEW
Cytometry is the science of cell classification and analysis based on cell measurements. It represents an effort not only to quantify by objective measures the diagnostic cell features that are interpreted subjectively by the human microscopist, but also to quantify constituents and functional attributes of the cell that may not be apparent by light microscopy and, nevertheless, play an important role in defining the cell or its functional state. By flow cytometry, we mean the technique of measuring cells in suspension as they flow in single file through a measuring sensor. It has a number of advantages, among them the ability to measure large numbers of cells individually in a few seconds, to make and record several different measurements simultaneously on each cell, and to control staining conditions precisely and equally for all cells.
The beginnings of cytometry are properly attributed to Torbjørn Caspersson (1940, 1950), who first demonstrated that nucleic acid content and protein in the unstained cell could be quantified by measuring absorption of light in the ultraviolet and visible spectrum, respectively. Both measurements varied depending on cell function and were increased in cancer cells.*
In a later microspectrophotometric study, Leuchtenberger et al (1954) confirmed the increased DNA content of cells from malignant, compared with benign, human tissues. At the same time, Mellors, with Keane and Papanicolaou (1952), demonstrated that dysplastic and cancer cells in cervical cytology slides had increased nucleic acid content, and suggested that this might be the basis for automated examinations of the cytology slide (Table 47-1).
Friedman (1950) and Mellors and Silver (1951) introduced fluorescent nucleic acid dyes to gynecologic cytology. Ruch (1966) later provided the physical basis for the more precise DNA measurements obtained by fluorescent Feulgen
and other fluorescent DNA stains compared to what was possible with absorbing dyes.
and other fluorescent DNA stains compared to what was possible with absorbing dyes.
TABLE 47-1 ABSORPTION MEASUREMENTS OF UTERINE CERVICAL SQUAMOUS CELLS | ||||||||||||||
|---|---|---|---|---|---|---|---|---|---|---|---|---|---|---|
| ||||||||||||||
The concept of counting and later measuring cells in suspension as they flowed though a measuring station reached first practical application with the Coulter Counter in the mid-1950s. This instrument recorded a change in electrical potential as each of the individual cells in salt solution passed between electrodes in an electrical field (Fig. 47-1) (Kachel, 1990). Until the invention of multiparameter flow cytometry by Kamentsky et al in 1965, however, there was no way to make photometric measurements of cells in flow as had been made on glass slides. Kamentsky et al (1963) had confirmed Mellors’ work by scanning benign, dysplastic and malignant uterine cervical squamous cells on slides and demonstrating increased absorption of neoplastic cells at dual wavelength measurements optimum for nucleic acids and for proteins (Fig. 47-2). While this suggested a possible means of screening for precancerous lesions of the uterine cervix, the process of scanning cells on slides was then much too slow for practical clinical application. High-intensity laser light sources and modern era computers were not available at that time. In addition, there were enormous technical difficulties with background noise, maintaining focus, discriminating and analyzing individual cells, and separating reactive from neoplastic cells. On the other hand, the flow cytometer could carry out simultaneous measurements of two or more features on each of several thousand cells in a few seconds. It had other advantages, as well, that included separation and ready discrimination of single cells, greater uniformity of staining for the cells in suspension, and better precision of measurements including measurements of DNA.
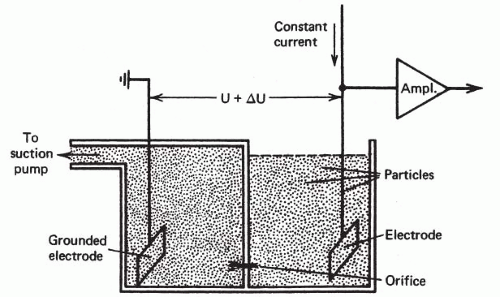 Figure 47-1 Diagrammatic representation of Coulter counter flow chamber. Cells in suspension are made to flow from one chamber into the other through a small orifice. The electrical signal generated by each cell is recorded as it traverses the orifice, providing a cell count and also an indicator of cell size. (From Kachel V. In Melamed MR, Mullaney PF, Mendelsohn ML (eds). Flow Cytometry and Sorting. New York, Wiley, 1979.) |
There was strong motivation at that time to develop an automated instrument for cervical cytology screening and grants for that purpose from government and industry funded much of the early research and development (see Melamed, 2001, for a historical review). A clinical trial to screen cervical cytology specimens with a prototype flow cytometer built by Kamentsky was reported by Koenig et al (1968) who examined specimens from 1,155 high-risk patients. Only 45% of cervical cytology samples were adequately cellular; of these, the instrument selected a very large proportion, namely 35%, as abnormal. Although the selected samples included 85% of the proven positive cases, the results were not good enough for a clinical instrument. There were no futher trials of flow cytometry for cervical cancer detection in the United States.
In Kamentsky’s flow cytometer, cell flow was perpendicular (i.e., orthogonal) to the direction of the excitation beam of light (Fig. 47-3). In an instrument developed independently at almost the same time by Dittrich and Göhde (1969) in Germany, cell flow was parallel (i.e., colinear) with the excitation beam (Fig. 47-4). Very precise measurements could be obtained as the cells passed through the focal plane of the beam, with coefficients of variation (CVs) below 2%. Göhde and Dittrich (1970) also were the first to make use of energy transfer between the fluroescent dyes ethidium bromide and mithramycin to achieve high intensity fluorescence staining of DNA in cervical cytology samples. They reported successfully detecting the neoplastic cells in clinical cervical cytology samples (Göhde et al, 1972).
Since its invention over 40 years ago, flow cytometry instruments have been extensively modified and improved and many new techniques of specimen preparation and staining have been designed specifically for these measurements (see below and appendix to this chapter). The very sophisticated, computer-interfaced flow cytometers available today are capable of six or more simultaneous measurements on each of the thousands of cells in a sample, with analysis and graphic presentation of the data within a few minutes. Many biochemical, physiologic, and molecular cell features now may be quantified by flow cytometry (Table 47-2). There are two important clinical applications: (1) measuring DNA content of tumor cells to distinguish diploid from aneuploid tumors and display tumor cell cycle distribution (i.e., proliferative activity), and (2) diagnosis and classification of leukemias and lymphomas by expression of cellular antigens. Thus, although the original objective of automatically screening cervical cytology specimens was never achieved, flow cytometry has become an essential research and clinical laboratory instrument with many other applications.
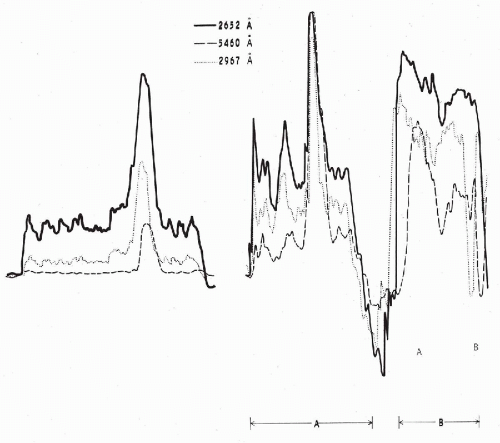 Figure 47-2 Absorption patterns of three cells from a cervical smear at different wavelengths. Scanning at 2,652 Å corresponds to absorption by nucleic acids, scanning at 2,976 Å corresponds to absorption by certain other proteins, scanning at 5,460 Å corresponds to visible light. The cell on the left is a normal squamous cell, whereas the cells designated as A and B represent varying degrees of abnormality. Cell A is dyskaryotic, closely resembling the benign cell on the left, except for an enlarged and hyperchromatic nucleus. Yet its absorption pattern in ultraviolet light (2,652 Å) reveals a marked increase in the cellular content of nucleic acids. In cell B, which is a frank squamous cancer cell, there is a further increase of the cellular nucleic acids to the point of partial obliteration of the nuclear peak. (Modified from Kamentsky LA, et al. Ultraviolet absorption of epidermoid cancer cells. Science 142:1580-1583, 1963.) |
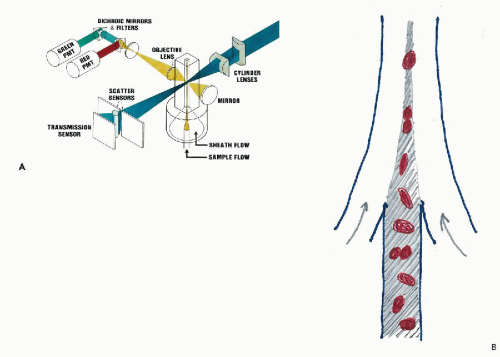 Figure 47-3 A. Schematic representation of an orthogonal flow cytometer. The cells in suspension are injected in single file into a fluid stream that aligns them in the center of a quartz glass channel. The channel measures 100 μm in diameter, large enough to avoid clogging. As each cell passes through the focused beam of laser light, it excites a fluorescence flash that is collected, quantified by a photomultiplier, and recorded by computer for graphic display and analysis in “list” mode. The more sophisticated research instruments have two additional laser excitation beams increasing the number of measurements made on each cell. Light scatter signals give information on cell size and texture. B. Diagram showing laminar flow injection of cells into a fast moving stream of sheath fluid that orients asymmetrically-shaped cells and centers them in the flow channel. The flow may be up or down. |
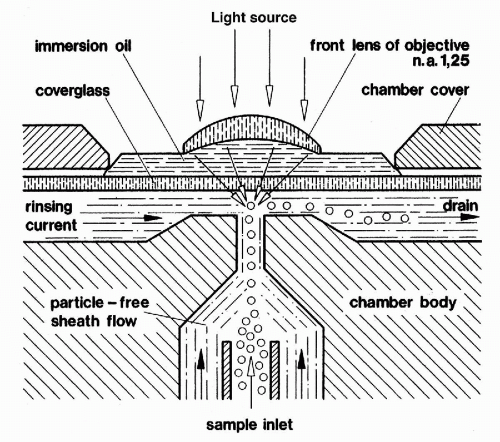 Figure 47-4 Diagram of Göhde’s colinear flow cytometer.
Get Clinical Tree app for offline access
Stay updated, free articles. Join our Telegram channel
Full access? Get Clinical Tree


|