versus the alternative hypothesis (HA) that the parameters aren’t equal:

But, the null hypothesis doesn’t always have to postulate no difference between or among the groups. Null, in this case, doesn’t mean “nothing,” but rather the hypothesis to be nullified. Cohen (1994) referred to Equation 27–1 as the nil hypothesis. In the vast majority of studies, the null hypothesis is the nil hypothesis, but it needn’t be, and this is the first half of the rationale for equivalence testing.
The second half of the rationale is that there are differences between groups, and then there are differences between groups. In other words, some differences, even if they are statistically significant, are trivial from a practical perspective. Because of sampling error, we’re always going to find some difference between groups, even if both groups are treated identically. Furthermore, given a sufficiently large sample size, we can show that even a tiny difference is statistically significant. For example, let’s assume the systolic blood pressure in a control group is 163, and that it’s 160 in the treatment group. If the SD is 15 mm Hg, and there were 400 patients in each group, then this difference would be statistically significant. However, there would be precious few clinicians who would change their practice for just 3 points.4
TESTING FOR NO DIFFERENCE
Now let’s return to the plight of the scientists at WCMM2,5 Ltd., who have to show the federal regulatory agencies that their drug, WonderScent, is not different from the already-approved pill, LoveMe!6 The issue they face is how to show this. They have two choices: an equivalence trial, and a non-inferiority trial. As we’ll see, both are predicated on the two points we just discussed: the difference between the null and nil hypotheses, and the proposition that not all differences are worth writing home about.
Equivalence Interval
In both types of trials, the first step is to establish an equivalence interval. This is simply a quantification of the second point: how close is “close enough?” We’ve already encountered this concept in sample size calculations, where it’s necessary to stipulate ahead of time what the smallest difference is between the groups for us to pay attention to the results. The process, you’ll remember, is not statistical, but judgmental: “Will I change what I do clinically if the groups differ by 1 point? If not, how about 2 points? Would you believe 3 points?” We do this until we reach a point where the difference starts to look promising, and we’re interested in results at or above this value. In setting the equivalence interval, we go through the same process, but with a slightly different question: “Do I really care if the groups differ by 1 point? If not, how about 2 points? Would you believe 3 points?” Once we reach a level where we would care about the difference, we say that we’re not interested in results below that value. So, for example, if people who take LoveMe! are rated on average as 75 on the 100-point Social Excitement/Charm Scale (SECS),7 does it make a difference that those on WonderScent score only 74? 73? 72? If we perk up (so to speak) when the difference is five points, then we say that the equivalence interval (which we designate by I) is four points; that is, any difference in effectiveness of four points or less would be considered to be clinically or practically inconsequential.
Unfortunately, clinical judgment isn’t the only factor that affects the width of I. From a clinical perspective, we want I to be as narrow as possible, because the smaller it is, the more similar the treatments are to one another. But, there’s a trade-off. The smaller its width, the harder it is to demonstrate equivalence and the larger the sample size that’s required (Kendall et al. 1999). Thus, there is great incentive, especially if a company is paying for the study, to increase the size of I; we’ll return to this point when we discuss some of the problems with these types of trials.
Equivalence Trials
In an equivalence trial, we say that the new drug is equivalent to the standard if it falls within the range of 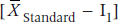 to
to 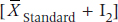 where I1 is the lower equivalence interval and I2 the upper one. That is, there is an equivalence interval above and below the mean of the standard therapy, as shown in Figure 27–1. In this case, there are two null hypotheses:


and the alternative hypothesis is:

The logic is that if we can reject both null hypotheses using t-tests, then by default we’re left with the alternative hypothesis that the mean of the new drug falls within the equivalence interval. The figure shows a symmetrical equivalence interval around the standard, but it doesn’t have to be; we can set the interval to be five points below the mean and 10 points above it.
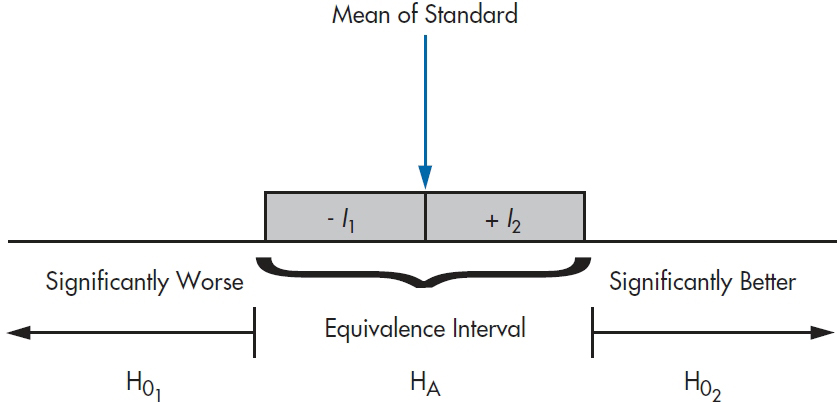
FIGURE 27-1 The equivalence intervals and hypotheses for equivalence testing.
Although much has been written about equivalence testing (e.g., Blackwelder, 1982; Hatch, 1996; Rogers et al. 1993), it’s rarely done in real life. The reason for this is simple; in the vast majority of cases, the second null hypothesis (Equation 27–4) is of absolutely no interest to us. Nobody wants to prove that their intervention isn’t superior to the standard, especially when the sample size needed to do so can grow alarmingly if I is small (Streiner, 2003). All that’s necessary to keep regulatory agencies happy is to show that the new drug isn’t much worse than the existing one, so why go to all that bother and expense?
The one area where equivalence testing is widely used is to test for bioequivalence, where the outcome could be the blood level of some compound; we don’t want the new drug to produce too little of it, but neither do we want too much. So to keep those folks happy, let’s go through the exercise (although briefly). To keep our lives easier, we’re going to use a symmetrical equivalence interval, so that −I1= I2.
Because we have two null hypotheses, we have to conduct two t-tests:
and
where SEDifference is defined the usual way:
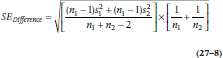
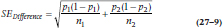
and the two subscripts refer to the two groups. If instead of means we were dealing with proportions of people in each group, we simply substitute pNew and pStandard for the  in Equations 27–6 and 27–7, and use the formula for the SE of the difference in proportions:
Note that, even with the same value for I, Equations 27–6 and 27–7 will have different numerators, because one has –I and the other has −(−I).
There is one important difference between Equations 27–6 and 27–7 and the equation for the traditional t-test. In the latter, it doesn’t matter if we subtract the mean of Group 1 from the mean of Group 2, or vice versa, because we’re interested only in the absolute value of the difference. But, as we’ll see later on, it does make a difference in equivalence and non-inferiority testing.
In fact, though, if we calculate the t-test with the smaller numerator, we don’t have to run the other one at all. The rationale is that for HA to be true, we have to reject both tests of HO. So if the test with the smaller numerator is not significant, it’s irrelevant if the other one is or isn’t; we haven’t rejected both null hypotheses. On the other hand, if it is significant, then the one with the larger numerator must be even more significant. One last point: don’t be deluded into thinking that, just because you’re running only one t-test and it’s one-tailed, you can get away with putting the entire 0.05 rejection area into that tail and use a smaller critical value for t. We keep α at 0.025, because the other test is still there, even though we don’t explicitly calculate it.
To be true to our promise and keep this section (blessedly) short, we’ll hold off on a worked example until the next section.8
Non-Inferiority
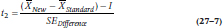
Getting back to our example, to get WonderScent on the market and pulling in the dough, WCMM2 simply has to show that it isn’t too much worse than LoveMe!, where “not too much worse” is again the equivalence interval. Now, though, we’re dealing with only one interval, and a one-tailed test. The null hypothesis is:

and the alternative is:

which is shown in Figure 27–2. Again, the logic is that if we can reject HO, then we’re left with HA, which says that the mean of the new treatment falls at least within the equivalence interval, and may even be better.9
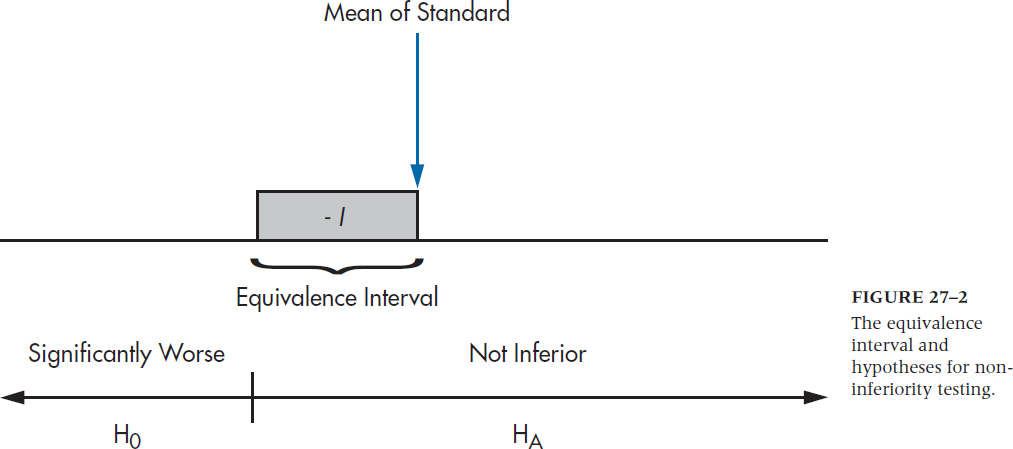
FIGURE 27-2 The equivalence interval and hypotheses for noninferiority testing.
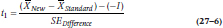
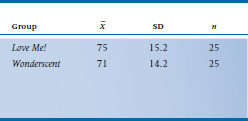
So, let’s say that WonderScent will be considered to be equivalent if it performs (again, in a manner of speaking) no worse than 5 points poorer than LoveMe! on the SECS; that is, we set I equal to –5. We take 50 (very willing) volunteers10 and randomly divide them into two groups. Half are given LoveMe! and half WonderScent, and then we get 50 equally willing volunteers of the opposite sex to rate each person.11 What we find is shown in Table 27–1 Now let’s run those numbers through Equation 27–6. (We’re using 27–6 rather than 27–7 because the equivalence interval is below the mean. If larger numbers reflect a worse state, as in measuring blood pressure or LDL cholesterol level, we’d use Equation 27–7.)
Trust us when we say that SEDifference is 4.174.12 So, plugging those numbers into the equation we get:
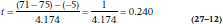
which, with n1– n2 − 2 = 48 df, is not the least bit significant. Now let’s wrap our collective heads around the logic. We’ve failed to reject HO that WonderScent is worse than LoveMe!, so we have to conclude that they’re not equivalent.
Wait a minute! Didn’t we say that we’d be content if the two preparations were within five points of one another, and didn’t we find that they’re only four points apart? So why didn’t we conclude that they’re equivalent? This raises the issues of what we mean by Type I and Type II errors in non-inferiority trials, and what effect this has on power.
TABLE 27–1 Results of a study comparing Love Me! to Wonderscent on the SECS
Type I and Type II Errors
Because we’ve flipped the meaning of the null and alternate hypotheses, we also have to change our thinking about the meaning of Type I and Type II errors. Type I, as you well know, is the probability of rejecting HO when in fact it’s true. Now, in traditional significance testing, HO is the null hypothesis—that there’s no difference—and HA is the alternative, that there is one. In non-inferiority testing, though, HO states that there is a significant difference (i.e., the new stuff is worse than the old), and HA now states that there is no difference. So, a Type I error in this case means saying there is no significant difference (i.e., there is equivalence) when in fact the two treatments do differ. Similarly, a Type II error means that we say there is a difference when there really isn’t one (which is probably what happened here). This means that power is the probability of accepting that the groups are equivalent when they actually are the same (Hatch, 1996).
That reasoning was a bit convoluted, so let’s go over the logic of it all again. Our null hypothesis was that there is a difference between the two substances. Because our power was low, we failed to reject H0, so we’re left with the alternative hypothesis that there is a difference, and so we can’t claim equivalence. Whew!
Another difference between traditional and non-inferiority testing is (or isn’t) the z-value for the α level. One would think that, since we’re doing a one-tailed test (that is, we’re not testing if the difference is in favor of the new treatment), we could set z at 1.64 as both the critical value for significance and in the formula for the sample size (discussed below). This would have the effect of lowering the bar for significance, and reducing the sample size. But, some people and groups have advocated using the 2.5% level rather than the 5% level for equivalence and non-inferiority trials (e.g., Julious, 2004; Piaggio et al. 2006), so we’d be back where we started from with a z-value of 1.96. This recommendation is a bit more conservative, so it probably makes sense to follow it.
Sample Size and the Effects of I
The formula for the sample size of a non-inferiority trial is very similar to the one for a regular t-test, but again with the added factor of I thrown in:
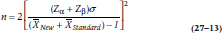
where n is the sample size required for each group.
Let’s take a closer look at the effect of I on the results of the t-test (Equation 27–7) and the sample size (Equation 27–13). When I is 0, both equations are the same as for the regular t-test; the value of t isn’t affected, and the sample size remains the same. If the actual difference between the groups (Δ) shows that the new drug is actually better than the comparison one, then the numerator of Equation 27–7 increases because we’re adding two positive numbers. The same thing happens to the denominator of Equation 27–13, meaning that the required sample size goes down. But if the new drug is actually worse, then Δ is negative, and, because I has a negative value, then –I is positive.13 This increases the sample size very dramatically, which is why the results of our study most likely suffer from a Type II error. The unfortunate fact is that most equivalence and non-inferiority trials are underpowered (D’Agostino et al. 2003; Wiens, 2002).
Unfortunately, it also opens the door for a lot of mischief14 on the part of nefarious commercial manufacturers. One way around the sample size problem is to make I very large. If we had chosen an equivalence interval of 10 points rather than 5, then t would have been 1.437, and the one-tailed test would be significant. So, it’s easier to reject the null hypothesis and to conclude that the treatments are equivalent if we use a more liberal definition of “not worse.”
There’s also another potential problem, and that is that the standard may slip over time. Let’s say we had actually used a sufficient sample size, and concluded that WonderScent was equivalent to LoveMe!, even though it’s actually a bit worse. If WonderScent now becomes the gold standard against which we test an even newer preparation, the mean we’re shooting for is 71 rather than 75. The newest agent could be non-significantly worse than this, and so our reference point drops yet again. Although we don’t know of any examples of this, it’s something to keep in mind.
More Room for Mischief
When our goal is to demonstrate that A is better than B, where B can be treatment as usual or a placebo condition, we go out of our way to design the best study we can. We do everything possible to ensure that A works, such as monitoring compliance, calling patients to remind them to take their pills, training the therapists, using manuals to guide treatment, and so on. Now, difficult as it is for you, put yourself in the mind of an unscrupulous person who is trying to demonstrate equivalence or non-inferiority. What would you do? You’d run the sloppiest study ever imagined—you’d recruit patients who are unlikely to respond, not worry about compliance by either the patients or clinicians, allow drop-outs to occur, use an unreliable outcome measure; in short, do everything possible to dilute the effects of the intervention(s). We would never dream of accusing anyone of doing this deliberately,15 but you get the point. Equivalence and non-inferiority can simply be the result of a badly executed study, rather than a true lack of difference between the groups (Kim and Goldberg, 2001; Streiner, 2006).
Another strategy is to blindly adhere to the received wisdom of analyzing all subjects who have been randomized, irrespective of whether or not they actually finished or even started the trial—what is called an intention to treat (ITT) analysis. This is what’s usually done in superiority trials, because the bias is usually against finding a difference; that is, it’s a conservative bias. However, because we’ve switched the meaning of the null and alternative hypotheses in equivalence and non-inferiority trials, the bias from ITT analyses in tilting the results toward finding no difference often (but not always) works in favor of rejecting the null, which is, in statistical parlance, a no-no (Piaggio et al., 2006). So, we’re left with the position that ITT is either bad or its effects unpredictable in these types of trials.
A final bit of mischief is to try to rescue a failed superiority study by concluding that it demonstrates equivalence or non-inferiority. Unfortunately, this bit of flummery is relatively common. Greene et al. (2000) reviewed 88 studies done over a 5-year time span that claimed equivalence, and found that this conclusion was inappropriate for 67% of the articles. In order to show equivalence or non-inferiority, you have to begin by trying to demonstrate it from scratch; the lack of superiority doesn’t equal equivalence.
So what’s the bottom line? It’s possible to conduct trials “proving” the null hypothesis, but it ain’t as easy as it looks.
1 At least not while sober.
2 No, we’re not saying that this particular fish was alive back then; only that its great, great uncle on its mother’s side was.
3 Actually, in the case of me-too drugs, to show that the more expensive alternative is no different from the cheaper standard. You figure out the logic of that.
4 Maybe for a free dinner at an upscale restaurant paid for by the drug company, but not for 3 points.
5 That stands for “We Can Make Money, Too.”
6 Notice that we’re following the trendy marketing strategies of eliminating spaces between words, capitalizing in the middle, and using exclamation points with great abandon.
7 It’s all right; you can go ahead and pronounce the acronym.
8 That’s also a ploy to keep you reading the book.
9 Although when have you ever heard of a me-too drug being better? Perhaps fewer side effects; definitely more expensive; but better?
10 Who knows; they may even be willing to pay us to be in the study.
11 What’s the olfactory equivalent of a double-blind study? We don’t know, either.
12 If you don’t trust us after all this time, run it yourself. See; we told you it was 4.174
13 This is using the example where more is better. If larger numbers indicate a worsening in the condition (e.g., blood pressure), then just reverse everything. We could actually work out an example to show you that the conclusions are the same, but our fingers are getting tired.
14 That’s a polite term for pulling the wool over regulators’ eyes.
15 This phrase was added at the express instructions of our lawyer. Talk to her if you don’t believe us.
Stay updated, free articles. Join our Telegram channel

Full access? Get Clinical Tree


