Courtesy of Awadh Mohammed Ba Saleh, Yemen.
“We can’t predict what a virus we’ve never seen will do.”
—Marc Lipsitch, Professor of Epidemiology, Harvard
Why does an infectious disease occur in one population rather than another? Why are certain age groups more at risk for a particular viral disease? Why aren’t viral diseases randomly distributed within a specific geographic area? These are questions asked by epidemiologists. This chapter discusses the disease triangle model of causation in detail and introduces the scientific field of epidemiology, which is associated with virology.
6.1 What Is Epidemiology?
What is the definition of epidemiology? If we break the word apart into its Greek roots, the prefix epi- means “on or upon, befall” and demos means “people, population.” If the term is literally defined by this etymology, epidemiology means, “the study of that which befalls man.”
Specifically, epidemiology is the study of how diseases affect whole communities. The objectives are to determine the distribution, cause, control, and prevention of diseases in populations. In this era of terrorism, epidemiology has become more important than ever. The detection of covert and terrorist biological attacks will most likely occur at a local level, where disease-tracking systems and experts need to be in place. Epidemiologists must be able to respond to reports of rare, unusual, or unexplained illnesses so that critical decisions can be made rapidly. FIGURE 6-1 is a map created by data collected by epidemiologists that demonstrates the spread of severe acute respiratory syndrome coronavirus (SARS-CoV) from November 1, 2002, to April 22, 2003, through increased global travel by commercial airlines.

FIGURE 6-1 Epidemiology is the branch of science that deals with disease diagnostics, trends, and control measures. Epidemiologists map epidemics and pandemics and would be on the front lines of a terrorist-caused biological attack. Epidemiologists on the CDC’s Public Health Mapping Team created this SARS pandemic map.
Epidemiology Definitions
Describing Disease Events
The field of epidemiology has its own language and terminology, making it important to define some of these terms before applications of epidemiology can be discussed. Several terms are used to describe disease frequency. For example, the term endemic applies to diseases that persist at a moderate and steady level within a given geographic area. The prefix en- means “in or within.” For example, many individuals in the United States suffer from cold sores present on the lips caused by herpes simplex virus 1 (HSV-1), and malaria is common in certain tropical areas of Asia and Africa. These are considered endemic infectious diseases (FIGURE 6-2). In contrast, sporadic disease outbreaks have no pattern of occurrence in time or location, such as the sporadic Ebola virus disease (EVD) outbreaks in Central and West Africa. (Appendix C is a bonus Ebola case study.)
An epidemic is used to describe an unusually high number of cases in excess of normal occurrence of a similar illness in a population, community, or region (Figure 6-2), such as seasonal influenza epidemics in North America. Related to the term epidemic is the term pandemic, which refers to a worldwide epidemic that crosses international borders. The prefix pan– means “all or across.” Examples are the influenza pandemic of 1918 or the more recent influenza pandemic of influenza A (H1N1) in 2009.
Epidemiology is a quantitative discipline. Two important statistical measures used in epidemiology are morbidity and mortality. Morbidity refers to illness or cases, and Mortality refers to deaths caused by a particular disease. Mortality is calculated by dividing the number of deaths by the total number of cases. It is expressed as a rate such as a proportion (percentage) or reported as per 1,000 or 100,000 population. For example, as of February 28, 2016, the World Health Organization (WHO) reported 28,639 cumulative worldwide cases of EVD, which included 11,316 deaths, during the most recent epidemic, which began in Guinea, West Africa. Thus, the mortality rate of EVD was 39.5% (11,316/28,639 × 100 = 39.5%). This death rate is significantly lower than past outbreaks, which may be due to virulence differences in the Ebola virus strain, improved knowledge and treatment of the disease, or other factors.

FIGURE 6-2 Comparison of endemic versus epidemic diseases.
Other statistical measures used by epidemiologists are incidence and prevalence. incidence is a measurement of morbidity. It refers to the frequency or occur-rence of newly diagnosed cases of a disease in a specified period of time in a susceptible population. The incidence rate may be expressed per 1,000 persons. The incidence per 1,000 is calculated as follows:
[(Number of new cases)/(Number of persons at risk)] × 1,000
For example, in Case Study 1, there were 122 cases of Brainerd diarrhea in a susceptible population of 13,500 Brainerd residents. Thus, the incidence of Brainerd diarrhea was 9 cases per 1,000 during the reported time period.
Prevalence is a measurement of morbidity that refers to the number of cases existing in a population at a specified time. It takes into account new cases and those who contracted the disease in the past and are still surviving. Prevalence rates are reported as prevalence per 1,000.
Controlling infectious diseases is an application of epidemiology in the community. Other common terminology in epidemiology centers upon how pathogens are the cause of a particular infectious disease and how it is acquired. The etiological agent, or pathogen, is the disease-causing agent; for example, human immunodeficiency virus (HIV) is the etiological agent of acquired immune deficiency syndrome (AIDS), and Ebola virus is the etiological agent of EVD.
Progression of Disease or Infection
Establishing a case definition, the standard set of criteria used to identify who has a particular disease, is used by epidemiologists to investigate an outbreak. Case definitions generally include four types of information:
Clinical information such as symptoms or lab results (e.g., fever > 100°F [37.8°C] for influenza; jaundice for hepatitis A; or elevated levels of IgM antibodies against a particular pathogen).
Demographic information (e.g., individuals of a certain age group).
Location of the outbreak (e.g., EVD in West Africa or people working in south Milwaukee, Wisconsin).
A specified time period of disease (e.g., during January and March of 2015 or among people who attended an Irish festival).
The incubation period of an infectious disease is the time between infection with a virus or other pathogen and the onset of symptoms (FIGURE 6-3). Incubation periods vary based on the particular virus; for example, the incubation period for influenza is 1–2 days, for chicken-pox it is 14–16 days, and for EVD in West Africa it is 2–21 days after exposure to Ebola virus (average is 8–10 days; TABLE 6-1). The prodromal period of a disease is when the first mild or nonspecific signs and symptoms of an illness appear (Figure 6-3). It is followed by the period of illness, which is the time period in which the infected individual experiences signs and symptoms of disease. The communicable period is the time period when an infected individual or animal is contagious and can directly or indirectly transmit/infect another person, animal, or arthropod (Table 6-1). The final, or recovery, period of disease after an illness is referred to as convalescence. Although feeling much better, during this stage of infection the individual may still be infectious and able to transmit the disease (Figure 6-3).

FIGURE 6-3 Course of infectious disease.
Table 6-1 Incubation Periods for Communicable Viral Diseases
| Viral Disease | Incubation Period | Period of Communicability |
|---|---|---|
| Influenza | 1–3 days | 3–5 days from clinical onset in adults; up to 7 days in children. |
| Severe acute respiratory syndrome (SARS) | 1–10 days | Not completely understood. Early studies suggest no transmission before symptoms appear; transmission more likely during the second week of illness. Healthcare workers at greatest risk, especially during procedures such as intubation or nebulization. |
| Middle East respiratory syndrome (MERS) | 2–14 days | It is believed that patients are not contagious during the incubation period. Once symptoms begin, MERS is spread to others during close physical contact. |
| Chickenpox | 2–3 weeks (commonly 14–16 days) | As long as 5 days, but usually 1–2 days before onset of rash, continuing until lesions are crusted (5 days). |
| Chikungunya virus disease | 1–12 days (usually 3–7 days) | Not transmitted directly person to person. |
| Common cold | 12–72 hours (usually 24 hours) | From 1 day before to 5 days after onset. |
| Measles | 10–14 days until rash appears | From 1 day before the beginning of the prodromal period (usually about 4 days before rash onset) to 4 days after the onset of the rash. |
| Smallpox | 7–19 days, commonly 10–14 days to onset of illness and 2–4 days more to onset of rash | From the time of development of the earliest lesions to disappearance of all scabs (about 3 weeks). |
| Mumps | 12–26 days (usually 18 days) | From 6 days before to 9 days after symptoms appear. |
| Rubella | 14–17 days with a range of 14–21 days | 1 week before to 4 days after onset of rash. |
| Rabies | 2–8 weeks or longer | From animals, 3–5 days before symptoms and during the course of the disease. |
| Ebola virus disease | 2–21 days (usually 8–10 days) | As long as blood and secretions contain the virus. Can be as long as 61 days after onset of illness from care of corpses. |
| Norovirus | 4 hours to 3 days | A person with symptoms can spread norovirus up to 72 hours after recovery. |
| West Nile encephalitis | 3–12 days | Not transmitted directly person to person. |
| Hepatitis B | 45–180 days (average 60–90 days) | From many weeks before the onset of the first symptoms and throughout the clinical course of the disease. |
| Hepatitis C | 2 weeks to 6 months | Can spread 1 or more weeks before the onset of symptoms and may persist in most persons indefinitely. |
| Zika virus disease | 3–12 days | Not transmitted directly person to person. |
Host and Pathogen Interactions
An individual who is a true carrier harbors the pathogen but never exhibits clinical symptoms of disease. A carrier is “infectious” and can disseminate the pathogen to susceptible persons. Carrier status may be of limited duration or chronic, lasting for months or years. Mary Mallon, known as “Typhoid Mary,” was a healthy, or true, carrier of the bacterium Salmonella typhi, the causative agent of typhoid fever. She was the first known healthy carrier in the United States; she was responsible for at least 122 cases of typhoid fever, including 5 deaths, during the early 1900s. She was forced into quarantine twice. (See the sources at the end of the chapter, in particular the reviews by Marineli et al., 2013, and Soper, 1939.)
An incubatory carrier is an infected person during the incubation period of an infectious disease who is capable of spreading or disseminating the pathogen. The incubatory carrier is going to become ill but is infectious before symptoms appear. For example, a person infected with measles virus begins to shed the virus present in nasal and throat secretions a day or two before symptoms of a rash are noticeable. A second notable example is a person infected with HIV who is infected many years before any symptoms develop.
Convalescent carriers are people who remain infectious during and after their recovery from illness. This happens with many infectious diseases. Individuals with Salmonella may excrete the bacterium in feces for several weeks, and rarely a year or more. Recent survivors of EVD may be infectious for months after symptoms resolve, as Ebola virus has been found in semen of male survivors as long as 9 months after recovery.
Determining the means by which pathogens are transmitted is a major objective in epidemiological studies because once the mechanisms by which a particular disease is transmitted are understood, it may be possible to apply measures to prevent transmission from taking place. The mode of transmission is defined as how an infectious disease is spread or passed on. The mode of transmission can be direct (e.g., through touching, kissing, or sexual contact or by droplet or oral–fecal transmission) or indirect (e.g., through food, fomites, blood, insect vectors, or air). A zoonosis is any infection or infectious disease transmissible from animals to humans; for example, rabies virus can be transmitted to humans through the bite from a rabid animal. The saliva of the rabid animal contains rabies viruses.
Disease Agents
Infectious agents leave their reservoir by some mode of transmission. The natural reservoir of a pathogen is defined as the site where the etiological agent lives, grows, and multiplies (e.g., humans; animals such as rats, bats, or nonhuman primates; or arthropods, such as mosquitoes). Several characteristics influence whether an infectious agent can be transmitted to a host and cause disease, as well as the severity of the disease and the outcome of infection.
Table 6-2 Infectious Dose of Viruses that Cause Disease in Humans*
| Virus | Infectious Dose |
|---|---|
| Measles virus | Measles is one of the most highly infectious diseases. Spending more than 15 minutes in direct contact with someone infected with measles virus is sufficient to transmit the virus. |
| Hepatitis B virus | 0.00001–0.00000001 mL of blood containing hepatitis B virus. |
| 1918 pandemic influenza A virus | Estimated to be the inhalation of 1–10 virions. |
| Norovirus | Ingestion of 10–100 virions. |
| Seasonal influenza A virus strains | Inhalation of 1,000–2,000 virions. |
*There are examples of viral infections that do not result in disease, such as the use of attenuated, live viruses used in vaccination to prevent disease. | |
The infectious dose (sometimes called the infective dose) is the minimum number of infectious agents or amount of infectious material necessary to establish infection and produce a measurable effect or disease (see TABLE 6-2). Two epidemiological terms are often used to describe the ability of the etiological agent to cause disease: virulence and pathogenicity. Virulence is a measure of the severity of disease caused by a pathogen. Pathogenicity is the ability of an infectious agent to cause disease.
R0, or R-nought, is a measure of the potential for transmission or the reproduction rate of an infectious disease. It is the mean number of secondary cases occurring in a nonimmunized (susceptible) population in the wake of a particular infection. The R0 values for several infectious diseases are listed in TABLE 6-3.
6.2 History of Epidemiology: From Observational Data to Preventative Action
Three pioneers of epidemiology—Edward Jenner, John Snow, and Florence Nightingale—were not knowledgeable about the pathogenesis of disease. Their important observations and actions, however, led to the prevention of smallpox (1796) and cholera (1854) and a reduction in mortality rates of wounded men in the British Army during the Crimean War (1855), respectively.
Jenner was a British general practitioner and surgeon in the late 18th century who became very interested in smallpox. At the time he was practicing, smallpox was a worldwide scourge, killing thousands each year in England alone. Survivors were badly scarred and disfigured. Many who suffered from smallpox became blind as a result of corneal infections.
Table 6-3 Basic Reproduction Rate (R0) Within Human Populations
| Virus | R0 |
|---|---|
| Measles virus | 12–18 |
| Variola virus (causes smallpox) | 5–7 |
| Influenza A virus (1918) | 1–3 |
| Poliovirus | 5–7 |
| Human immunodeficiency virus (HIV) | 2–5 |
| Influenza A virus | 2–3 |
| Rabies virus | < 1 |
| Ebola virus (Makona strain in West Africa epidemic) | 2 |
| Mumps virus | 4–7 |
| SARS-associated coronavirus (SARS-CoV) | 2–5 |
| Rubella virus | 5–7 |
| Norovirus | 3–5 |
Jenner observed that milkmaids appeared to be immune to smallpox. He deduced that the pustules or lesions they occasionally got on their hands were caused by a cowpox virus, a relative of the variola virus that causes smallpox. He hypothesized that exposure to the cowpox virus would protect individuals from contracting smallpox. The results of Jenner’s experiment on an 8-year-old “volunteer” led to the vaccination of millions of humans against smallpox, saving virtually all of them from death or disfigurement (FIGURE 6-4). His experiment, however, brings up many ethical issues and implications. Today, Jenner would be required to justify his experiment before an institutional review board (IRB).

FIGURE 6-4 Painting of the first vaccination to prevent smallpox performed by Edward Jenner.
John Snow was a 19th-century physician in London who earned a reputation for his use of anesthetics, most notably when he provided chloroform to Queen Victoria during the birth of her children. Snow was later recognized as an epidemiological hero. He possessed excellent critical thinking skills, recognizing that a disease prevention strategy could be conceived if one could locate the source of a disease. Snow believed in the germ theory of disease during a time when the majority of his colleagues believed in the miasma theory, which held that a disease was caused by miasma, or polluted gases that rose from swamps and decaying or putrid matter. Many of the concepts and epidemiological methods Snow developed are still useful today.
In London, during the first 10 days of September 1854, approximately 500 people died from cholera. At the time of the epidemic, Snow’s rival, the Registrar General William Farr, collected data to support the hypothesis that the people were contracting cholera from a miasma (FIGURE 6-5). He believed that there were more deaths in the parts of London located at the lowest elevations. Residents began to panic and spread rumors that cholera was being transmitted by miasma emanating from the ground where Black Death (plague) victims were buried during a pandemic in the previous century, a site upon which homes had since been built.
Snow attended and observed cholera patients as a practicing physician prior to this outbreak. He observed young children who shared hospital beds in which they caught cholera from each other. This reinforced his affirmation that cholera was transmitted by “direct contagion.” He became a cholera expert by combining his clinical observations with microscopic analysis of different water sources. Suspicious that cholera was transmitted by contaminated water, Snow compared water sources used by those who got cholera and those who did not. His scientific observations allowed him to develop a classic experiment to study the 1854 London cholera epidemic.
The registrar general cooperated with Snow by providing him with the addresses of those individuals who died from cholera, and Snow plotted the deaths on a map of the area. From this, he could immediately determine that cholera deaths were not localized to the area where plague victims were buried. He also knew that each household signed up randomly for water sources provided by water companies, so he walked door to door in order to determine who supplied water to the homes of the cholera victims. Snow developed a test using silver chloride to distinguish differences among the three water sources available and became so proficient that he could identify water sources on the basis of appearance and odor alone.

FIGURE 6-5 Nineteenth-century illustration that represents a cholera epidemic emanating from miasma or poisonous air.
Two water companies were located in a water intake area where the water was frequently contaminated by sewage outlets. One of the companies moved upstream and away from the polluted and contaminated part of London’s Thames River; Snow hypothesized that there would be fewer cholera deaths and cases occurring in households that used water from this company—an accurate hypothesis. Households that used water drawn from the two other companies, which were located downstream of the sewage outlets, had very high mortality rates from cholera, and the largest cluster of deaths and cases at the beginning of the epidemic occurred at a public water pump located on Broad Street (FIGURE 6-6).
Snow compiled mortality rates and locations of deaths, compared these to the locations of the water sources, and then submitted a report to Parliament. On September 7, 1854, he spoke publicly before the Board of Guardians, a political group charged with the safety and welfare of the area. They documented his concerns and authorized the removal of the pump handle on the Broad Street water pump the next day. Removal of the pump handle led to an immediate, measurable reduction in the number of cholera deaths. Snow was able to prove his hypothesis: that a waterborne disease was spread by ingesting contaminated water that traveled both on the surface (the Broad Street pump) and through groundwater supplies (water piped from the two companies located downstream of London’s sewage outlets). His “Grand Experiment” was the groundwork for descriptive epidemiological investigation.
Florence Nightingale is consistently credited for her establishment of modern nursing practices. She was a brilliant organizer and statistician, and one of the most influential women of the 19th century. Nightingale was born into a wealthy family in 1820, a time when women did not attend universities or pursue careers. She was driven to lead a professional rather than domestic life and refused marriage proposals from several prominent suitors. Instead, she pursued a career in nursing, a choice to which her parents were opposed.
Nightingale’s mark on epidemiology was linked to her collection of statistics and graphical representation of mortality rates of British Army soldiers during the Crimean War. She observed the unsanitary conditions of the army hospital, where infectious diseases such as typhus, cholera, and dysentery were rampant. Many of the wounded soldiers died of bacterial infections instead of battle wounds. Nightingale believed these infections were preventable and worked hard to improve the quality of sanitation. She provided members of the Royal Commission on the Health of the Army with briefs that included facts, tables, and statistics regarding the spread of infection and the resulting mortality rates (FIGURE 6-7). The Royal Commission was charged with investigating the army’s sanitary conditions, the organization of its staff, and its treatment of sick and wounded soldiers. Nightingale’s reform efforts dramatically reduced the hospital mortality rate. After the war, Nightingale returned to England as a national hero. She published two books on reforming military hospitals that addressed the hygienic conditions wounded men in the British Army were exposed to during the Crimean War.
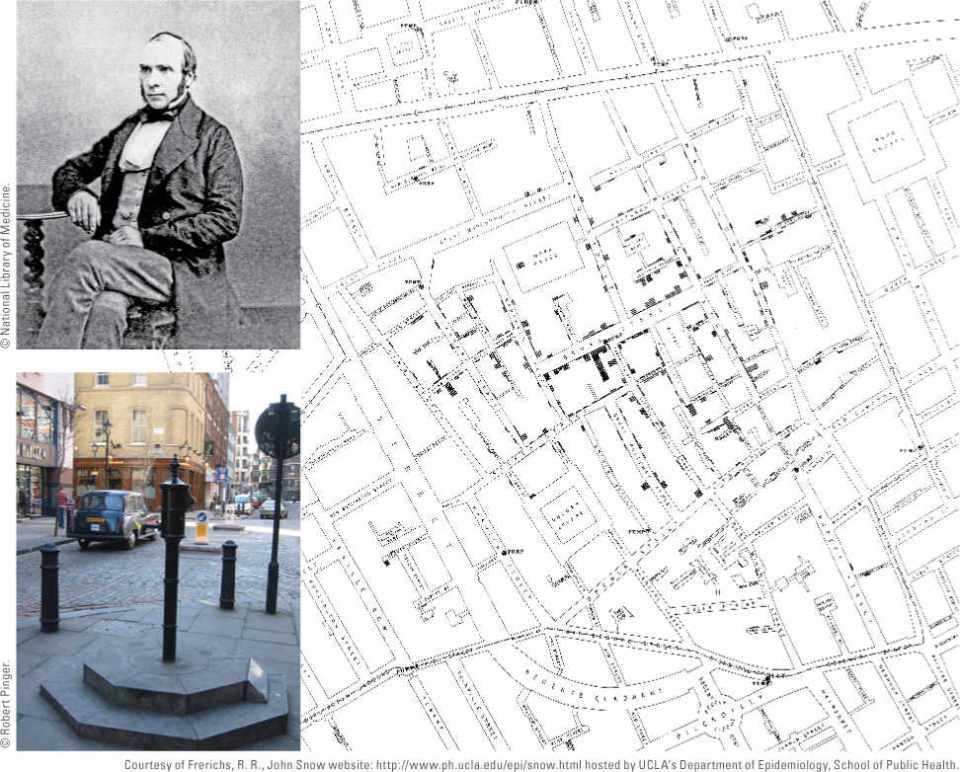
FIGURE 6-6 At the beginning of the 1854 London cholera epidemic, clusters of deaths occurred along the Broad Street water pump. This is a portion of the original map created by Dr. John Snow (inset) and published in 1855. Deaths are plotted as lines parallel to the front of the building in which the people died.
6.3 The Complexities of Disease Transmission
The disease triangle model represents one of the fundamental concepts behind disease causality. Before a viral disease actually occurs, the interaction among the viral agent, host, and environment may alter the host’s susceptibility. For example, 80% of the population suffers from cold sores, which are caused by herpes simplex virus 1 (HSV-1). HSV-1 usually remains dormant, with an infected individual showing no signs or symptoms of infection. However, HSV-1 may be reactivated to produce infectious particles and disease symptoms during times of physical or emotional stress, menstruation, pregnancy, immune deficiency, or physical trauma. This change in the host increases his or her susceptibility to HSV-1 infection.
Factors Associated with Increased Risk
Epidemiologists gather information to identify populations at risk for disease and the factors that contribute to human susceptibility. TABLE 6-4 lists some of the environmental factors and host and pathogen characteristics that influence the pattern of viral infections in humans conceptualized by the disease triangle model of disease causation. VIRUS FILE 6-1 discusses viral outbreaks throughout history that have impacted war and religion.
Modes of Transmission
As discussed earlier, viral infections are spread in different ways based on the mode of transmission of the virus. Viral diseases can be transmitted directly or indirectly. In direct transmission, the virus is passed from person to person through direct physical contact, such as touching with contaminated hands or by sexual contact, kissing, or other forms of skin-to-skin contact. Viruses may also be shed in saliva and other secretions (such as sperm) and on the skin.

FIGURE 6-7 (a) Florence Nightingale (unknown date). (b) Re-creation of a polar area (wedge) diagram invented by Florence Nightingale to show the different causes of death of British soldiers during the Crimean War. The blue wedges measured from the center of the circle represent the deaths from war wounds. The green wedges represent the deaths from preventable (infectious) diseases. The black wedges represent deaths from all other causes. The data are not proportional to the area. (c) A contemporary version of the wedge diagram is depicted with the same color scheme: blue represents deaths caused by war wounds; green represents deaths caused by preventable (infectious) diseases; and black represents deaths from all other causes.
Table 6-4 Disease Triangle Model: Factors Associated with Viral Disease Causation
| Host Characteristics | Pathogen Characteristics | Environmental Factors |
|---|---|---|
| Age | Stability in the environment | Population density (crowding results in increased host exposure to the pathogen) |
| Sex | Virulence factors (enhanced ability to attach, invade, or multiply in the host) | Sanitary conditions |
| Race and genetic factors | Presence of immune evasion genes | Climate changes |
| Immune status (decreased) | Resistance to antiviral therapy | Environmental changes |
| Nutritional status (lack) | Enhanced mode of transmission | Blood products (contaminated) |
| Behavior (e.g., occupation, lifestyle, religion, customs) | Geographical locations | |
| Previous infections or current coinfections | Existence of zoonotic infections/vectors |
Indirect transmission occurs when the virus is transferred or carried by an intermediate to a host by one or more of the following means: air (inhalation), a vector (bite from an infected insect), food (ingestion of contaminated food), water (ingestion of contaminated water), or vehicle (e.g., transmission by fomites, which are contaminated inanimate objects such as shared toys or towels at a day care facility). Examples of viral diseases and their most common modes of transmission are listed in TABLE 6-5.
Chain of Infection
A strong association exists between the disease triangle model of disease causation and a concept called the chain of infection. The term chain of infection often is used in hospitals and other healthcare settings with regard to the control and prevention of infectious diseases. A viral pathogen leaves its source, or reservoir, through a portal of exit, and the virus then spreads by one or more modes of transmission. The virus enters the body of a susceptible host through its preferred portal of entry. The chain of infection can be broken at each step in the chain through any of the following practices:
Table 6-5 Human Viral Diseases and Their Most Common Modes of Transmission
| Viral Disease | Major Mode of Transmission |
|---|---|
| Influenza | Airborne |
| Common cold | Direct contact with secretions from infected person or airborne (droplet transmission) |
| Severe acute respiratory syndrome (SARS) | Close personal contact, especially to droplets of respiratory secretions from an infected person |
| Middle East respiratory syndrome (MERS) | Direct contact with nasal secretions from infected dromedary camels; limited transmission through human-to-human contact; foodborne? (drinking camel milk or eating camel meat) |
| Chickenpox | Direct contact or airborne (droplet transmission) |
| Measles | Direct contact or airborne (droplet transmission) |
| Hepatitis A | Foodborne (oral–fecal route) |
| Winter vomiting disease caused by norovirus | Foodborne (oral–fecal route); contact with infected person’s vomit and stool |
| Poliomyelitis | Waterborne (oral–fecal route) |
| Molluscum contagiosum | Usually transmitted by indirect contact with fomites such as sharing towels and direct human-to-human contact (common at day cares) |
| Acquired immune deficiency syndrome (AIDS) | Sex with person who tests positive for human immunodeficiency virus (HIV), vehicle transmission (HIV-contaminated needles/blood transfusions) |
| Oral cold sores | Contact with saliva laden with herpes simplex virus 1 is the most common mode |
| Mononucleosis (caused by Epstein-Barr virus) | Direct contact with saliva from infected person |
| Genital herpes | Sexual contact |
| Genital warts | Sexual contact |
| Hepatitis B | Contact with blood or body fluids containing hepatitis B virus; unprotected sex with an infected person |
| Hepatitis C | Contact with blood containing hepatitis C virus |
| West | Nile encephalitis Vector (mosquitoes) |
| Chikungunya illness | Vector (mosquitoes) |
| Dengue fever | Vector (mosquitoes) |
| Rabies | Direct (bite from infected mammal laden with saliva containing rabies virus) |
Rapid identification of the viral pathogen, and therefore an appropriate response to contain infections.
Proper sanitation.
Disinfection and sterilization of fomites.
Use of barrier techniques (i.e., protocols to prevent cross-contamination between healthcare workers and patients such as donning gloves, a face mask, a gown).
Handwashing.
Proper trash and waste disposal.
Proper food handling.
Aseptic technique.
Recognition of high-risk individuals.
The Concept of Herd Immunity
The concept of herd immunity is based on the premise that if the majority of the population is protected from a disease through immunizations or genetic resistance, the chance of a major epidemic is highly unlikely. Jonas Salk, who developed the polio vaccine during the 1950s, suggested that if herd immunity was at 85% a polio epidemic would not occur. Herd immunity provides a barrier to direct transmission of infectious diseases through a population (FIGURES 6-8 and 6-9).

FIGURE 6-8 Diagram showing a population with a high immunization level, resulting in good protection of the population. In this situation, immunity/protection is at 85%. The susceptible population is at 15%.
During the 1950s and 1960s, it was not uncommon in the United States for parents to encourage their healthy children to interact with children suffering from viral diseases such as mumps (caused by mumps virus) and chickenpox (caused by varicella zoster virus). They wanted their children to get sick and become immune before they reached adulthood because it was known that contracting such illnesses in adulthood resulted in a severe illness with complications. At the same time, herd immunity occurred through the intentional exposure of viruses during childhood. Prior to 1995, each year close to 4 million American children younger than age 15 had chickenpox, resulting in 7,400 hospitalizations and more than 50 deaths. Chickenpox exists globally. Nearly all unvaccinated children are infected during their early years. Chickenpox, with rare exceptions, confers lifelong immunity, eliminating the need for vaccination. However, like measles, chickenpox can cross the placenta and cause serious fetal damage. In 2010, an MMRV (measles, mumps, rubella, varicella) vaccine became available as a childhood vaccine.
However, some parents purposely promote “chick-enpox parties” to get their children naturally infected with varicella zoster virus. Their belief is that something “natural” (the disease) is better than something artificial (the vaccine) or that immunity from the disease will be more permanent than that obtained from the vaccine. In 2011, state officials cracked down on a Tennessee woman whose Facebook page “Find a Pox Party Near You” was advertising the sale of lollipops licked by children with chickenpox (FIGURE 6-10). Chickenpox is not spread through oral secretions. A child licking a tainted lollipop will not get chickenpox. However, the child could pick up bacteria or other viruses, spreading other diseases. Today, the goal of any public health immunization program is to reach 100% immunity in a population.

FIGURE 6-9 Diagram showing a population with a low immunization level, resulting in a low level of protection of the population and an epidemic. In this situation, immunity is at 32%. The susceptible population is at 68%.
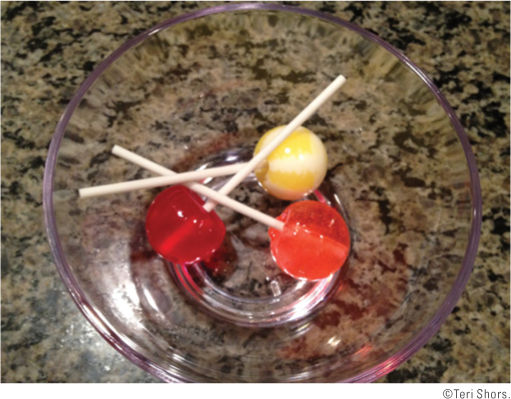
FIGURE 6-10 In 2011, some parents who feared the chickenpox vaccine purchased lollipops prelicked by children suffering from chickenpox to try to infect their children the “natural” way during “pox parties.” Health and legal authorities warned parents against this practice.
6.4 Epidemiology Today
The Goals of Epidemiology: What Does an Epidemiologist Want to Know?
During a real epidemic, an epidemiologist wants to know the following:
Case definition (what)
Person (who)
Place (where)
Time (when)
Risk factors (how and why)
Descriptive Epidemiology
An epidemiological investigation starts with the gathering of information and confirmation of the epidemic. Diagnostic tests are conducted, and a case definition is set in place. A case definition is the uniform criteria that are used to define a disease (e.g., signs and symptoms). Next, descriptive studies are performed following the epidemic, such as the one presented in VIRUS FILE 6-2, which describes the first cases of AIDS in Los Angeles, California. Descriptive studies are usually inexpensive and of short duration. They are used to generate a testable hypothesis or enough evidence to indicate sufficient cause for conducting lengthier and more costly analytical studies.
Dr. John Snow’s search for the cause of the cholera epidemic in London in 1854 is an example of descriptive epidemiology. Descriptive studies are observations of when and where (time and place) the disease occurs and who is affected (person). The studies take into account the onset and duration of the illness. Descriptions frequently include the age, sex, ethnicity, socioeconomic status, and overall health status (diet and immune status) of the affected individuals. Sometimes other information, such as environmental exposures and personal lifestyle characteristics, may be recognized as risk factors.
Descriptive studies may be published as case reports or surveillance studies. Case reports are anecdotal or clinical observations that may indicate a causal relationship. Surveillance studies may rely on data generated by death certificates or other traditional channels. After descriptive studies, control and prevention measures may be implemented and the results of the studies and measures are reported. Examples of graphs generated from descriptive studies are shown in FIGURE 6-11. Analytical epidemiology may be needed to determine the causes and effects (the why and how) of the epidemic.
Analytical Epidemiology
Analytical studies are more informative than descriptive studies. These investigations are hypothesis-driven studies that use descriptive research to determine the why and how pertaining to the variations in incidence and prevalence of diseases in different populations. Such investigations require good research design. In true analytical epidemiology, individuals in a population suffering from a disease are compared to a control group that does not have the disease and has not been exposed to the disease-causing agent. The control group may be matched by age, sex, location, and socioeconomic status. The two groups are studied, compared, and analyzed in what is called a case-control method (TABLE 6-6).
Analytical epidemiologists use the cohort method to study two similar populations or cohorts. Cohort members are grouped by common characteristics, especially birth year. One of the cohorts has been exposed to the disease-causing agent and the other has not. The cohorts may be studied as a group, backward in time (retrospective studies), at a single point in time (cross-sectional studies), or forward in time (prospective studies) (FIGURE 6-12). Most cohort studies require large numbers of human subjects that are followed over long periods of time (years).
During a college football game between teams from Florida and North Carolina in 1999, the members of the North Carolina team suffered from gastrointestinal distress during the game. The next day, members of the Florida team developed similar symptoms. A retrospective cohort study concluded that the source of the disease-causing agent, Norwalk virus (now known as a norovirus), was a turkey sandwich in a box lunch (this accounted for 95% of the primary cases). The researchers hypothesized that the virus was transmitted across the scrimmage line by person-to-person contact during the football game. The North Carolina team physician and coaches reported their players were vomiting on the sidelines and were playing in uniforms soiled with vomit and feces. Given the intense physical contact inherent in the football game, transmission likely occurred through oral–fecal transmission and aerosol transmission of the vomitus. Based on their findings, researchers recommended players with acute gastroenteritis be excluded from competition to avoid spreading the disease to other players (FIGURE 6-13 and TABLES 6-7 and 6-8).
Surveillance and Serological Epidemiology
Surveillance programs and reporting systems targeted at infectious diseases play a fundamental role in public health. Surveillance can take several forms:
Monitoring available data from mandated reports on reportable diseases (morbidity and mortality statistics).
Active field surveillance by epidemiologists at healthcare facilities, such as interviewing physicians and patients or reviewing medical records. VIRUS FILE 6-3 describes the use of sentinel chickens at the Canadian/U.S. border to monitor the spread of West Nile virus.
Serological screening of populations (e.g., monitoring the success of vaccination programs). Antibodies represent the “footprints” of disease, exposure to disease, and protection against disease.
Communicable Disease Surveillance Organizations and Their Publications or Reporting Mechanisms
In 1951, following the start of the Korean War, concurrent with its threat of biological warfare, the CDC formed the Epidemic Intelligence Service (EIS), a sort of disease SWAT team or “disease police.” EIS investigation sites are located worldwide (see http://www.cdc.gov/EIS/). EIS is a training program composed of physicians, researchers, and scientists that plays a pivotal role in combating the causes of major epidemics, including ones caused by emerging viruses such as Nipah, Ebola, and Rift Valley fever. Field virologist Dr. C. J. Peters has been involved in global epidemiological investigations for 40 years, most notably the first Ebola outbreaks in Africa. While serving as the head of the Special Pathogens Branch at the CDC from 1992 to 2000, Peters worked with many EIS officers (see VIRUS FILE 6-4).
Official organizations from the United States, Canada, the European Union, and other member states of the WHO share the same mission: that all people attain the highest possible level of health. Organizations also focus on the health of wildlife, such as the National Wildlife Health Center (http://www.nwhc.usgs.gov). Part of its mission is to support the development of advanced diagnostics to detect zoonotic pathogens and the control of wildlife disease dynamics.
A short list of some of the major organizations, their headquarter locations, and epidemiological publications relating to infectious diseases is provided in TABLE 6-9. These organizations perform ongoing surveillance of many viral diseases, respond to disease outbreaks, and develop and publish infectious disease prevention and control recommendations.

FIGURE 6-11 (a) A graph accompanying a descriptive study to characterize the epidemiology of measles in the United States from 1985 to 2003. This report summarized that no endemic measles was circulating in the United States at that time. Imported measles cases do, however, continue to occur and can result in limited indigenous transmission. (b) These are the results of an investigation of a hepatitis A outbreak that occurred at a restaurant in Monaca, Pennsylvania, in 2003. The outbreak was associated with contaminated green onions that were in large batches of salsa. The source was determined to be one or more farms in Mexico. At least 9,000 people who were at the restaurant or who were in contact with ill individuals were provided immunoglobulin as a preventative measure. The restaurant was closed. (c) Descriptive study showing the distribution of West Nile virus infection by area of residence, province of Quebec, Canada, 2002–2003.
Table 6-6 Case-Control Study Investigating the Risk Factors for Avian Influenza A (H5N1 strain) Disease in Hong Kong, 1997
| The study compared 15 human cases of human avian influenza to a control group that did not have antibodies against avian influenza A and was matched by age, sex, and neighborhood. Results of the interviews suggested that exposure to live poultry in the markets during the week prior to the illness was significantly associated with avian influenza disease (64% of the cases and 29% of the control group). Travel, eating or preparing poultry products, and recent exposures to individuals with respiratory illnesses, including influenza A, were not associated with influenza A illness. | ||
|---|---|---|
| No. (%) with Reported Exposure | ||
| Activity and Exposure | Case Patients (n = 15) | Controls (n = 41) |
| Exposure to poultry | ||
| Exposed to live poultry in marketa | 9/14 (64%) | 11/38 (29%) |
| Consumed poultry in restaurant | 6/12 (50%) | 9/31 (29%) |
| Consumed poultry organs or poultry | 1/14 (7%) | 4/38 (11%) |
| Consumed undercooked poultry products | 5/11 (45%) | 10/29 (34%) |
| Household member cooked poultry products | 2/13 (15%) | 11/33 (33%) |
| Household member in poultry industry | 0/14 (0%) | 0/38 (0%) |
| Exposure to human illness | ||
| Anyone in flat had influenza-like illnessb | 5/15 (33%) | 15/40 (38%) |
| Contact with known H5N1 case | 1/13 (8%) | 0/35 (0%) |
| Other exposure | ||
| Travel outside Hong Kong | 0/14 (0%) | 3/37 (8%) |
| Selected outdoor activitiesc | 2/14 (14%) | 8/37 (22%) |
| Live birds in home | 6/12 (50%) | 14/31 (45%) |
| Other animals in home | 2/13 (15%) | 1/33 (3%) |
| Played in indoor playground | 0/15 (0%) | 13/41 (32%) |
| Household uses soap to cleand | 5/14 (36%) | 25/38 (66%) |
aIncludes visiting poultry stall, retail or wholesale market selling live poultry, or poultry farm in week before illness. bInfluenza-like illness includes anyone with fever and cough or sore throat. cIncludes activities such as visiting aviary, feeding wild birds in park, and/or having picnic in park. dUses soap and water to clean knife after preparation of poultry. Information from Mounts, A. W., et al. 1999. “Case-control study of risk factors for avian influenza A (H5N1) disease, Hong Kong, 1997.” J Infect Dis 180:505–508. Stay updated, free articles. Join our Telegram channel
Full access? Get Clinical Tree
 Get Clinical Tree app for offline access

| ||