3 Epidemiologic Surveillance and Epidemic Outbreak Investigation

I Surveillance of Disease
B Creating a Surveillance System
These objectives and methods should be developed with the aid of the investigators charged with collecting, reporting, and using the data. A pilot test should be performed and evaluated in the field, perhaps in one or more demonstration areas, before the full system is attempted. When it is operational, the full system also should be continually evaluated. The CDC has extensive information on surveillance at its website, www.cdc.gov.
C Methods and Functions of Disease Surveillance
The percentage of patients with reportable diseases that are actually reported to public health authorities varies considerably.1 One group estimated that the percentage reported to state-based passive reporting systems in the United States varied from 30% to 62% of cases.
Sometimes a change in medical care practice uncovers a previously invisible disease surveillance issue. For example, a hospital in Connecticut began reporting many cases of pharyngeal gonorrhea in young children. This apparently localized outbreak in one hospital was investigated by a rapid response team, who discovered that the cases began to appear only after the hospital started examining all throat cultures in children for gonococci and for beta-hemolytic streptococci.2
As discussed in Chapter 24, several states and regions have cancer registries, but the United States has no national cancer registry. Fatal diseases can be monitored to some extent by death certificates, but such diagnoses are often inaccurate, and reporting is seldom rapid enough for the detection of disease outbreaks. (The reporting systems for occupational and environmental diseases and injuries are discussed in Section 3 of this book.)
2 Evaluation of Time Trends
Secular (Long-term) Trends
The implications of secular (or long-term) trends in disease are usually different from those of outbreaks or epidemics and often carry greater significance. The graph in Figure 3-1 from a CDC surveillance report on salmonellosis shows that the number of reported cases of salmonellosis in the United Sates has increased over time. The first question to ask is whether the trend can be explained by changes in disease detection, disease reporting, or both, as is frequently the case when an apparent outbreak of a disease is reported. The announcement of a real or suspected outbreak may increase suspicion among physicians practicing in the community and thus lead to increased diagnosis and increased reporting of diagnosed cases. Nevertheless, epidemiologists concluded that most of the observed increase in salmonellosis from 1955 to 1985 was real, because they noted increasing numbers of outbreaks and a continuation of the trend over an extended time. This was especially true for the East Coast, where a sharp increase in outbreaks caused by Salmonella enteritidis was noted beginning about 1977. A long-term increase in a disease in one U.S. region, particularly when it is related to a single serotype, is usually of greater public health significance than a localized outbreak because it suggests the existence of a more widespread problem.
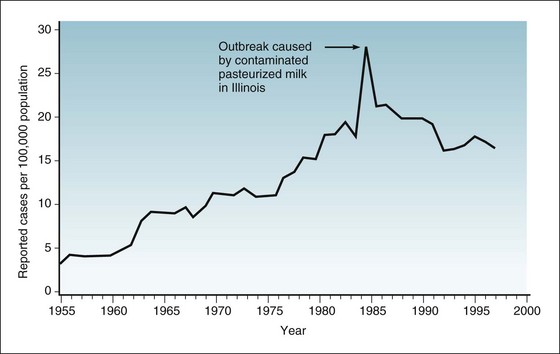
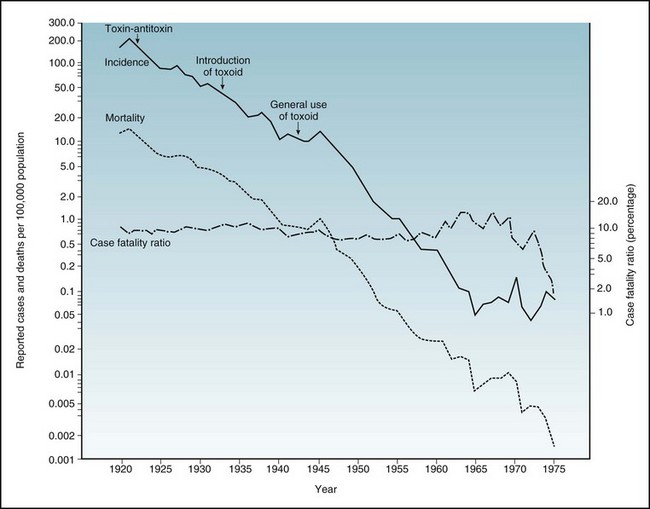
Figure 3-2 shows the decline in the reported incidence and mortality from diphtheria in the United States. The data in this figure are presented in the form of a semilogarithmic graph, with a logarithmic scale used for the vertical y-axis and an arithmetic scale for the horizontal x-axis. The figure illustrates one advantage of using a logarithmic scale: The lines showing incidence and mortality trace an approximately parallel decline. On a logarithmic scale, this means that the decline in rates was proportional, so that the percentage of cases that resulted in death—the case fatality ratio—remained relatively constant at about 10% over the years shown. This relative constancy suggests that prevention of disease, rather than treatment of people who were ill, was responsible for the overall reduction in diphtheria mortality in the United States.
Seasonal Variation
Infectious diseases that are spread by the respiratory route, such as influenza, colds, measles, and varicella (chickenpox), have a much higher incidence in the winter and early spring in the Northern Hemisphere. Figure 3-3 shows the seasonal variation for varicella in the United States, by month, over a 6-year period. Notice the peaks after January and before summer of each year. Such a pattern is thought to occur during these months because people spend most of their time close together indoors, where the air changes slowly. The drying of mucous membranes, which occurs in winter because of low humidity and indoor heating, may also play a role in promoting respiratory infections. Since the introduction of varicella vaccine, this seasonal pattern has been largely eliminated.
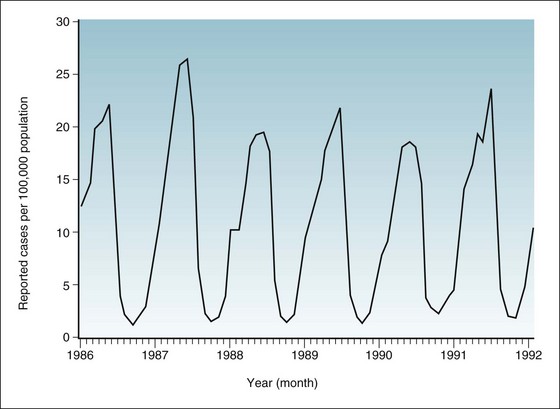
Figure 3-3 Incidence rates of varicella (chickenpox) in the United States, by month of report, 1986-1992.
(Data from Centers for Disease Control and Prevention: Summary of notifiable diseases, United States, 1992. MMWR 41:53, 1992.)
Infectious diseases that are spread by the fecal-oral route are most common in the summer, partly because of the ability of the organisms to multiply more rapidly in food and water during warm weather. Figure 3-4 shows the summer seasonal pattern of waterborne outbreaks of gastrointestinal disease. The peak frequency of outbreaks attributable to drinking water occurs from May to August, whereas the peak for outbreaks attributable to recreational water (e.g., lakes, rivers, swimming pools) occurs from June to October.
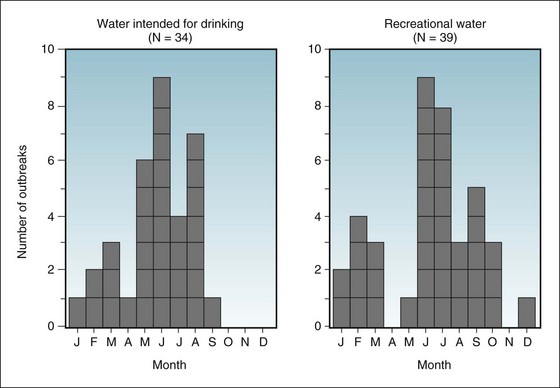
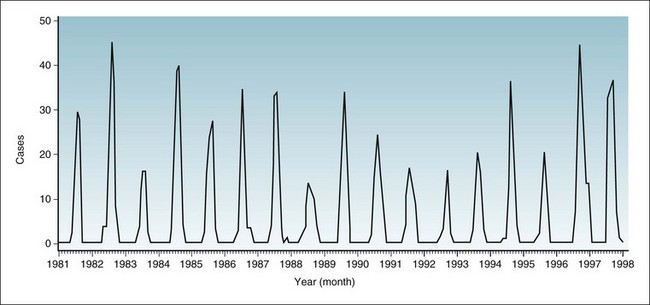
Figure 3-5 shows a late-summer peak for aseptic meningitis, which is usually caused by viral infection spread by the fecal-oral route or by insects. Figure 3-6 shows a pattern that is similar but has sharper and narrower peaks in late summer and early autumn. It describes a known arthropod-borne viral infection caused by California-serogroup viruses of the central nervous system.
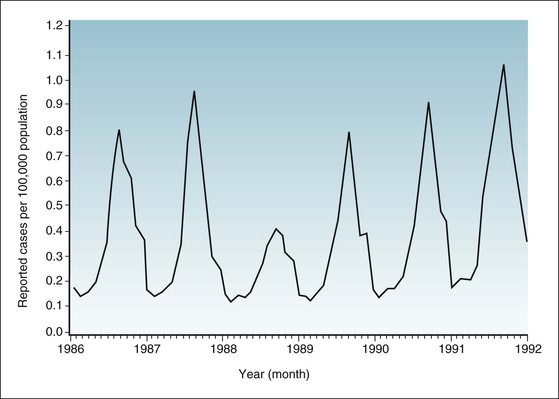
Figure 3-5 Incidence rates of aseptic meningitis in the United States, by month of report, 1986-1992.
(Data from Centers for Disease Control and Prevention: Summary of notifiable diseases, United States, 1992. MMWR 41:20, 1992.)
3 Identification and Documentation of Outbreaks
Figure 3-8 provides data concerning the expected percentage of deaths caused by pneumonia and influenza in 122 U.S. cities for 1994 through 2000. The lower (solid) sine wave is the seasonal baseline, which is the expected percentage of pneumonia and influenza deaths per week in these cities. The upper (dashed) sine wave is the epidemic threshold, with essentially no influenza outbreak in winter 1994-1995, a moderate influenza outbreak in winter 1995-1996, and major outbreaks in the winters of 1996-1997, 1997-1998, and 1998-1999, as well as in autumn 1999. No other disease has such a sophisticated prediction model, but the basic principles apply to any determination of the occurrence of an outbreak.
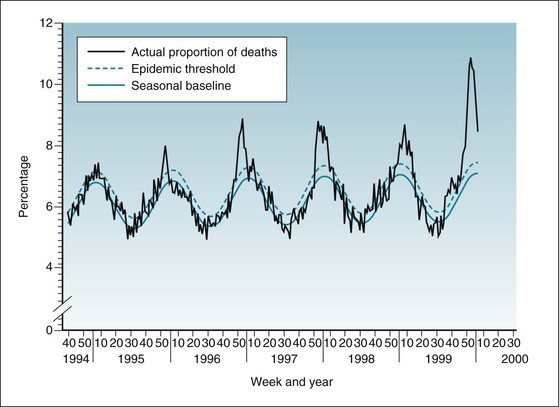
Figure 3-8 Epidemic threshold, seasonal baseline, and actual proportion of deaths caused by pneumonia and influenza in 122 U.S. cities, 1994-2000.
The epidemic threshold is 1.645 standard deviations above the seasonal baseline. The expected seasonal baseline is projected using a robust regression procedure in which a periodic regression model is applied to observed percentages of deaths from pneumonia and influenza since 1983.
(Data from Centers for Disease Control and Prevention: Update: influenza activity—United States and worldwide, 1999-2000. MMWR 49:174, 2000.)
Surveillance for Bioterrorism
For at least a century, epidemiologists have worried about the use of biologic agents for military or terrorist purposes. The basic principles of disease surveillance are still valid in these domains, but there are special concerns worth mentioning. The most important need is for rapid detection of a problem. With regard to bioterrorism, special surveillance techniques are being developed to enable rapid detection of major increases in the most likely biologic agents3 (Box 3-1). Detection is made more difficult if the disease is scattered over a wide geographic area, as with the anthrax outbreak in the United States after terrorist attacks in late 2001.

A technique developed for more rapid detection of epidemics and possible bioterrorism is syndromic surveillance.3 The goal of this surveillance is to characterize “syndromes” that would be consistent with agents of particular concern and to prime the system to report any such syndromes quickly. Rather than trying to establish a specific diagnosis before sounding an alert, this approach might provide an early warning of a bioterrorism problem.
4 Evaluation of Public Health and Disease Interventions
The introduction of major interventions intended to change patterns of disease in a population, especially the introduction of new vaccines, should be followed by surveillance to determine if the intended changes were achieved. Figure 3-9 shows the impact of the two types of polio vaccine—the inactivated (Salk) vaccine and the oral (Sabin) vaccine—on the reported incident cases of poliomyelitis. The large graph in this figure has a logarithmic scale on the y-axis. It is used here because the decline in the poliomyelitis incidence rate was so steep that on an arithmetic scale, no detail would be visible at the bottom after the early 1960s. A logarithmic scale compresses the high rates on a graph compared with the lower rates, so that the detail of the latter can be seen.
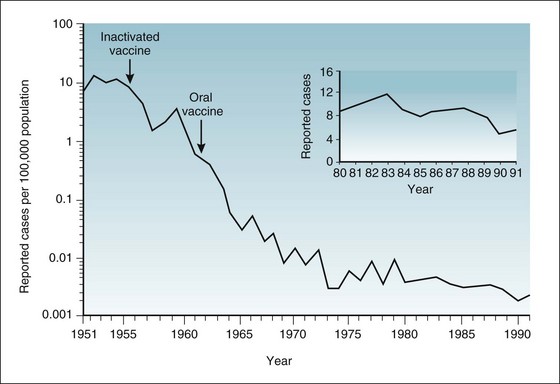
Figure 3-9 Incidence rates of paralytic poliomyelitis in the United States, by year of report, 1951-1991.
(Data from Centers for Disease Control and Prevention: Summary of notifiable diseases, United States, 1991. MMWR 40:37, 1991.)
Figure 3-9 shows that after the inactivated vaccine was introduced in 1955, the rates of paralytic disease declined quickly. The public tended to think the problem had gone away, and many parents became less concerned about immunizing newborns. Because the inactivated vaccine did not provide herd immunity, however, the unimmunized infants were at great risk. A recurrent poliomyelitis spike occurred in 1958 and 1959, when most of the new cases of paralytic poliomyelitis were in young children who had not been immunized. The rates declined again in 1960 and thereafter because the public was shaken out of its complacency to obtain vaccine and because a newer oral vaccine was introduced. This live, attenuated oral vaccine provided both herd immunity and individual immunity (see Figure 1-2).


Stay updated, free articles. Join our Telegram channel

Full access? Get Clinical Tree


