Spiral
Rotational
Galvo
MEMS
Scanner


Location
Distal
Distal
Proximal
Distal
Fast axis
>1 kHz
>1 kHz
1–5 kHz
>3 kHz
Slow axis
NA
NA
<10 Hz
<30 Hz
Footprint
<3 mm
<3 mm
<1 cm
<1 mm
Fiber (mode)
Single
Single
Multi-mode bundle
Single
Batch fabrication
No
No
No
Yes
A spiral scanner consists of a tubular piezoelectric actuator that drives the distal tip of a single optical fiber using sinusoidal waveforms near resonance. This method is used in the scanning fiber endoscope (SFE) and in some multi-photon endomicroscopes. The spiral scan pattern can achieve much faster frame rates than that for raster scanning. The rotational scanner mechanically “rotates” the laser beam circumferentially around the longitudinal axis of the instrument after a 45° deflection off a mirror or prism and is used in OCT and photoacoustic endomicroscopes. The galvo-scanner is an electromechanical mechanism that performs beam scanning by deflecting a mounted mirror. The relatively large size limits its use to steering a focused beam into the proximal end of a coherent bundle of optical fibers. This technique is used in confocal endomicroscopy (Cellvizio®, Mauna Kea Technologies). This scanner provides deflections in the slow axis and is used with an oscillating mirror that performs scanning in the fast axis. Micromirrors have been developed with micro-electro-mechanical systems (MEMS) technologies that use either electrothermal or electrostatic actuators to achieve large deflection angles and high dynamic bandwidths with excellent linearity. These scanners can be batch fabricated on silicon wafers to achieve devices with large yield. MEMS scanners require complicated fabrication processes but have great flexibility in scanning speed and device dimensions.
Since the emergence of MEMS, various scanners and actuators have been widely used in imaging prototypes. Based on different working principles, there are several types of miniature micromirrors for endomicroscope (Table 30.2), including bulky piezoelectric [3], electrostatic [4, 5], electrothermal [6–8], electromagnetic scanner [9–11], and thin-film piezoelectric [12]. Electrostatic devices are most commonly used because of the fast scan speeds that can be achieved with low power consumption, but the driving voltage may be too high for clinical use (>100 V). By comparison, thin-film piezoelectric devices have very good performance with low driving voltage and ultralow power consumption and may be the future for scanners and actuators in endomicroscopy. The low fill-in factor (<50 %) of existing micromirrors is a common problem that may be solved by microassembly or advanced manufacturing processes [8].
Table 30.2
MEMS scanners for in vivo endomicroscopy
Parameter | Electrostatic | Electrothermal | Electromagnetic | Bulky piezo | Thin-film piezo |
|---|---|---|---|---|---|
Footprint | Compact | Compact | Bulk | Large | Compact |
Integration complexity | Simple | Simple | Complex | Medium | Simple |
Maximum z-axis | ~1 mm in vacuum | >1 mm at ambient | >1 mm at ambient | ~0.3 mm in-plane motion | >0.5 mm at ambient |
Mechanical tilting angle | ±10 | ±20 | ±20 | N/A | >±10 |
Driving voltage (V) | Medium (20–150) | Low (<10) | Low (<20) | High (>100) | Low (<20) |
Driving current (mA) | ~0 | ~15 | ~50–100 | ~0 | ~0 |
Power consumption | Low | ~100 mW | ~200 mW | Low | Ultralow |
30.4 Scanning Fiber Endoscopy
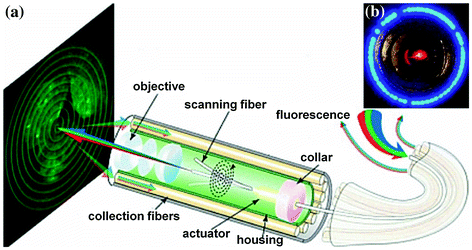
In the SFE, a tubular piezoelectric actuator scans a single-mode optical fiber in a spiral pattern to create an image with a large field of view, Fig. 30.1a. Laser light at three excitation wavelengths (λ ex = 440, 532, and 635 nm) is delivered through the scanning fiber, and a multi-lens objective located in the distal tip of the endoscope focuses the beams onto the tissue surface. Reflectance and fluorescence is collected by a ring of multi-mode optical collection fibers arranged around the perimeter of the instrument, Fig. 30.1b. Images are collected at video rate (30 frames/s) to overcome motion artifacts in vivo. The SFE imaging technology was first developed for the early detection of cancer in the esophagus, pancreatic duct, and peripheral airways of the lung using reflected white light [13]. Recently, it has been adapted for collection of fluorescence to visualize over expressed molecular targets [14].


Fig. 30.1
Scanning fiber endoscope. a System design of multi-spectral scanning fiber endoscope (SFE). b En-face view of distal tip shows scanning fiber (red) in center surrounded by a ring of multi-mode collection fibers for light collection (blue). Recreated with kind permission from SPIE [14]
The detection system make use of a set of additive and subtractive filters (longpass λ LP = 450 nm and notch λ N1 = 532 nm and λ N2 = 632.8 nm) to reject reflectance from the laser excitation sources. The distal tip is 1.6 mm in outer diameter and has a 10 mm rigid end. Three peptides with unique amino acid sequences were identified using phage display technology and were used as molecular probes that bind specifically to premalignant colonic mucosa (adenoma). These peptides were fluorescently labelled with fluorophores that emitted light in different parts of the spectrum (non-overlapping). Diethylaminocoumarin-3-carboxylic acid (DEAC) with absorption and emission peaks at 432 and 472 nm, 5-carboxytetramethylrhodamine (TAMRA) with absorption and emission peaks at 541 and 568 nm, and CF633 with absorption and emission peaks at 630 and 650 nm were used. The excitation wavelengths nearly matched the three lasers used.
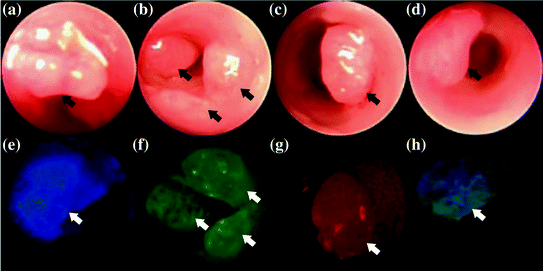
Application of this technology was demonstrated in vivo in CPC: Apc mice that are genetically engineered to develop adenomas spontaneously [15]. These mice are developed with a mutation in the APC genes that also frequently found in human colorectal cancer; thus, this mouse model is highly representative of the clinical condition. First, white-light images were collected with a conventional endoscope, Fig. 30.2a–d. Fluorescence images were collected in vivo after topical application of the fluorescently labelled peptides KCCFPAQ-DEAC (blue), AKPGYLS-TAMRA (green), and LTTHYKL-CF633 (red). Specific binding of each peptide to the adenoma but not to the surrounding normal colonic mucosa can be seen in Fig. 30.2e–g. The peptides could also be combined as a “cocktail”, Fig. 30.2h. This capability has potential to detect multiple molecular targets in a broad patient population where the genetic changes are heterogeneous.


Fig. 30.2
In vivo multi-spectral images. a–d Conventional white-light images collected from distal colon of CPC Apc mice genetically engineered to develop adenomas (arrow) spontaneously. Fluorescence images collected with SFE after topical administration of fluorescently labelled peptides, e KCCFPAQ-DEAC, f AKPGYLS-TAMRA, and g LTTHYKL-CF633 demonstrate specific binding to premalignant lesion in comparison with adjacent normal mucosa, h image from “cocktail” of peptides. Recreated with kind permission from Elsevier [15]
30.5 Optical Coherence Tomography Endomicroscopy
Optical coherence tomography (OCT) is an interferometric technique that uses near-infrared (NIR) light to penetrate deeply into tissue to perform minimally invasive imaging. Backscattered light is collected coherently to provide cross-sectional images with micron-scale resolution. Optical frequency-domain imaging (OFDI) is an enhancement of OCT that detects the individual spectral components of low coherence light separately with a fast detector to improve the signal-to-noise ratio and allow for faster frame rates [16]. This method visualizes tissue morphology and has been shown previously to be sensitive to the presence of Barrett’s esophagus and high-grade dysplasia (HGD) [17]. OCT endomicroscopy has been further developed into a tethered pill that can be swallowed to collect reflectance images. This engineering advance allows for imaging in an unsedated patient to potentially improve compliance with screening for early detection of cancer.
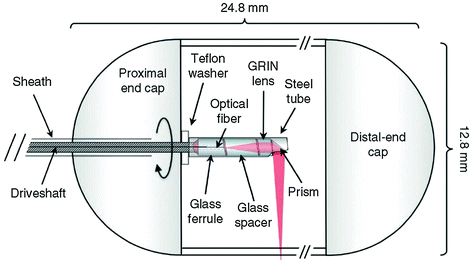
The capsule is transparent and cylindrical in shape with a diameter of 12.8 mm and a length of 24.8 mm, Fig. 30.3 [18]. The focusing optics consists of an optical fiber and gradient-index (GRIN) lens, and 45° prism that are contained within the shell. The spot size of the focused beam is 30 μm (full width at half maximum). The capsule is tethered to flexible sheath (0.96 mm diameter) that encloses a driveshaft and the optical fiber that transmits light to and from the tissue. The driveshaft rotates the optics inside the shell to collect circumferential, cross-sectional reflectance images continuously. The OFDI system uses NIR light with frequency ranging from 1,250 to 1,380 nm. Images are collected at 20 frames/s using 2,048 axial (depth) scans per image. The axial resolution is 7 μm in tissue, and the system sensitivity is ~110 dB. The images are reconstructed at full resolution (2,900 × 2,900 pixels) and displayed them using an inverse grayscale lookup table.


Fig. 30.3
Tethered capsule OCT. A driveshaft encloses the optical fiber and is connected to a steel tube that contains the miniature optics. A ferrule, spacer, gradient-index (GRIN) lens, and 45° reflecting prism are rotated to scan the focused beam around the circumference of the hollow organ. Recreated with kind permission from Nature America [18]
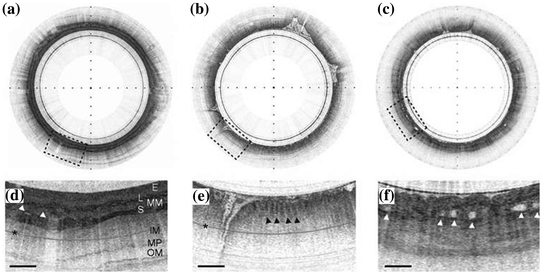
Clinical use of this endomicroscope has been demonstrated in unsedated patients who swallowed the capsule using a sip of water. The capsule was held by the tether and allowed to gently descend through the esophagus into the stomach, while images were collected. In vivo cross-sectional images of normal esophagus, stomach, and Barrett’s esophagus are shown in Fig. 30.4a–c. Features of normal esophagus can be appreciated on the expanded image (3X), including squamous epithelium (E), muscularis mucosa (MM), lamina propria (L), submucosa (S) containing blood vessels (arrowheads), inner muscularis (IM), outer muscularis (OM), and myenteric plexus (MP), scale bar 0.5 mm, Fig. 30.4d. An expanded image of normal stomach shows characteristic glandular “pits” (arrowheads), Fig. 30.4e. The expanded image of Barrett’s esophagus shows an irregular luminal surface, heterogeneous backscattering, and glands within the mucosa (arrowheads), Fig. 30.4f.


Fig. 30.4


OCT images in vivo. Cross-sectional OCT images in vivo of normal a esophagus and b stomach and of c Barrett’s esophagus, tick marks 1 mm. d Expanded image (3X) of normal esophagus shows the squamous epithelium (E), muscularis mucosa (MM), lamina propria (L), submucosa (S) containing blood vessels (arrowheads), inner muscularis (IM), outer muscularis (OM), and myenteric plexus (MP), scale bar 0.5 mm. The asterisk indicates a multiple reflection artifact; e expanded image (3X) of normal stomach shows characteristic glandular “pits” (arrowheads); f expanded image (3X) of Barrett’s esophagus shows an irregular luminal surface, heterogeneous backscattering, and glands within the mucosa (arrowheads). Recreated with kind permission from Nature America [18]
Stay updated, free articles. Join our Telegram channel

Full access? Get Clinical Tree


