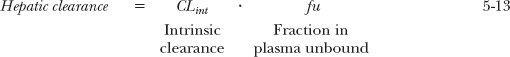
Elimination
OBJECTIVES
The reader will be able to:
- Define the meaning of the following terms: extraction ratio, glomerular filtration rate, hepatic acinus, hepatic sinusoids, hepatocellular activity, microsomal enzymes, nephron, perfusion, perfusion rate-limited elimination, phase I and phase II reactions, plasma-to-blood concentration ratio, primary metabolic pathways, prodrug, secondary metabolic pathways, sequential reactions, sinusoids (hepatic).
- Define the following using both words and equations: biliary clearance, blood clearance, clearance, enterohepatic cycle, filtration clearance, intrinsic clearance, intrinsic metabolic clearance, intrinsic excretory clearance, hepatic clearance, renal clearance, secretion clearance, and unbound clearance.
- Calculate the extraction ratio across an eliminating organ given blood clearance and blood flow to that organ.
- Define glomerular filtration, tubular secretion, and tubular reabsorption.
- State the average values of hepatic blood flow, renal blood flow, and glomerular filtration rate.
- Ascertain from the value of its extraction ratio whether the clearance of a drug by an organ is sensitive to perfusion or cellular activity and plasma protein binding.
- Describe where filtration, secretion, and reabsorption of drugs occur within the nephron.
- Given renal clearance and plasma protein binding data, determine if a drug is predominantly reabsorbed from or secreted into the renal tubule.
- Anticipate those drugs for which a change in urine pH may alter the value of their renal clearance and the direction of the alteration.
- Anticipate those drugs for which a change in urine flow may alter the value of their renal clearance and the direction of the alteration.
- Ascertain the relative contribution of the renal and hepatic routes to total elimination from their respective clearance values.
- Describe the role that biliary secretion can play in drug disposition.
- Determine the biliary clearance of a drug from its bile-to-plasma concentration ratio and the bile flow.
- Explain the statement, “Half-life and elimination rate constant depend on clearance and volume of distribution, and not vice versa.”
- List examples of physiologic variables that may alter the primary pharmacokinetic disposition parameters: hepatic clearance, renal clearance, and volume of distribution.
- Given plasma (or blood) concentration versus time data in normal and altered states following an intravenous (i.v.) bolus dose, determine the changes that have occurred in the primary and secondary pharmacokinetic parameters and list the possible physiologic mechanism(s) involved.
- Predict and graphically demonstrate the effects of an alteration in plasma protein or tissue binding, organ perfusion, or cellular eliminating activity on the time course of drug in plasma following an i.v. bolus dose when the appropriate primary pharmacokinetic parameters of the drug are known.
 his chapter is concerned with elimination processes and particularly with the concept of clearance. In Chapter 3, Kinetics Following an Intravenous Bolus Dose, the method of quantifying clearance following a single i.v. bolus dose was presented. Here, its physiologic meaning is given. The chapter ends with integration of kinetic and physiologic concepts applied to the events following an i.v. bolus dose.
PROCESSES OF ELIMINATION
The clearance of drugs varies widely. Before answering the question as to why this is so, a few words are in order about processes of elimination and about clearance in general, with particular emphasis on relatively small drug molecules, generally less than 1200 g/mol. Larger molecules, such as polypeptides and proteins are dealt with in Chapter 21, Protein Drugs.
Elimination occurs by excretion and metabolism. Some drugs are excreted via the bile. Others, particularly volatile substances, are excreted in the breath. For most drugs, however, excretion occurs predominantly via the kidneys. Some drugs are eliminated almost entirely by urinary excretion, but these are relatively few. Rather, metabolism is the major mechanism for elimination of drugs from the body as shown in Fig. 5-1 for the top 200 prescribed drugs, and for most of these drugs, metabolism occurs predominantly in the liver. Occasionally, however, a drug is extensively metabolized in one or more other tissues, such as the kidneys, lungs, blood, and gastrointestinal wall.
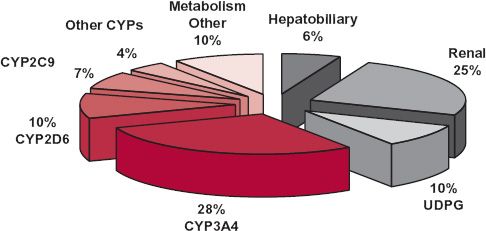
FIGURE 5-1. Relative importance of route and mechanism of elimination of the top 200 prescribed drugs. The segments of the pie in color refer to phase I metabolic reactions. The remaining segments refer to either phase II conjugative reactions or excretory processes within the liver and kidney. (From: Williams JA, Hyland R, Jones BC, et al. Drug-drug interactions for the UDP-glucuronsyltransferase substrates: a pharmacokinetic explanation for typically observed low exposure [AUCi/AUC] ratios. Drug Metab Dispos 2004;32:1201–1208.)
The most common metabolic reactions are oxidation, reduction, hydrolysis, and conjugation. Conjugation reactions include glucuronidation (conjugation with glucuronic acid), sulfation, and acetylation. Frequently, a drug simultaneously undergoes metabolism by several competing (primary) pathways. The fraction going to each metabolite depends on the relative rates of each of the parallel pathways. Metabolites may undergo further (secondary) metabolism. For example, oxidation, reduction, and hydrolysis are often followed by a conjugation reaction. These reactions occur in series or are said to be sequential. Because they often occur first, oxidation, reduction, and hydrolysis are commonly referred to as phase I reactions, and conjugations as phase II reactions. Some drugs, however, only undergo primary elimination via phase II reactions.
Table 5-1 illustrates patterns of biotransformation (metabolism) of representative drugs. The pathways of metabolism are classified by chemical alteration. Several of the transformations occur in the endoplasmic reticulum of cells of the liver and certain other tissues; others occur in the cytosol or on the surface of the hepatocyte. On homogenizing these tissues, the endoplasmic reticulum of cells is disrupted with the formation of small vesicles called microsomes. For this reason, metabolizing enzymes of the endoplasmic reticulum are called microsomal enzymes. Drug metabolism, therefore, may be classified as microsomal and nonmicrosomal.
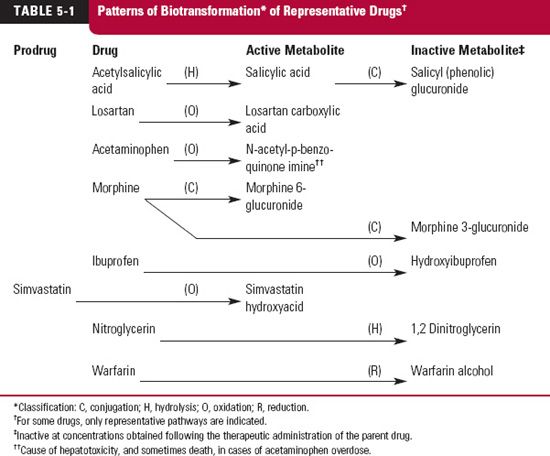
The major enzymes responsible for the oxidation and reduction of many drugs belong to the superfamily of cytochrome P450 enzymes. This superfamily, which comprises many enzymes, is divided in humans into three major distinct families, designated CY(cytochrome) P(450)1, 2, and 3, each further divided into subfamilies, A through E. Arabic numerals are used to refer to individual enzymes (gene products) within each subfamily. The enzymes of this family display a relatively high degree of structural specificity; a drug is often a good substrate for one enzyme but not another. Figure 5-2 displays the major P450 enzymes by abundance and by relevance to drug metabolism. The most abundant, CYP3A, metabolizes many drugs of relatively diverse structure and size and, unlike many of the other P450 enzymes, is found in the intestinal wall as well as in the liver. The abundance of a particular cytochrome in the liver does not necessarily reflect its importance to drug metabolism. For example, although comprising only approximately 2% of the total CYP content, CYP2D6 is involved to the overall extent of 25% of the clearance of prescribed drugs, and particularly basic ones. Many acidic drugs are metabolized preferentially by CYP2C9 and CYP2C19. Examples of substrates for various CYP enzymes are shown in Fig. 5-3. There is also a superfamily of UDP-glucuronosyltransferases (UGTs), responsible for formation of glucuronides of some drugs and many of their metabolites. Glucuronidation is the major pathway of elimination of some drugs and endogenous compounds, such as irinotecan, estradiol, etoposide, and bilirubin, which are primarily substrates of UGT1A1, and zidovudine, which is a substrate of UGT2B7.
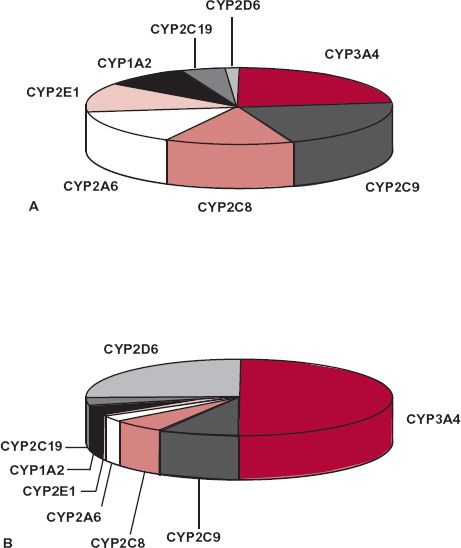
FIGURE 5-2. A. Relative abundance of the major hepatic P450 cytochromes in human liver. B. Relative contribution of the major hepatic P450 cytochromes in the P450-mediated clearance of 403 marketed drugs in the United States and Europe. (From: Clarke SE, Jones BC. Hepatic cytochromes P450 and their role in metabolism-based drug-drug interactions. In: Rodriguez AD, ed. Drug-drug Interaction. New York: Marcel Dekker, 2002:55–88.)
The consequences of drug metabolism are manifold. Biotransformation provides a mechanism for ridding the body of undesirable foreign compounds and drugs; it also provides a means of producing active compounds. Numerous examples are now recognized in which the administered drug is really an inactive prodrug, which is converted into a pharmacologically active species. Sometimes, one or more metabolites have a pharmacologic profile similar to the parent drug; others have a different profile, and some are responsible for adverse effects. The duration and intensity of the responses to a drug relate to the time courses of all active substances in the body. The pharmacokinetics of active metabolites, as well as that of the compound administered, is therefore of therapeutic concern. The kinetics of metabolites after drug administration is presented in Chapter 20, Metabolites and Drug Response. The administered drug and its elimination processes are emphasized in all subsequent chapters through Chapter 19, Distribution Kinetics.
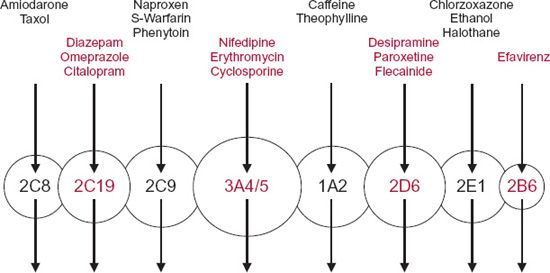
FIGURE 5-3. Graphic representation of the different forms of human cytochrome-P450 enzyme (circles) with different but often overlapping substrate specificities. The arrows indicate the single metabolic pathways. Representative substrates are listed above each enzyme.
CLEARANCE IN GENERAL
Of the concepts in pharmacokinetics, clearance has the greatest potential for clinical applications. It is also the most useful parameter for the evaluation of an elimination mechanism.
Recall from Chapter 3, Kinetics Following an Intravenous Bolus Dose, clearance is defined as the proportionality factor that relates rate of drug elimination to the plasma (drug) concentration. That is,
Rate of elimination = CL · C 5-1
Alternatively, clearance may be viewed from the loss of drug across an organ of elimination. This approach has several advantages, particularly, in predicting and in evaluating the effects of changes in blood flow, plasma protein binding, enzyme activity, or secretory activity on the elimination of a drug, as will be seen. Figure 5-4 summarizes the various ways of viewing mass balance across an eliminating organ. In this scheme, drug in the eliminating organ is assumed to have reached distribution equilibrium; thus, the sole reason for any difference between the arterial and venous concentrations is elimination. For all but the earliest moments, this assumption is reasonable for the kidneys and the liver, which are among the most highly perfused and hence most rapidly equilibrating organs in the body.
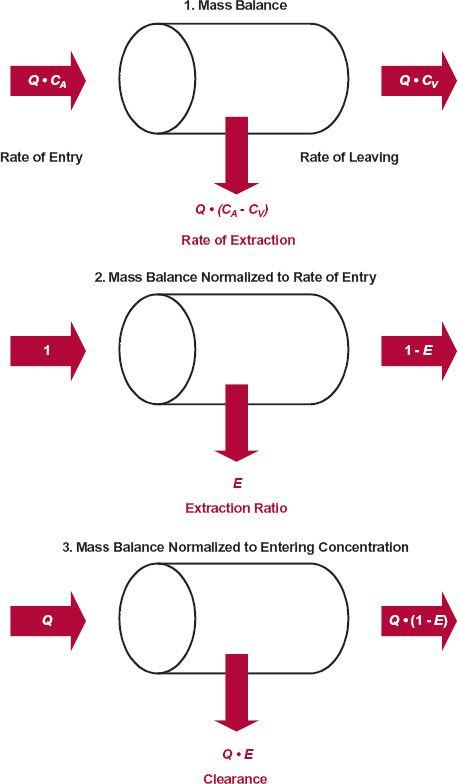
FIGURE 5-4. The extraction of a drug by an eliminating organ under steady-state conditions may be considered from the fundamental concepts of mass balance. 1. The extraction of drug may be accounted for from its rates in and out of the organ. 2. Normalizing to the rate of entry provides a means of determining the fraction extracted, the extraction ratio, E. 3. Normalizing to the entering concentration allows one to account for the drug in terms of blood clearance, CLb, and blood flow, Q. CA and CV are the blood concentrations entering and leaving the organ, respectively.
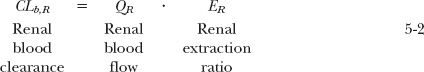
Before proceeding further, however, a point of distinction needs to be made between these two ways of viewing clearance. In the first, clearance is simply a proportionality term. The second is derived from mass–balance considerations, by relating the rate of extraction to the rate of presentation to the eliminating organ. In the reservoir model used in Chapter 3, Kinetics Following an Intravenous Bolus Dose, to introduce this concept, the fluid perfusing the eliminating organ (the extractor) is water, containing drug (see Fig. 3-3). In vivo, the fluid presented to the liver and kidneys is whole blood, and the rate of presentation of drug to the kidneys, for example, is QR · CA, where QR and CA are renal blood flow and the concentration in the arterial blood perfusing the kidneys, respectively. So, when the extraction ratio, ER, approaches one, everything in the incoming blood (both in the blood cells and plasma) is cleared of drug, not just that in plasma. For this reason, when calculating organ extraction ratio, it is important to relate renal blood clearance (CLb) to renal blood flow and not plasma clearance to plasma flow. For the kidneys then,
And for the liver,
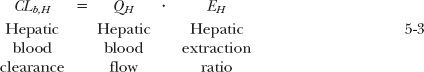
From these relationships, it is apparent that blood clearance cannot be of any value. If the extraction ratio approaches 1.0, then blood clearance approaches a maximum, organ blood flow. For the kidneys and liver, the average blood flows in an adult are 1.1 and 1.35 L/min (Table 4-4), respectively.
Before considering clearance of drug by specific organs, several comments are in order.
DESCRIPTION OF CLEARANCE BY ORGAN, PROCESS, OR SITE OF MEASUREMENT
Clearance can be described in terms of the eliminating organ (e.g., hepatic clearance, renal clearance, or pulmonary clearance). It can also be described by the difference between renal excretion and elimination by all other processes (e.g., renal clearance and extrarenal clearance). How an organ clears the blood of drug may also be described by the nature of the elimination process (e.g., metabolic clearance or excretory clearance). Furthermore, the clearance value depends on the reference fluid. Thus, to be specific, the clearance of a drug eliminated (e.g., by metabolism in the liver), using plasma concentration measurements would then be hepatic metabolic plasma clearance. Similarly, “clearance by excretion of drug in the kidneys” would be renal excretory plasma clearance. In practice, the term plasma is dropped, because plasma is the common site of measurement. In addition, one often drops metabolic or excretory when describing clearance by the liver and kidneys, respectively, because these processes generally occur in these respective organs. However, metabolism does occur in the kidneys, and excretion (into bile) does occur in the liver. Therefore, the assumptions underlying the clearance nomenclature for a specific drug should always be questioned.
PLASMA VERSUS BLOOD CLEARANCE
Because plasma is the most commonly measured fluid, plasma clearance is much more frequently reported than blood clearance. For many applications in pharmacokinetics, all that is needed is a proportionality term, in which case it matters little which clearance value for a drug is used. As seen above, the exception is if one wishes to estimate extraction ratio, then, one needs to convert plasma clearance to blood clearance. This conversion is readily accomplished by experimentally determining the plasma-to-blood concentration ratio (C/Cb), most often by preparing a known concentration in whole blood, centrifuging, and determining the resulting concentration in the plasma. This ratio generally ranges from 0.3 to 2, although it can be very much lower for drugs that associate extensively with blood cells. This concentration ratio is a function of the hematocrit and of the binding of drug to both plasma proteins and blood cell components. The relationship is derived in Appendix D, Plasma-to-Blood Concentration Ratio. When binding to blood cells is extensive, the plasma-to-blood ratio may be much less than 1.0 with the lower limit approaching zero. In contrast, strong binding to plasma proteins produces a ratio greater than 1.0 (1/[1 – hematocrit]), with an upper limit close to 2 when drug is restricted to plasma. Some relatively polar drugs, such as antibiotics, do not partition onto, or enter, blood cells and for these, likewise, drug is restricted to plasma.
Because, by definition, the product of clearance and concentration is equal to the rate of elimination, which is independent of what fluid is measured, it follows that:
Rate of elimination = CL · C · CLb · Cb = CLu · Cu 5-4
where CLu is the unbound clearance, that is, the clearance with reference to unbound drug in plasma water, which therapeutically is the important concentration driving response.
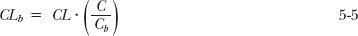
Equation 5-4 allows one to calculate one clearance from another, given the appropriate ratio. For example, blood clearance, CLb, is given by
Similarly, unbound clearance is given by
For example, if the plasma clearance of a drug, by default simply called clearance, is 1.3 L/min and the drug is extensively eliminated by hepatic metabolism, there is a potential danger in believing that it has a high extraction ratio. However, knowing that the plasma-to-blood concentration ratio is 0.1 indicates that blood clearance is only 0.13 L/min, much lower than hepatic blood flow, 1.35 L/min. Hence, this drug is one of low-extraction ratio, and clinically, the implications are very different, as discussed below.
ADDITIVITY OF CLEARANCE
The clearance of a drug by one organ adds to the clearance by another. This is a consequence of the anatomy of the circulatory system. Consider, for example, a drug that is eliminated by both renal excretion and hepatic metabolism. Then

Dividing the rate of removal associated with each process by the incoming drug concentration (blood or plasma), which for both organs is the same (C), gives the clearance associated with that process:
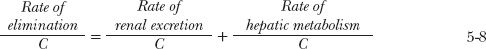
Analogous to total clearance, renal clearance (CLR) is defined as the proportionality term between urinary excretion rate of unchanged drug and plasma concentration.
Similarly, hepatic clearance (CLH) is the proportionality term between rate of hepatic metabolism and plasma concentration. Therefore,
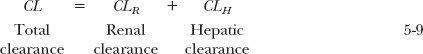
Recall from Chapter 3, Kinetics Following an Intravenous Bolus Dose, that total clearance is determined from the total exposure (AUC) following an i.v. dose (see Eq. 3-21) and that renal clearance can be determined from the fraction excreted unchanged and total clearance (see Eq. 3-34). In contrast, rate and extent of metabolism can rarely be measured directly, but by taking advantage of the additivity of clearance, hepatic clearance is readily estimated as the difference between total and renal clearance, that is, CLH = (1 – fe) · CL.
One exception to the simple additivity of clearance is pulmonary clearance. This is caused in part by the blood supply to the lungs being in series, rather than in parallel, with other organs of elimination and in part to the total cardiac output passing through the lungs before reaching the site of measurement, usually blood in a peripheral vein. The concentration measured in the systemic circulation reflects that leaving, rather than entering, the lungs. The use of this concentration to calculate clearance is inconsistent with its definition. If the pulmonary extraction ratio is high, clearance values calculated in the usual manner may even exceed cardiac output, making interpretation problematic.
Clearances of drugs by the liver and the kidneys are now examined. Each organ has special anatomic and physiologic features that require its separate consideration.
HEPATIC CLEARANCE
As with other organs of elimination, the removal of drug by the liver may be considered from mass–balance relationships, as shown in Eq. 5-3. For the liver, QH is the sum of two blood flows, the hepatic portal venous flow, draining the gastrointestinal tract, and the hepatic arterial blood flow, with average values of 1050 and 300 mL/min, respectively. Also, elimination can be by metabolism, secretion into the bile, or both.
PERFUSION, PROTEIN BINDING, AND HEPATOCELLULAR ACTIVITY
The following principles, relating changes in clearance and extraction ratio to alterations in perfusion, plasma protein binding, or inherent elimination characteristics, apply in general to all organs of elimination.
The clearances of drugs vary widely owing to differences in organ perfusion, plasma protein binding, and inherent elimination characteristics within cells, involving metabolism and secretion. Changes in perfusion can occur in disease and during exercise. One drug can compete for the binding sites of another, thereby increasing the fraction unbound of the affected drug. The cellular activity, controlling the elimination processes, is sometimes affected by disease and by other drugs taken by a patient. Although the following principles, relating changes in clearance and extraction ratio, are exemplified here with hepatic extraction, they apply in general to all organs of elimination.
The functional anatomical unit of the liver is the acinus. The most abundant cell type comprising the acinus is the hepatocyte, where most drug elimination occurs. Another cell type, the Kupffer cell, which is part of the reticuloendothelial scavenger system, appears to be primarily involved in removing large protein drugs. Cells in the acinus are arranged broadly into three zones. Cells in zone 1 are closest to incoming arterioles and venules and are the first to receive drugs and nutrients from the incoming blood. Cells in zone 3, which appear to be richer in CYP450 and hydrolytic enzymes, are farthest from the distributing vessels and closest to the vessels draining the central vein and bile cannaliculae. Cells in zone 2 have functional and morphological characteristics intermediate between those of zones 1 and 3. The capillaries of the liver are termed sinusoids, comprising a discontinuous layer of fenestrated endothelial cells. The fenestrae (or windows) are about 100 nm in diameter, allowing ready exchange of materials, even as large as albumin, between the plasma in the sinusoids and the interstitial fluid, within the space of Disse, bathing the hepatocytes.
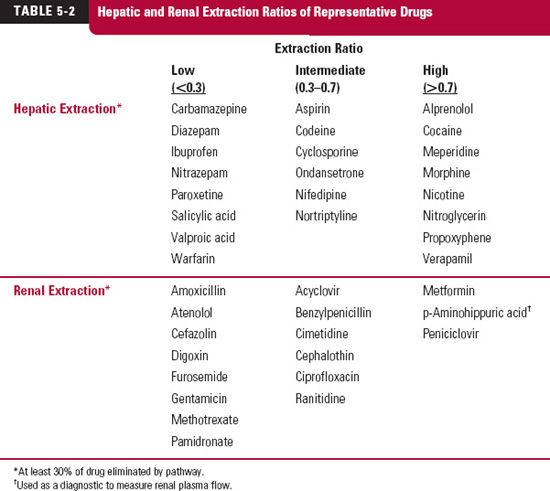
At least six processes, as shown in Fig. 5-5, may affect the ability of the liver to extract and eliminate drug from blood. In addition to perfusion, there is binding within the perfusing blood, to cells and proteins, and permeation or transport of unbound drug into the cell, where subsequent elimination occurs, via metabolism or secretion into the bile, or both. The scheme in Fig. 5-5 would appear to be such a complex interplay of processes as to preclude any ready conclusion about how any one of these factors may influence clearance. Fortunately, the task becomes relatively simple by dividing drugs into whether they are of high (EH>0.7), low (EH<03), or intermediate extraction within the liver, as has been done for representative drugs eliminated primarily by either hepatic or renal routes in Table 5-2. However, before addressing the specific issues of perfusion and protein binding, we need to bring forward the concept of intrinsic clearance.
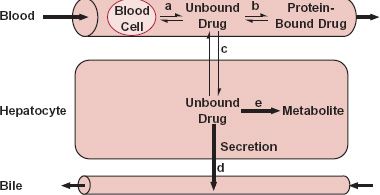
FIGURE 5-5. Drug in blood is bound to blood cells (process a) and to plasma proteins (process b); however, it is the unbound drug that permeates (process c) into the hepatocyte. Within the hepatocyte, unbound drug is subjected to secretion into bile (process d) or to metabolism (process e). The formed metabolite leaves the hepatocyte via blood or bile, or is subjected to further metabolism. Any one of these five processes, or perfusion, can be the slowest, or rate-limiting, step in the overall process of drug elimination within the liver. Formed metabolite can be either further metabolized, returned to blood, or secreted into bile.
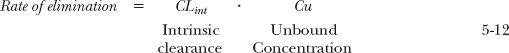
Intrinsic Clearance. Although clearance is measured from observations in plasma or blood, elimination only occurs because a drug is a substrate for one or more of the eliminating mechanisms within the cell. In all cases, the externally observed rate of elimination is therefore a measure of, and indeed, equal to the rate of elimination occurring within the cell. This rate is dependent on the intracellular unbound concentration, CuH, to which the metabolic enzymes and excretory transporters are exposed. Because, by definition, clearance is simply the proportionality constant between rate of elimination and concentration, it therefore follows that
Rate of elimination = CL · C= CLint · CuH 5-10
where CLint is the intrinsic clearance of the drug, so called because it is a measure of the intrinsic hepatocellular eliminating activity, separated from other external factors, such as blood flow and plasma protein binding. Many drugs are substrates for more than one enzyme or eliminating transporter, so that analogous to the partitioning of hepatic clearance into hepatic metabolic and excretory (biliary) clearances, hepatic intrinsic clearance
is equal to the sum of the intrinsic metabolic (CLint,m) and excretory (CLint,ex) clearances associated with each of the primary processes. That is,

where the symbol Σ denotes summation.
Perfusion. When the hepatic extraction ratio of a drug approaches 1.0 (EH>0.7), its hepatic blood clearance approaches hepatic blood flow. The drug must clearly have had sufficient time on its passage through the liver to partition out of the blood cells, dissociate from the plasma proteins, pass through the hepatic membranes, and be either metabolized by an enzyme or transported into the bile, or both. To maintain the sink conditions necessary to promote the continuous entry of more drug into the cell to be eliminated, as depicted in Fig. 5-6A, drug must obviously have a high hepatocellular uptake permeability and be an excellent substrate for the elimination processes within the hepatic cells. In this condition, with blood clearance approaching its maximum value, hepatic blood flow, elimination becomes rate-limited by perfusion and not by the speed of any of the other processes depicted in Fig. 5-5. Clearance is then sensitive to changes in blood flow but relatively insensitive to changes in, for example, plasma protein binding or hepatocellular eliminating activity. Furthermore, for a given systemic concentration, changes in blood flow are expected to produce corresponding changes in rate of elimination, but the extraction ratio is virtually unaffected.
In contrast to high extraction, elimination of a drug with a low extraction ratio (approaching zero) must be rate-limited somewhere else in the overall scheme other than perfusion (see Fig. 5-5). The most common reason is that the drug is a poor substrate for the elimination process, usually metabolism. Occasionally, for polar drugs of insufficient lipophilicity to permeate readily into the cell, elimination is rate-limited by membrane permeability. Whatever the cause of the limitation, drug concentration in arterial and venous blood, entering and leaving the liver, are virtually identical when the extraction ratio is low (Fig. 5-6B). Therefore, changes in blood flow should produce virtually no change in the drug concentration within the organ, in rate of elimination, or by definition in clearance. From Eq. 5-3, however, it is seen that the hepatic extraction ratio varies inversely with blood flow when clearance is constant. These expectations regarding per-fusion for drugs of high and low extraction ratios are illustrated in Fig. 5-7.
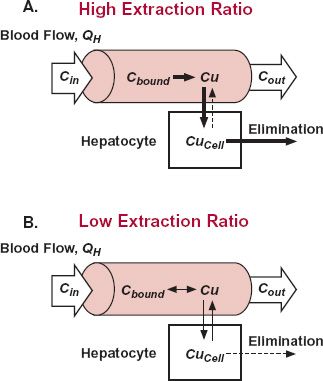
FIGURE 5-6. A,B. Exchange of drug between plasma and hepatocyte and its removal from this cell involves unbound drug (Cu). When the extraction is high (EH >0.7), Case A, essentially all the drug is removed from blood on entering the liver (entering concentration, Cin), whether bound to blood cells or plasma proteins. Clearance is then rate-limited by perfusion. In contrast, when the extraction ratio is low (EH <0.3), Case B, little drug is removed (exiting concentration, Cout, approaches Cin), and any one of the many processes (other than perfusion) can rate limit drug elimination. Generally, it is because the drug is a poor substrate for the hepatic enzymes or biliary transporters. Occasionally, it is cell membrane permeability. Clearance is then governed by hepatocellular activity and fraction unbound in plasma. Arrows denote mass flow of drug; the thicker the arrow the greater the speed of mass transfer occurring via the associated process.
A word of caution is needed here. Although mass–balance principles state that changes in blood flow are not expected to alter the clearance of drugs of low extraction ratio, there are physiologic mechanisms that may secondarily produce such an effect. Examples are the presence of homeostatic control mechanisms and a perfusion-limited supply of cofactors such as oxygen or sulfate needed in the metabolism of a drug.
Plasma Protein Binding. For a drug with a high extraction ratio, the liver is clearly capable of removing all the drug presented to it in spite of binding to blood cells and to plasma proteins. Rate of elimination then depends on total concentration in blood. Certainly, a decrease in binding aids in removing a drug; but in this case, it is essentially all removed anyway. Therefore, neither extraction ratio nor clearance is materially affected by changes in binding, and certainly not within the normally less than threefold range in fraction unbound seen for a drug in clinical practice.
For a drug with a low extraction ratio, clearance depends on plasma protein binding because only unbound drug penetrates membranes and is available for elimination and because the drop in drug concentration across the liver is small. The unbound concentration in plasma leaving the liver is almost identical to that entering the liver, Cu. The unbound concentration throughout the blood vessels within the liver therefore is then virtually the same, and again equal to Cu. And, as equilibrium is reached when the unbound concentrations within and outside the cell are equal for drugs able to readily permeate the hepatocyte, it follows that unbound concentration in the cell, CuH, equals Cu.
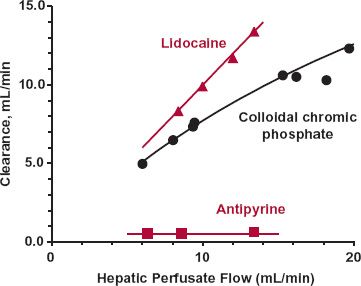
FIGURE 5-7. Composite data showing that the sensitivity of the clearance of a compound to changes in blood flow varies. When extraction ratio is low, as occurs with antipyrine, clearance is low and independent of blood flow. Clearance varies in direct proportion to flow rate for lidocaine, a drug with an extraction ratio close to 1.0. Between these extremes is colloidal chromic phosphate, the clearance of which moves away from a perfusion-rate limitation at higher flows. All data, obtained in an isolated, perfused rat liver, have been normalized to a 10-g liver. The lines are drawn by eye. (From: Antipyrine and lidocaine: Pang KS, Rowland M. Hepatic clearance of drugs. II. Experimental evidence for the acceptance of the “well-stirred” model over the “parallel tube” model using lidocaine in the perfused rat liver in situ preparation. J Pharmacokinet Biopharm 1977;5:655–680; Colloidal chromic phosphate: Brauer RW, Leong GF, McElroy RF Jr, Holloway RJ: Circulatory pathways in the rat liver as revealed by 32P chromic phosphate colloid uptake in the isolated, perfused liver preparation. Am J Physiol 1956;184:593–598.)
Then, the rate of drug elimination in the liver is directly related to the concentration of drug unbound in the incoming, systemically delivered plasma. Accordingly, substituting Cu for CuH in Eq. 5-10, yields
Expressing the rate of hepatic elimination relative to the plasma concentration, it is apparent, therefore, that the hepatic plasma clearance varies in direct proportion with changes in the fraction unbound in plasma.
For example, if fu varies twofold, so does hepatic clearance; intrinsic clearance remains unchanged.
Notice from the equalities of Eqs. 5-4 and 5-13 that when the extraction ratio is low, CLu ≈ CLint. However, this is clearly not the case when extraction ratio is high. For example, if clearance of a drug approaches blood flow, then by substitution into Eq. 5-6 CLu = QH/fu. Hence, CLu varies reciprocally with fu, a parameter quite independent of CLint.
The data in Fig. 5-8 obtained in the isolated perfused liver illustrate the points made above. In this system, protein binding can be readily altered by changing the concentration of the binding protein in the blood perfusing the liver, and perfusion can be held constant. Consider first tolbutamide, a drug of low extraction even in the absence of binding (fu = 1.0). As expected, the extraction ratio (and clearance) of tolbutamide is directly proportional to fu.
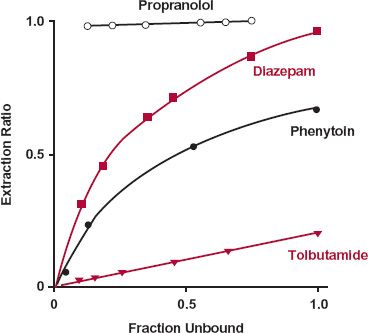
FIGURE 5-8. Composite mean data, obtained in an isolated, perfused rat liver, showing that the sensitivity of hepatic extraction ratio to changes in fraction of drug unbound varies. Extraction ratio is proportional to fraction unbound only when the extraction ratio is low, as observed over the entire range of binding for tolbutamide but only over a limited range for diazepam and phenytoin. When the extraction ratio is high, as occurs with phenytoin and diazepam at low binding (fu >0.5) and with propranolol at all degrees of binding studied, extraction ratio is relatively insensitive to changes in fraction unbound. Notice that in this preparation, in which the fraction unbound is varied over a wide range by modifying the concentration of albumin, the binding protein, a drug such as diazepam can be changed from one of high to one of low extraction. The solid lines are drawn by eye. (From: Phenytoin: Shand DG, Cotham RH, Wilkinson GR. Perfusion-limited effects of plasma drug binding on hepatic extraction. Life Sci 1976;19:125–130; Diazepam: Rowland M, Leitch D, Fleming G, Smith B. Protein binding and hepatic clearance: discrimination between models of hepatic clearance with diazepam, a drug of high intrinsic clearance, in the isolated, perfused rat liver preparation. J Pharmacokinet Biopharm 1984;12:129–147; Tolbutamide: Schary WL, Rowland M. Protein binding and hepatic clearance: studies with tolbutamide, a drug of low intrinsic clearance, in the isolated, perfused rat liver preparation. J Pharmacokinet Biopharm 1983;11:225–243; Propranolol: Jones DB, Ching MS, Smallwood RA, Morgan DJ. A carrier-protein receptor is not a prerequisite for avid hepatic elimination of highly bound compounds: a study of propranolol elimination by the isolated, perfused rat liver. Hepatology 1985;5:590–593.)
The observations with diazepam are illuminating. The extraction ratio (and clearance) changes from a value close to 1.0 (in the absence of binding, fu = 1.0) to one close to zero on decreasing the fraction unbound (increasing the extent of binding). Clearly, protein binding can limit extraction if binding is high enough. However, this situation is nonphysiologic in that the fraction unbound is varied between 1.0 and 0.05, a 20-fold change. In practice, a threefold change in fu would be considered particularly large for a drug bound to albumin, although larger changes are seen for drugs bound to other plasma proteins, such as α1-acid glycoprotein. Under these more restricted conditions, the expected relationship between clearance and fu holds. Thus, for diazepam, in the region where extraction ratio is low (low fu), clearance is directly proportional to fu. At the other extreme, in the region where the extraction ratio is high, clearance varies little with a moderate change in fu. Finally, for the even more highly extracted drug propranolol, changes in binding produce no perceptible change in clearance, or extraction ratio, over a very wide range of fu values.
Hepatocellular Eliminating Activity. The influence of changing the activity of the elimination process within the liver cell may perhaps be most easily visualized by examining Fig. 5-9, which shows changes in extraction ratio and clearance as a function of hepa-tocellular (intrinsic) activity. When EH is low, because the limitation is intrinsic activity, any change in this activity (e.g., caused by induction or inhibition by another drug) is directly reflected by a change in the extraction ratio, and hence, clearance. Equation 5-13 then applies. In contrast, when eliminating activity is very high, both EH and clearance approach their limiting values, of one and blood flow, respectively. Then, both parameters are relatively insensitive to even large changes in eliminating activity.
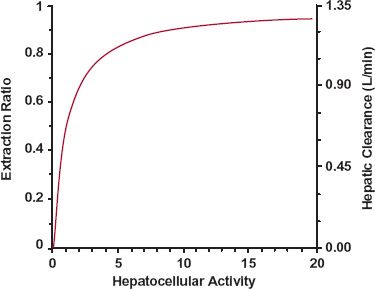
FIGURE 5-9. Relationship between hepatocellular (intrinsic) activity, hepatic extraction ratio and hepatic clearance, for an assumed hepatic blood flow of 1.35 L/min expected based on the well-stirred model. When hepatocellular activity is low, extraction ratio and clearance increase in almost direct proportion to hepatocellular activity. However, as hepatocellular activity increases, extraction ratio approaches the limiting value of 1, and clearance approaches the limiting value of hepatic blood flow. In this upper limiting region, large changes in hepatocellular activity produce minimal changes in clearance. Hepatocellular activity is the parameter that relates rate of hepatic elimination to the unbound concentration in the hepatocyte.
Finally, there are some drugs that have intermediate extraction ratios, such as codeine and nortriptyline (see Table 5-2). The clearance of these compounds is sensitive to all the above-mentioned factors, but not to the same extent as expected at the extremes of extraction ratio.
A MEMORY AID
The general principles just discussed can be difficult to remember. Models of hepatic elimination have been developed to quantify changes in clearance when perfusion, plasma protein binding, and enzyme activity are altered. One of these models, the well-stirred model, in which instantaneous and complete mixing is assumed to occur within the liver, is particularly attractive because it can readily be used to summarize these principles (see Appendix E, Well-Stirred Model of Hepatic Clearance). Even though it may not be quantitatively accurate, the model allows one to predict those situations in which either clearance or extraction ratio is affected and the expected direction of change. It is used, for example, to generate the curve in Fig. 5-9.
The well-stirred model states that

where QH is the hepatic blood flow; CLint is the intrinsic clearance, and fub is the ratio of unbound concentration in plasma (Cu) to whole blood (Cb) concentration. The term fub can readily be estimated from fu if the ratio C/Cb is known, as Cu = fu · C = fub · Cb; then fub = fu × plasma/blood concentration ratio. From Eq. 5-14, it follows that the hepatic extraction ratio is
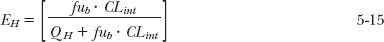
These last two equations have the desired properties at the limits. When EH approaches 1.0 (the perfusion rate-limited elimination case), a condition that arises because fub · CLint is much greater than QH, clearance approaches QH (Eq. 5-14
Stay updated, free articles. Join our Telegram channel

Full access? Get Clinical Tree


