Fig. 6.1
Hybridization of the target to the probe in DNA microarray (Source http://en.wikipedia.org/wiki/DNA_microarray)
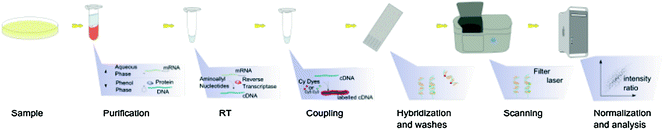
Fig. 6.2
The steps involved in a microarray experiment (Source http://en.wikipedia.org/wiki/DNA_microarray)
6.4 Types and Fabrication of DNA Microarrays
Broadly DNA arrays are classified as solid phase, beaded and electronic arrays.
6.4.1 Solid-Phase Arrays
The traditional solid-phase array is a collection of orderly microscopic spots (features); each with a specific probe and attached to a solid surface, such as glass, plastic or silicon biochip commonly known as a genome chip, DNA chip, or gene array. Thousands of such features can be placed on known locations on a single DNA microarray chip (http://en.wikipedia.org/wiki/DNA_microarray). On the basis of information used for the probes the solid phase DNA microarrays can be of two types, Printed microarrays (oligonucleotide based microarrays) and GeneChips (in situ synthesized oligonucleotide microarrays).
6.4.1.1 Oligonucleotide-Based Printed Microarrays
The first DNA arrays used for research work were oligonucleotide-based printed microarrays. These microarrays require either PCR amplified (ds-DNA) or synthesized oligonucleotides (ss-DNA) of known gene sequences as probes. In these microarrays, glass slides are used as solid surface for spotting or printing of the probes. Cheung et al. (1999) observed that glass slides are not only observed to be stable during the varied experimental situations but also produce least background noise during hybridization, thus yielding clearer images. Probes can be printed in two ways by contact printing or by noncontact printing. Whichever the method of printing is used in both the cases an array of 100–150 μm features is created by applying few nanolitres of probe solution per spot. Contact printing means direct application of probe solution on the solid surface with the help of print pins, whereas in noncontact printing a small droplets of probe solution is placed on the solid surface by the print head. Printing is done precisely so as to avoid mixing of adjacent features. In comparison to GeneChip and high density bead arrays, oligonucleotide-based printed arrays have low density of probes ranging from 10,000 to 30,000 features per array due to the relatively large size of the features in it but has more features than suspension bead arrays and electronic microarrays.
When dsDNA is used as probes, it is required to denature them either at the time of printing or after spotting on the solid surface so that they become available for the hybridization (Tomiuk and Hofmann 2001). For getting the probes attached on the glass surface, two methods are used, first, either slides are applied with a positively charged coating that allows the electrostatic interaction with the negative charge of the phosphate backbone of the DNA (Ehrenreich 2006) and second, by UV-cross-linking of amine groups present on treated slides with the covalent bonds present between the thymidine bases in the DNA (Cheung et al. 1999). Each dsDNA probe used in these arrays represents a different gene and is usually 200–800 bp long. These probes should have high specificity and should be free from contaminants so that there is no interference while hybridization. Generally, these probes have a high sensitivity but they suffer in specificity and might be contaminated with nonspecific amplicons (Hager 2006). To select for the probe specificity, amplicons can be tested by sequencing or agarose gel electrophoresis and specificity of the hybridization data can be improved by including multiple gene segments among the probes so as to workout the redundancy. At times decreased specificity is advantageous when the genomic sequence under analysis has high natural polymorphism, although it does not help when we have to differentiate among highly similar target sequences, therefore they are not useful as far as the clinical diagnostics is concerned. At the same time, use of longer probes results in higher melting temperatures and mismatch tolerance that decreases the specificity of the probes due to random hybridization to nontarget sequences, hence for any microarray experiment probe length should be chosen carefully.
In oligonucleotide microarrays with ssDNA probes, probes are chemically synthesized short sequences usually ranging from 25–80 bp in length, in contrast to gene expression microarrays where they may be up to a length of 150 bp (Chou et al. 2004). In these microarrays due to the shorter length of probes, fewer errors are observed during probe synthesis and they help in studies focusing small genomic regions like polymorphisms. Another benefit due to the small probe length is increased specificity while targeting specific genomic regions although it reduces the sensitivity of detections. It is observed that the sensitivity and the strength of hybridization signal increases with the length of the probe used. In case of very short oligonucleotides, addition of spacers or application of a higher concentration of probe during printing improves the strength of hybridization signal (Chou et al. 2004). Ramdas et al. (2004) observed eightfold increase in sensitivity when 70 mer oligonucleotides were used as probes as compared to 30 mer probes for the genes having low levels of expression. ssDNA oligonucleotide probes are easy to manufacture but care is required that all the probes on the array should have melting temperature lying within a range of 5 °C and should not have palindromic sequences. Hence, it is required to test the probes in advance so that the hybridization data generated through any experiment using ssDNA probes remain unbiased (Chou et al. 2004). Attachment of ssDNA probes to glass surface is facilitated due to covalent linkage between modified 5′ or 3′ ends having amino group with the aldehyde or epoxy functional groups coated on the slides. Oligonucleotide microarrays manufactured by Roche NimbleGen (Madison, WI) and Agilent Technologies (Palo Alto, CA) are good examples. Each NimbleGen microarray contain >106 features. The available formats are 1 × 2.1 million features, 3 × 720,000 features, 1 × 385,000 features, 4 × 72,000 features, and 12 × 135,000 features per slide. Agilent microarrays are available in the formats having 1 × 244,000 features, 2 × 105,000 features, 4 × 44,000 features, and 8 × 15,000 features per slide (Miller and Tang 2009). An oligo microarray with approximately 40,000 probes is shown in Fig. 6.3 to have an idea of how it looks after hybridization.
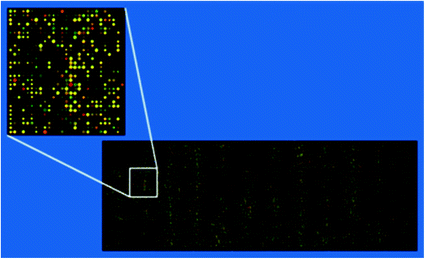
Fig. 6.3
Example of an approximately 40,000 probe spotted oligo microarray with enlarged inset to show details (Source http://en.wikipedia.org/wiki/DNA_microarray)
6.4.1.2 GeneChips (in situ Synthesized Oligonucleotide Microarrays)
GeneChips are produced by in situ synthesis of oligonucleotides directly onto quartz or glass wafers having a size of 1.2 cm2. Tens of thousands of oligonucleotides are placed on one wafer by synthesizing one nucleotide at a time. Each oligonucleotide probe on the array represents one gene. Length of the probes used in these arrays depends on the purpose for which these microarrays are designed. GeneChips designed by Agilent technology use longer probes having 60 bp lengths, whereas in Affymatrix GeneChips shorter probes having a length of 25 bp are used. Typically, GeneChips have >106 features per microarray that actually depends on the distance between the features (Weiszhausz et al. 2006).
For binding of the in situ synthesized probes to the solid surface mainly a modification of semiconductor photolithography technology is used. In this technique, quartz surface of the GeneChip is coated with synthetic linkers modified with light-sensitive protecting groups (Fodor et al. 1991). Due to this chemical protection, addition of nucleotide to the microarray surface is restricted till its deprotection by UV light. This means nucleotides modified with a photosensitive protecting group can be added to growing oligonucleotide chains by exposing the array surface to UV light. Further, photolithographic masks are used for directing the specific nucleotides to exact probe sites. Photolithographic mask has a defined pattern of windows; those selectively transmit or block the UV light for the targeted feature on the microarray surface that is chemically protected. Due to this kind of filtration, an area of the microarray surface that does not receive UV light remains protected and does not allow addition of nucleotides, whereas areas exposed to UV light gets deprotected, and specific nucleotides can be added to these sites. Likewise, the order of nucleotide addition is directed by the pattern of windows in each photolithographic mask. Therefore, in situ probe synthesis requires cycles of masking, UV exposure, and addition of nucleotide bases (either A, C, T, or G) to the growing oligonucleotide chain on the solid surface (Fig. 6.4) (Weiszhausz et al. 2006). In addition to array synthesis using photolithography mask NimbleGen Systems has developed a technique of maskless array synthesis that provides flexibility of use with large number of probes required in in situ synthesized oligonucleotide arrays to improve sensitivity, specificity, and statistical accuracy due to shorter probe lengths.
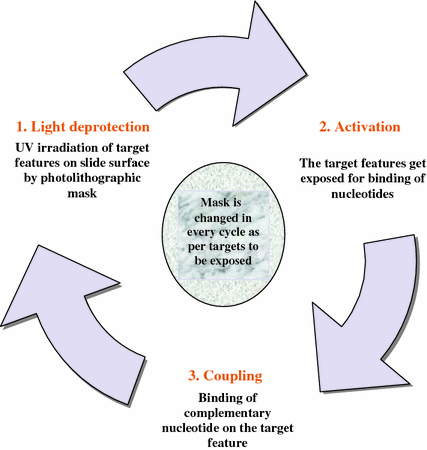
Fig. 6.4
Photolithographic production of oligonucleotide microarrays
The main advantage of GeneChips is their ability to measure the absolute expression of genes in cells or tissues. Their disadvantages are their higher costs and current inability to simultaneously compare, on the same array, the degree of expression of two related biological samples.
For expression analysis using oligonucleotide microarray hybridization (Fig. 6.5), firstly labeled RNA samples are prepared by converting extracted mRNA to double-stranded cDNA. The cDNA is then copied to antisense RNA (cRNA) by in vitro transcription reaction performed in presence of biotin-labeled ribonucleotide triphosphates (UTP or CTP). Fragmented cRNA (50–100 nucleotides) is used for hybridization. After a brief washing step to remove unhybridized cRNA, the microarrays are stained by streptavidin phycoerythrin and scanned (Aharoni and Vorst 2001).
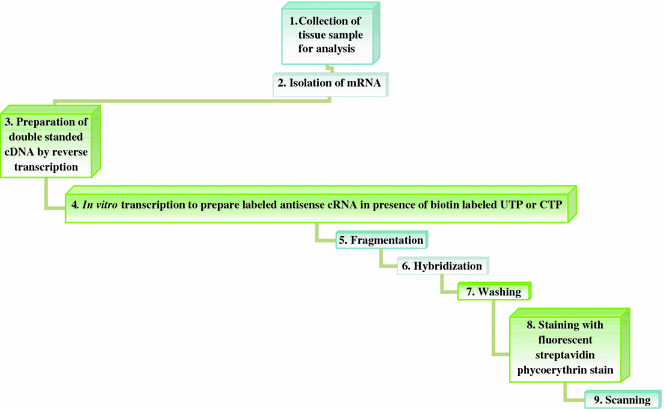
Fig. 6.5
Steps involved in expression analysis using oligonucleotide microarrays hybridization
Both types of oligonucleotide microarrays produce cleaner downstream hybridization data. Reproducibility, simpler standardization, and use of controls make these microarrays useful for clinical diagnostics. In comparison to in situ-synthesized microarrays, printed microarray seems to be relatively simple and inexpensive with flexibility to quickly adjust spotted probes on the basis of newer informations. However, in situ-synthesized microarrays are more robust due to significant control measures included in their design.
Now oligonucleotide arrays have also been developed which combine the flexibilities and qualitative advantages of synthetic probe arrays with the benefits of simultaneous analysis possible by spotted glass array. Further, custom-designed microarrays have also been made available by Nimblegen and Agilent technologies.
6.4.2 Bead Arrays
The bead array is a collection of microscopic silica/polystyrene beads, each with a specific probe and a ratio of two or more dyes, which do not interfere with the fluorescent dyes used on the target sequence. Bead arrays are mainly of two types, high density bead arrays and suspension bead arrays.
6.4.2.1 High-Density Bead Arrays
In high-density bead arrays silica beads of 3 μm size are used as solid support for application of probes. After hybridization, these beads can randomly self-assemble on the substrate. Two substrates available for this purpose are Sentrix Array Matrix (SAM) and the Sentrix BeadChip. These arrays facilitate high density detection of target nucleic acids. One of the examples is Illumina bead arrays, San Diego, CA.
The SAM contains a bundle of 96 fiber-optic cables of 1.4 mm diameter. Each bundle represents an array made up of 50,000 light-conducting fibers of 5 μm diameter; each of this fiber has a microwell for assembling a single bead (Fan et al. 2006). For example, in the Universal Bead array, up to 1,536 bead types can be accommodated. Here, every bead type represents a unique gene sequence and when they assemble on the fiber bundles 30 beads of each type becomes available for analysis in the array (Oliphant et al. 2002). Likewise, each SAM allows the analysis of 96 samples.
In Sentrix BeadChip up to 16 samples can be accommodated on a silicon slide that has microwells prepared for individual beads by microelectromechanical systems technology (Fan et al. 2005). Gunderson (2009) has found BeadChips more appropriate for very-high-density applications like whole-genome genotyping where 105–106 features are required for identifying genome-wide single nucleotide polymorphisms (SNP).
Since the beads randomly assemble on the substrate, their location is not fixed and it is required to map their position by decoding process after every single application (Gunderson et al. 2004). For the decoding purpose, each bead type is covalently attached with 700,000 copies of a unique capture sequence that acts as the identifier of the bead (Kuhn et al. 2004). For example, in Universal BeadArrays such identifier sequences are called as IllumiCodes and they are designed to specifically avoid homology with human and mouse nucleic acid sequences. The mapping of these Illumina beads requires a series of hybridization and rinse steps, so that the fluorescently labeled complementary oligonucleotides may bind to their specific bead sequence or IllumiCode and ultimately track the location of the corresponding bead type (Fan et al. 2006). This decoding process provides quality control for each feature used in the microarray (Fan et al. 2005).
It is possible to process the SAM by using a standard microtiter plate that facilitates standard automation and high-throughput processing. Similarly, individual arrays on the 16-sample BeadChip are spaced as the standard multichannel pipettor for easy handling while use. 105–106 features can be supported by Bead arrays. One advantage of bead arrays is their built-in redundancy that provides control for comparing data generated by more than one arrays. Further, due to the uniqueness of each microarray by altering the bead pattern spatial bias can be identified. The work on developing the analysis tools for bead arrays is in progress (Miller and Tang 2009). Bead arrays are found very useful in studies related to DNA methylation (Bibikova and Fan 2009), profiling of gene expressions (Bibikova et al. 2004; Fan et al. 2004; Kuhn et al. 2004), SNP detection, and in the International HapMap Project (Gunderson 2009).
6.4.2.2 Suspension Bead Arrays
In suspension bead arrays, microscopic polystyrene spheres, i.e., microspheres or beads are used as solid support for application of probes and flow cytometry technique is used for detection of bead and target attached to it. In these arrays, beads remain suspended in the hybridization solution and do not require fiber-optic cables or silicon slides to immobilize them before scanning. All the previously discussed microarrays were two-dimensional, or planar arrays whereas, suspension bead arrays are three-dimensional arrays.
These arrays were first described by Horan and Wheeless (1977) for detections involving antigen and antibodies. Further, it was made possible to detect multiple antibodies in one run by using different sized microsphere sets (Scillian et al. 1989; McHugh et al. 1998). In suspension bead arrays if 5.6 μm microspheres are filled with different concentrations of red (658 nm emission) and infrared (712 nm emission) fluorochromes, each bead in the set of 100 microspheres will have a distinct red to infrared ratio providing each bead a unique spectral address. This provision has strengthened multiple detections using suspension bead arrays. When, microspheres with a specific spectral address is coupled with a specific probe, it becomes equivalent to a feature of a two-dimensional microarray but when multiple microspheres with unique spectral addresses are combined with multiple specific probes it is possible to develop up to 100 combinations to study the target nucleic acids. Along with unique spectral address and specific probe suspension beads are also provided with a fluorescent reporter that helps in detecting hybridization of target with the probe. Here, when hybridization takes place reporter separates to emit fluorescence that can be detected by a flow cytometer. During flow cytometry, microsphere suspension is passed through two lasers, i.e., 635 and 532 nm. A 635 nm laser excites red and infrared fluorochromes and helps in detecting the unique spectral address of beads and hence the identity of probe and target can be worked out, whereas, 532 nm laser excites reporter fluorochromes such as R-phycoerythrin and Alexa 532 and helps in quantifying the amount of hybridization taken place on individual bead (Fig. 6.6).
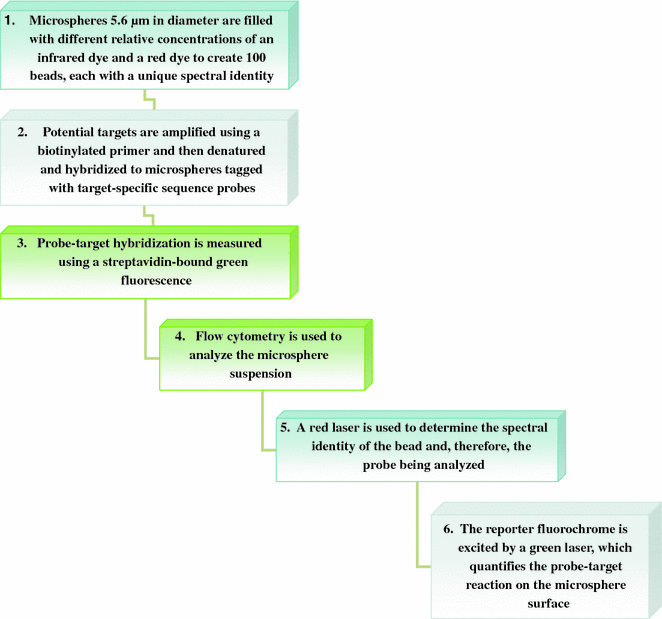
Fig. 6.6
Steps involved in microarray experiment using suspension bead array
Suspension bead arrays are used in following three ways for nucleic acid detections (Dunbar 2006):
1.
Direct DNA hybridization: In this method, PCR amplicons are directly hybridized to probes hence it is known as direct DNA hybridization. Here, a biotinylated primer is used during PCR amplification, which provides a substrate for binding of the fluorescent streptavidin-R-phycoerythrin that result into labeling of hybridized beads (Armstrong et al. 2000; Spiro et al. 2000). High fluorescence is generated due to binding of amplicon with the microspheres.
2.
Competitive DNA hybridization: In this method, unlabeled PCR amplicons are used for hybridization in combination with biotinylated competitor oligonucleotides. In absence of target DNA competitor DNA binds to the microsphere and produce high fluorescence and when target DNA is present it binds to the competitor DNA which in turn is not able to bind to the microsphere and low fluorescence is generated, which is contrasting to the direct hybridization method.
3.
Solution-based chemistries with microsphere capture: These chemistries exploit the natural properties of DNA polymerases and ligases and incorporate a capture sequence during the solution-based reactions. In these techniques, universal microspheres with nonspecific capture sequences are used. These universal capture sequences mainly include ZipCode/cZipCode, xTAG of Tm Biosciences, Luminex Molecular Diagnostics, Inc., Toronto, Canada and EraCode of EraGen, Madison, WI (Johnson et al. 2004). ZipCode/cZipCode were the first universal capture sequences those were used to detect SNP’s using SBCE (Chen et al. 2000; Iannone et al. 2000; Taylor et al. 2001; Ye et al. 2001). ZipCode sequences are basically 25 bp long random sequences of Mycobacterium tuberculosis genome (Chen et al. 2000). They are used by adding a unique ZipCode to the 5′ end of the capture probe and tagging of microspheres with its complementary sequence (cZipCode). In xTAG, only three nucleotides out of four are used to avoid nonspecific hybridization with the naturally occurring sequences. Further, they are thermodynamically matched to avoid variability in their hybridization efficiency. This technology is used in commercial assays conducted by Luminex. In EraCode, synthesized isoguanosine and 5-Me-isocytosine bases are used that are based on the expanded genetic alphabet of MultiCode technology. The isoguanosine and 5-Me-isocytosine bases pairs with each other but they do not pair with natural bases due to which EraCode sequences are highly specific. Solution-based chemistries coupled with subsequent microsphere capture include following procedures:
(a)
Allele-specific primer extension (ASPE) or target-specific primer extension (TSPE): In ASPE or TSPE a capture primer with a unique 5′ sequence followed by a target-specific sequence is used. This primer is extended by DNA polymerase if target DNA is present to provide the complementary base for the nucleotide present on 3′ end. Biotinylated deoxynucleotide triphosphate is used in ASPE and/or TSPE to achieve labeling.
(b)
Oligonucleotide ligation assays (OLA): Same as in ASPE and/or TSPE a capture primer with a unique 5′ sequence followed by a target-specific sequence is used in OLA. The difference is in the enzymatic reaction which is ligase dependent in OLA. In OLA a biotinylated probe homologous to target DNA is used in addition to the capture primer. Here, if target DNA is present in the sample, capture primer and reporter probe ligates.
(c)
Single-base-chain extension (SBCE): This procedure is used for detection of multiple SNP in one run. Here, independent reactions are required for each nucleotide query and for identifying a single SNP one probe with a unique capture sequence is used to identify the possible alleles in separate wells having a different dideoxynucleoside triphosphate in each well. Likewise, in the well in which homologous capture and target sequence is present, a biotinylated dideoxynucleoside triphosphate gets incorporated, hence the further extension gets terminated.
Despite the low feature density due to the availability of universal capture sequences, high ability of multiplexing, relative simplicity, and affordability suspension bead arrays are highly suitable for high-throughput nucleic acid detections including clinical diagnostics if due care is taken to avoid post-amplification intra- and inter-run contaminations.
6.4.3 Electronic Microarrays
Electronic microarray technology is introduced by Nanogen, San Diego, CA. In contrast to all other microarrays that depend on passive movement of complimentary sequences for hybridization, in electronic microarrays their movement is directed by applying electric field. For this purpose in microelectronic cartridges, complementary metal oxide semiconductor technology is used, e.g., NanoChip 400 of Nanogen (Sosnowski et al. 1997). Each NanoChip cartridge is provided with 12 connectors that can control 400 individual test sites. By application of positive current to one or more test sites on the microarray, nucleic acids which are basically negatively charged move towards specific sites, or features. When electronically directed biotinylated probes reaches to the target site it forms streptavidin-biotin bond with the streptavidin present on the microarray surface. Once the probes reaches to their target, positive current is removed from the active features and new test sites are activated. After the probes are attached to the features, fluorescently labeled target DNA is applied to the microarray. Target DNA can hybridize with the probe either passively or by concentrating them electronically. The most common format is the application of probe first, although amplicon may also be applied first and sometimes sandwich assays are also used. Irrespective of the format used, if hybridization takes place, presence of fluorescent reporters can be detected by scanning which is then analyzed (Fig. 6.7) (Miller and Tang 2009).
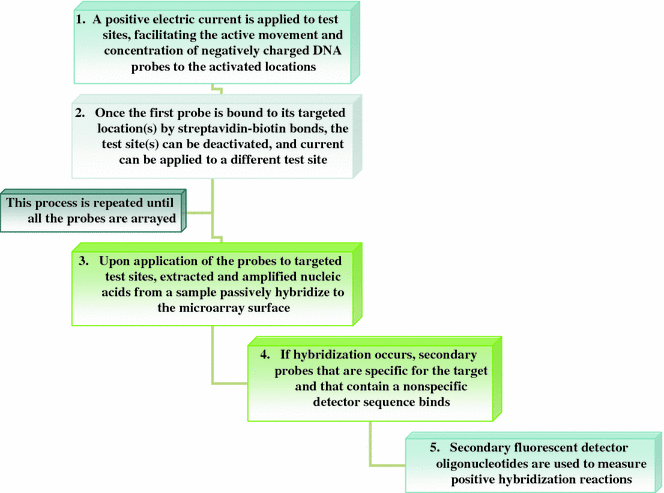
Fig. 6.7
Steps involved in detection using electronic microarray
In electronic microarrays multiplex detection can be achieved at an individual test site because multiple probes, each with a distinct fluorophore, can be sequentially directed to the same feature, e.g., Nanogen’s RVA ASR in which P1, parainfluenza virus type 1; P2, parainfluenza virus type 2; P3, parainfluenza virus type 3; FB, influenza B virus; FA, influenza A virus; RSV, respiratory syncytial virus; BKGD, background can be detected simultaneously. On these microarrays single or multiple samples can be used for hybridization to multiple test sites. Further, the commercially available electronic cartridge NanoChip is a universal blank chip, hence the features of the microarray can be directly specified by the user and therefore these microarrays are highly flexible and cost-effective. At present, electronic microarrays facilitate a density of only 400 spots which is sufficient for most of the clinical diagnostic assays.
6.5 Design of DNA Microarrays
Depending on the number of probes under examination, costs, customization requirements, and the type of scientific question to be answered microarrays can be manufactured in different ways. Arrays may have as few as 10 probes or up to 2.1 million μm-scale probes. The designing of microarrays depends on two channels (two color microarrays) or one channel of detection (one color microarray).
6.5.1 Two-Color Microarrays or Two-Channel Microarrays
Two-color microarrays or two-channels are typically hybridized with cDNA prepared from two samples to be compared (e.g., diseased tissue versus healthy tissue) and that are labeled with two different fluorophores (Shalon et al. 1996; Fig. 6.8). Fluorescent dyes commonly used for cDNA labeling include Cy3, which has a fluorescence emission wavelength of 570 nm (corresponding to the green part of the light spectrum), and Cy5 with a fluorescence emission wavelength of 670 nm (corresponding to the red part of the light spectrum). The two Cy-labeled cDNA samples are mixed and hybridized to a single microarray that is then scanned in a microarray scanner to visualize fluorescence of the two fluorophores after excitation with a laser beam of a defined wavelength. Relative intensities of each fluorophore may then be used in ratio-based analysis to identify up-regulated and down-regulated genes (Tang et al. 2007a). In situ synthesised oligonucleotide microarrays often carry control probes designed to hybridize with RNA spike-ins. The degree of hybridization between the spike-ins and the control probes is used to normalize the hybridization measurements for the target probes. Although absolute levels of gene expression may be determined in the two-color array in rare instances, the relative differences in expression among different spots within a sample and between samples is the preferred method of data analysis for the two-color system. Examples: Dual–Mode platform of Agilent, DualChip platform for colorimetric Silverquant labeling of Eppendorf, and Arrayit of TeleChem International.
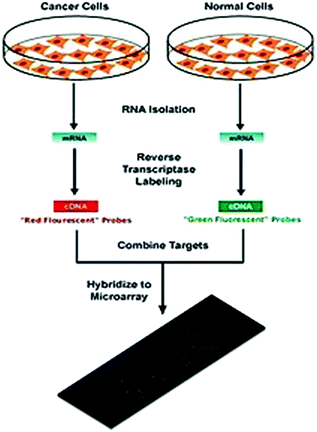
Fig. 6.8
A typical two-color microarray experiment (Source http://en.wikipedia.org/wiki/DNA_microarray)
6.5.2 Single-Channel Microarrays or One-Color Microarrays
In single-channel microarrays or one-color microarrays, the arrays provide intensity data for each probe or probe set indicating a relative level of hybridization with the labeled target. However, they do not truly indicate abundance levels of a gene but rather relative abundance when compared to other samples or conditions when processed in the same experiment. Each RNA molecule encounters protocol and batch-specific bias during amplification, labeling, and hybridization phases of the experiment making comparisons between genes for the same microarray uninformative. The comparison of two conditions for the same gene requires two separate single-dye hybridizations. Examples are Affymetrix GeneChip, Illumina BeadChip, Agilent single–channel arrays, the Applied Microarrays CodeLink arrays, and the Eppendorf DualChip and Silverquant arrays. One strength of the single-dye system is that an aberrant sample cannot affect the raw data derived from other samples, because each array chip is exposed to only one sample (as opposed to a two-color system in which a single low-quality sample may drastically impinge on overall data precision even if the other sample was of high quality). Another benefit is that data are more easily compared to arrays from different experiments so long as batch effects have been accounted for. A drawback to the one-color system is that, when compared to the two-color system, double the number of microarrays are required to compare samples within an experiment.
6.6 Basic Applications of DNA Microarrays
6.6.1 Gene Expression Profiling
DNA microarrays can be used to detect DNA (as in comparative genomic hybridization), or detect RNA (most commonly as cDNA) that may or may not be translated into proteins. The process of measuring gene expression via cDNA is called expression analysis or expression profiling. In an mRNA or gene expression profiling experiment, the expression levels of thousands of genes are simultaneously monitored to study the effects of treatments, diseases, and developmental stages on gene expression. For example, microarray-based gene expression profiling can be used to identify genes whose expression is changed in response to pathogens or other stresses as compared to healthy tissues (Adomas et al. 2008).
6.6.2 Comparative Genomic Hybridization
This is meant for assessing genome content in different cells or closely related organisms, for example, tumerogenic cells (Moran et al. 2004).
6.6.3 GeneID
These are small microarrays to check IDs of organisms in food and feed (Mascos and Southern 1992), mostly combining PCR and microarray technology. For example, genetically modified organisms, mycoplasmas in cell culture and pathogens for disease detection.
6.6.4 Chromatin Immunoprecipitation on Chip
DNA sequences bound to a particular protein can be isolated by immunoprecipitating that protein (ChIP), these fragments can be then hybridized to a microarray (such as a tiling array) to determine the protein binding site occupancy throughout the genome. For example, protein to immunoprecipitate are histone modifications (H3K27me3, H3K4me2, H3K9me3, etc.), Polycomb-group protein (PRC2:Suz12, PRC1:YY1) and trithorax-group protein (Ash1) to study the epigenetic landscape and RNA Polymerase II to study the transcription landscape.
6.6.5 DamID
Analogously to ChIP, genomic regions bound by a protein of interest can be isolated and used to probe a microarray to determine binding site occupancy. Unlike ChIP, DamID does not require antibodies but makes use of adenine methylation near the protein’s binding sites to selectively amplify those regions, introduced by expressing minute amounts of protein of interest fused to bacterial DNA adenine methyltransferase.
6.6.6 SNP Detection
SNP detection is for identifying single nucleotide polymorphism among alleles within or between populations (Hacia et al. 1999). Several applications of microarrays make use of SNP detection, e.g., genotyping, forensic analysis, measuring predisposition to disease, identifying drug-candidates, evaluating germline mutations in individuals, somatic mutations in cancers, assessing loss of heterozygosity, and genetic linkage analysis.
6.6.7 Alternative Splicing Detection
An exon junction array design uses probes specific to the expected or potential splice sites of predicted exons for a gene. It is of intermediate density or coverage, to a typical gene expression array (with 1–3 probes per gene) and a genomic tiling array (with hundreds or thousands of probes per gene). It is used to assay the expression of alternative splice forms of a gene. Exon arrays have a different design; employing probes designed to detect each individual exon for known or predicted genes, and can be used for detecting different splicing isoforms.
6.6.8 Fusion Genes Microarray
A fusion gene microarray can detect fusion transcripts, e.g., from cancer specimens. The principle behind this is building on the alternative splicing microarrays. The oligo design strategy enables combined measurements of chimeric transcript junctions with exon-wise measurements of individual fusion partners.
6.6.9 Tiling Array
Genome tiling arrays consist of overlapping probes designed to densely represent a genomic region of interest, sometimes as large as an entire human chromosome. The purpose is to empirically detect expression of transcripts or alternatively splice forms, which may not have been previously known or predicted.
6.7 Specialized Applications of DNA Microarrays
DNA microarrays have various specific applications to Cancer biology, Microbiology, Plant science, Medicine, Environmental Science, Nephrology, etc. Few of them are explained here.
6.7.1 Applications to Cancer Biology
Cancer is caused by the accumulation of genetic and epigenetic changes resulting from the altered sequence or expression of cancer-related genes, such as oncogenes or tumor suppressor genes, as well as genes involved in cell cycle control, apoptosis, adhesion, DNA repair, and angiogenesis. Because gene expression profiles provide a snapshot of cell functions and processes at the time of sample preparation, comprehensive combinatorial analysis of the gene expression patterns of thousands of genes in tumor cells and comparison to the expression profile obtained with healthy cells should provide insights concerning consistent changes in gene expression that are associated with tumor cellular dysfunction and any concomitant regulatory pathways. Microarray technology has been widely used in the past 10 years to investigate tumor classification, cancer progression, and chemotherapy resistance and sensitivity (Macgregor and Squire 2002). Although the major limiting factors for routine use in a clinical setting at present are cost and access to the microarray technology, it is likely that costs will decrease in the near future and that the technology will become increasingly user friendly and automated. In this section, few examples are discussed to demonstrate that expression arrays can be used to gain a better understanding of the basic biology, diagnosis and treatment of cancer.
6.7.1.1 Identifying Single Nucleotide Polymorphism (SNP)
SNP’s are common DNA sequence variations having great significance for biomedical research. In human genome at least one out of every thousand nucleotide is observed to have polymorphism. Most of the SNP’s are harmless but few of them that are located in coding regions of the gene alter the composition of amino acids, thus the functions of encoded proteins. Similarly, SNP’s located in the noncoding regions are also important if they affect the splicing of the gene, or alter the promoter, enhancer, silencer or any recognition site for DNA binding proteins (Risch 2000). For example, a SNP in 5′ untranslated region of the RAD51 gene have been identified that may be associated with an increased risk of breast cancer and a lower risk of ovarian cancer among BRCA2 mutation carriers (Wang et al. 2001).
6.7.1.2 Detection of Mutations
High throughput methods like microarray assays are found useful in rapid detection of mutations among large genes like BRCA1, BRCA2. For example, a high density oligonucleotide array with about 96,000 oligonucleotides of 20 bp size have been developed by Hacia et al. (1996) that could detect a wide range of heterozygous mutations in the 3.45 Kb exon 11 of the BRCA1 gene. Wen et al. (2000) found that oligonucleotide based detections are more accurate than DNA sequencing in identifying p53 mutations in ovarian tumors.
6.7.1.3 Molecular Classification of Tumors
Improvements in tumor classification are central to the development of novel and individualized therapeutic approaches. Histologically indistinguishable tumors often show significant differences in clinical behavior, and sub classification of these tumors based on their molecular profiles may help explain why these tumors respond so differently to treatment (Macgregor and Squire 2002).
For example, (1) microarray technology was applied to develop innovative classifications of leukemias using microarray analysis based on neighborhood analysis and the utilization of tumor class predictors. This strategy was able to distinguish between acute myeloid leukemia and acute lymphocytic leukemia without supervisory analysis (Golub et al. 1999); (2) gene expression pattern analysis has been used to classify, at the molecular level, breast tumors (Sorlie et al. 2001), B cell lymphoma (Alizadeh et al. 2000), cutaneous melanoma (Bittner et al. 2000), and lung adenocarcinoma (Garber et al. 2001; Bhattacharjee et al. 2001); (3) by analyzing molecular profiles of 50 nonneoplastic and neoplastic prostate samples, signature expression profiles of healthy prostate, benign prostatic neoplasia, localized prostate cancer, and metastatic prostate cancer has been established (Dhanasekaran et al. 2001). These studies established the feasibility of combining large-scale molecular analysis of expression profiles with classic morphologic and clinical methods of staging and grading cancer for better diagnosis and outcome prediction.
6.7.1.4 Discoveries of Novel Genes
Many tumor suppressor genes and oncogenes are regulated by the expression of other genes at transcription level. Even some of them like p53 and Myc are transcription factors. Upon activation, p53 induces growth arrest or apoptosis by transcriptionally activating its target genes. With the help of microarray-based expression profiling target genes for several gene products have been identified which directly or indirectly regulates transcription. For example, oligonucleotide array having 6,000 genes is used to identify p53 target genes (Zhao et al. 2000). Similarly, microarray-based expression profiling have been used to identify Gadd45 as one of the targets of BRCA1 tumor suppressor gene (Harkin et al. 1999).
6.7.1.5 Detection of Sensitivity to Drugs
Despite considerable advances in cancer treatment, acquired resistance to chemotherapeutic drugs continues to be a major obstacle in patient treatment and overall outcome. Anticancer drug resistance is thought to occur through numerous mechanisms, and microarrays offer a new approach to studying the cellular pathways implicated in these mechanisms and in predicting drug sensitivity and unexpected side effects. Most array studies have been carried out using cancer cell lines that are rendered resistant to commonly used anticancer drugs. Obtaining further insights into the mechanism of action of anticancer drugs and the diverse pathways involved in drug resistance may eventually be invaluable for design of more strategic treatments that are most appropriate for an individual tumor (Macgregor and Squire 2002).
For example, (1) in an attempt to obtain molecular fingerprinting of anticancer drugs in cancer cells the expression profiles of doxorubicin-induced and -resistant cancer cells were monitored (Kudoh et al. 2000); (2) similarly, in another study, a subset of 1,400 genes were analyzed to study the correlation between expression profiles and drug mechanism of action of a panel of 118 anticancer drugs (Ross et al. 2000; Scherf et al. 2000).
6.7.1.6 Tumor Metastasis Related Studies
Conversion of noninvasive tumors into invasive tumors is known as metastasis when cancer cells start spreading from one organ to another organ or tissue with blood stream or lymphatic system. DNA microarrays have been used to identify the genes involved in metastasis.
For example, clonal relationship of 22 liver tumor foci from six patients have been investigated by Cheung et al. (2002) with the help of cDNA microarray having 23,000 genes. With an aim to identify metastasis-related genes, they could identify 63 up-regulated genes, of which 39 were known genes and 24 were expressed sequence tags and 27 down regulated genes, of which 14 were known genes and 13 were expressed sequence tags. Similar studies have been conducted with osteosarcoma, colorectal tumor and brain metastasis.
6.7.1.7 Identification of Molecular Markers Specific to Tumor
Several research groups have focused on identifying subsets of genes that show differential expression between healthy tissues or cell lines and their tumor counterparts to identify biomarkers for several solid tumors, including ovarian carcinomas, oral cancer, melanoma, colorectal cancer, and prostate cancer.
In a recent study, a subset of genes showing differential expression between healthy ovaries and ovarian tumors has been reported. Some of these genes, such as metallothionein 1G, which was found to be up-regulated in tumor samples, are implicated in resistance to the anticancer drug cisplatin and might be an indicator of pretreatment resistance of these tumors to cisplatin (Bayani et al. 2002). Other gene identified in this study is the osteopontin gene, which was strongly up-regulated in some tumor samples that have been shown to be secreted in the serum of patients with metastatic cancer, might be an excellent candidate for biomarkers of tumor progression in EOC (Singhal et al. 1997).
One of the most important challenges investigators are facing while using microarray analysis is determining which of the plethora of new differentially expressed genes is biologically relevant to the tumor system being studied. Even when rigorous efforts are made to minimize the number of variables in a microarray study, there may be an unmanageable number of differentially expressed genes that will contribute excessive background values. Therefore, combining expression microarray analysis with other approaches, particularly cytogenetics techniques, such as spectral karyotyping and comparative genomic hybridization array (CGH) (Pollack et al. 1999), offers the possibility to focus on significantly smaller subsets of genes of direct relevance to tumor biology (Bayani et al. 2002). A combination of expression arrays and CGH array techniques was used on breast cancer cell lines and has identified a limited number of genes that are both amplified and over expressed (Monni et al. 2001).
Finally, validation of the relative expression obtained from genome-wide microarray analysis is critical. Several approaches can be chosen from basic Northern analysis or semiquantitative reverse transcription-PCR to in situ hybridization (ISH) using tissue microarrays. For example, expression of several candidate genes associated with prostate cancer has been analyzed (Mousses et al. 2002) those were previously identified by cDNA microarray analysis. Tissue microarrays constructed from 544 histological biopsies were analyzed by ISH using RNA probes and/or by immunohistochemistry (IHC) using antibodies. There was excellent correlation between the cDNA microarray results and the results obtained with ISH and Northern blot analysis. In addition, protein expression assessed by IHC was also consistent with RNA expression. Similarly, comparable technologies to confirm over expression of hepsin and PIM-1 in prostate cancer have been used (Dhanasekaran et al. 2001).
6.7.2 Applications to Microbiology
DNA microarrays can be applied to various aspects of microbial studies like microbial detection and identification, determination of antimicrobial drug, drug resistance, microbial typing, microbial gene expression profiling, host gene expression profiling during microbial infections, and determination of host genomic polymorphism.
6.7.2.1 Detection and Identification of Microbes
DNA microarrays could potentially be an assay method to address multiple questions for species identification in both clinical and environmental settings. It identifies their phylogenetic status based on unique 16S rRNA sequences and provides information related to the presence of antibiotic markers and pathogenicity regions (Ye et al. 2001).
For example, (1) a DNA probe array have been described for species identification and detection of rifampin resistance in M. tuberculosis (Troesch et al. 1999). In this 70 mycobacterial isolates from 27 different species and 15 rifampin-resistant strains were tested. A total of 26 of the 27 species as well as all of the rifampin-resistant mutants were correctly identified. (2) For field applications, a portable system for microbial sample preparation and oligonucleotide microarray analysis has also been reported (Bavykin et al. 2001). This portable system contained three components: (a) a universal silica mini-column for successive DNA and RNA isolation, fractionation, fragmentation, fluorescent labeling, and removal of excess free label and short oligonucleotides; (b) microarrays of immobilized oligonucleotide probes for 16S rRNA identification; and (c) a portable battery-powered device for imaging the hybridization of fluorescently labeled RNA fragments on the arrays. Beginning with whole cells, it takes approximately 25 min to obtain labeled DNA and RNA samples and an additional 25 min to hybridize and acquire the microarray image using a stationary image analysis system or the portable imager. (3) Respiratory viral pathogen has been detected in connection with multiplex PCR amplification. (4) Simultaneous detection and typing of human papillomaviruses and (5) rapid detection and characterization of methicillin resistant Staphylococcus aureus, have also become possible through DNA microarrays.
6.7.2.2 Virulence Factor Determination of Pathogenic Microbes
Many genes associated with virulence are regulated by specific conditions. One way to determine the candidate virulence factors is to investigate the genome-wide gene expression profiles under relevant conditions, such as physiological changes during interaction with the host. A second approach would rely on comparative genomics (Ye et al. 2001).
For example, in a genome comparison study among Helicobacter pylori strains, a class of candidate virulence genes was identified by their coinheritance with a pathogenicity island using DNA microarray technique. The whole genome microarray of H. pylori was also shown to be an effective method to identify differences in gene content between two H. pylori strains that induce distinct pathological outcomes. It is demonstrated that the ability of H. pylori to regulate epithelial cell responses related to inflammation depends on the presence of an intact cag pathogenicity island (Salama et al. 2000).
Stay updated, free articles. Join our Telegram channel

Full access? Get Clinical Tree


