Fig. 2.1
The reading pattern of autoradiogram
2.3.2 Sanger Method
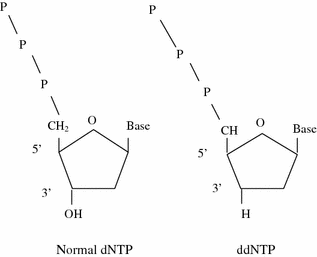
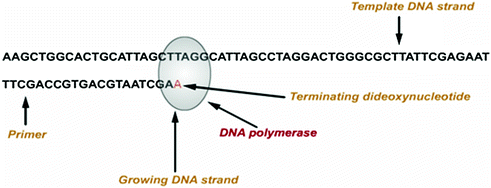
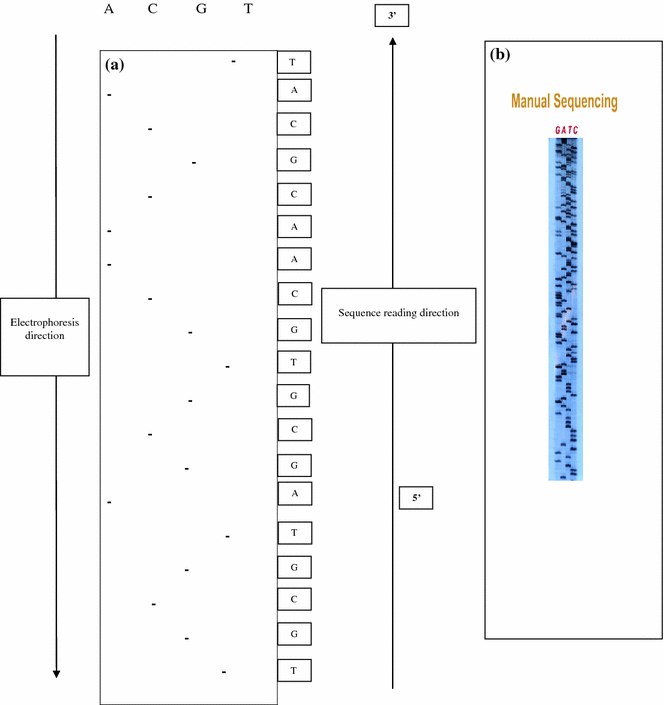
Frederick Sanger developed an alternative method, rather than using chemical cleavage reactions, Sanger opted for a method involving a third form of the ribose sugar (Sanger et al. 1977). Ribose has a hydroxyl group on both the 2′ and the 3′ carbons, whereas deoxyribose has only the one hydroxyl group on the 3′ carbon. There is a third form of ribose, dideoxyribose in which the hydroxyl group is missing from both the 2′ and the 3′ carbons (Fig. 2.2). Whenever a dideoxynucleotide incorporated into a polynucleotide, the chain irreversibly stops or terminates. The basic idea behind chain termination method developed in 1974 by Sanger was to generate all possible single-stranded DNA molecules complementary to a template that starts at a common 5′ base and extends up to 1 kilobase in the 3′ direction (Fig. 2.3). These single strands of DNA are labeled in such a way which allows the identity of the 3′-end base in each molecule. These molecules are separated according to size by electrophoresis and each band corresponding to a class of molecule differing in length by one nucleotide from the adjacent band (Fig. 2.4a, b).


Fig. 2.2
Structural comparison of dNTP and ddNTP

Fig. 2.3
Principle of Sanger sequencing

Fig. 2.4
Determination of DNA sequence by Sanger’s dideoxy nucleotide method. a Depicted diagram. b Autoradiogram
2.3.3 Automated DNA Sequencing Methods
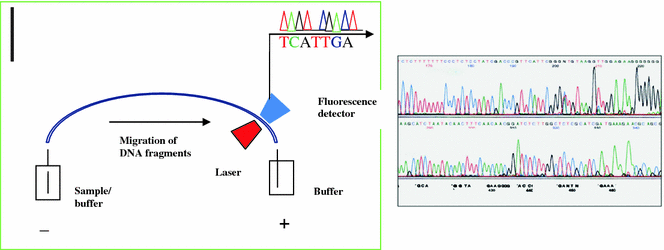
The principle of automated DNA sequencing is same as Sanger’s method but the detection is different. In this automated method, the primer or the ddNTPs are labeled by incorporation of a fluorescent dye. Thus, rather than running the gel for a particular time and reading the results, the machine uses a laser to read the fluorescence of the dye as the bands pass a fixed point. Labeling of the ddNTPs is much more advantageous than the primer labeling because four ddNTPs each labeled with different dyes leads the sequencing reaction to run in a single tube and separated in a single lane, thus increasing the capacity of the machine. Automated DNA sequencers can sequence up to 384 DNA samples in a single batch and run up to 24 runs per day. DNA sequencers carry out capillary electrophoresis for size separation, detection and recording of dye fluorescence, and data output as fluorescent peak trace chromatograms. Since the capillary tubes have a high surface to volume ratio (25–100 mm diameter), it radiates heat readily, thus the samples do not over heat. Detection of the migrating molecules is accomplished by shining a light source through a portion of the tubing and detecting the light emitted from the other side (Fig. 2.5). In thermo cycling sequencing the reactions by thermo cycling, cleanup, and re-suspension in a buffer solution before loading onto the sequencer are performed separately. A number of commercial and non-commercial software packages can trim low-quality DNA traces automatically. These programs score the quality of each peak and remove low-quality base peaks (generally located at the ends of the sequence).


Fig. 2.5
Capillary electrophoresis and electropherogram with peaks representing the bands on the sequencing gel
2.3.3.1 Base Calling
The raw sequence traces in automated sequencing can be read using automated softwares like Phred programme which convert traces into sequences that can be deposited in a database within seconds after sequencing run (Ewing et al. 1998).
The new techniques and equipment included in automated DNA sequencing are:
1.
Four-color fluorescent dyes have replaced the radioactive label. Attachment of these dyes to the ddNTPs results in a fluorescent tag directly marking just the terminated DNA molecule, and consequently a single sequencing reaction spiked with all four ddNTPs is sufficient to sequence any template.
2.
Rather than stopping the electrophoresis at a particular time the products are scanned for laser-induced fluorescence just before they run off the end of the electrophoresis medium. The sequence is collected as a set of four “trace files” that indicates the intensity of the four colors, a peak in the trace distribution implies that the particular base was the last one incorporated at the position.
3.
Improvement in the chemistry of template purification and the sequencing reaction including use of bioengineered thermostable polymerases that can read through secondary structure with high fidelity extends the length of high quality sequence.
4.
Slab gel electrophoresis gave way to capillary electrophoresis with the introduction in 1999 of Applied Biosystem’s ABI Prism 3,700 automated sequencers. These sequencers give extremely high quality, long reads, save time and money by abolishing the laborious, and often frustrating step of gel pouring that add a new level of automation in which the capillaries are loaded by robot from 96-well plates rather than by hand. Each machine can handle six 96-well plates per day or approximately 0.5 Mb of sequence.
5.
Matrix-assisted laser desorption/ionization, time-of-flight mass spectrometry (MALDI-TOF MS) was put forward as an alternative to the Sanger sequencing/capillary electrophoresis combination. It is the tool of choice in proteomics applications, while the full potential for DNA analysis was demonstrated in 1995 and for RNA in 1998. For MALDI-TOF MS analysis single-stranded nucleic acid molecules of 3–29 bp in length (1,000–8,600 Da range) need to be generated and deposited on a matrix (e.g., 3-hydroxy picolinic acid). The analyte/matrix molecules are then irradiated by a laser inducing their desorption and ionization, upon which the molecules pass through a flight tube connected to a detector on the other end. Separation occurs by the time of flight, which is proportional to the mass of the individual molecules. The main advantage of the method is that it directly measures an intrinsic physical property of the molecules i.e., mass and speed. Limitations lie in the size of the DNA molecules that can be detected intact to less than 100 bp (due to size-dependent fragmentation during the MALDI process); and that the analytes must be free from ion adducts which lead to mass distortion.
Compared to gel electrophoresis based sequencing systems, mass spectrometry produces very high resolution of sequencing fragments, rapid separation on microsecond time scales, and completely eliminates compressions associated with gel-based systems. While most of the research efforts have been focused on using mass spectrometers to analyze the DNA products from Sanger sequencing or enzymatic digestion reactions, the read lengths attainable are currently insufficient for large-scale de novo sequencing. The advantage of mass-spectrometry sequencing is that one can unambiguously identify frame shift mutations and heterozygous mutations making it an ideal choice for resequencing projects. In these applications, DNA sequencing fragments that are of the same length but with different base compositions are generated, which are challenging to consistently distinguish in gel-based sequencing systems. In contrast, MALDI-TOF MS produces mass spectra of these DNA sequencing fragments with nearly digital resolution, allowing accurate determination of the mixed bases. For these reasons, mass spectrometry based sequencing has mainly been focused on the detection of frameshift mutations and single nucleotide polymorphisms (SNPs). More recently, assays have been developed to indirectly sequence DNA by first converting it into RNA. These assays take advantage of the increased resolution and detection ability of MALDI-TOF MS for RNA.
6.
For long oligonucleotides (>50 bases), e.g., microarray applications, Electrospray Ionization-Mass Spectrometry (ESI-MS) is used. The target molecules are ionized into multiple charge states producing a waveform that can be de-convoluted into parent peaks. As only the charge state will vary for the ions, oligonucleotides with high molecular weights can be analyzed using this method (Edwards et al. 2005). In addition, the inherently milder ionization conditions make this analytical technique a great tool for the analysis of labile compounds such as common quenchers, e.g., dabcyl, BHQ’s, used in dual-labeled fluorogenic probes. The ESI-MS systems have mass resolution of approximately 0.03 %, i.e., resolution of ±3 Da on a 10 kDa oligonucleotide (Dale and Schantz 2007).
2.4 Genome Sequencing
The genome sequencing usually deals with large-scale sequencing, e.g., whole chromosomes, very long DNA pieces, etc. For longer targets, such as chromosomes, common approaches consisting of cutting (with restriction enzymes) and shearing (with mechanical forces) the large DNA fragments into shorter DNA fragments are used. The fragmented DNA is cloned into a DNA vector and amplified in E. coli or other suitable organisms. Short DNA fragments purified from individual clones and sequenced individually called shotgun sequencing, followed by electronic assembly into one long contiguous sequence. The overlapping fragments are joined together to form a contig; two or more contigs assembled to make draft sequence. This stage contains gaps in the assembled sequence which can be filled by primer walking and nested deletion strategies. The next stage is the finishing process which involves filling in the gaps and correcting the more obvious errors and uncertainties. The finished sequence does not contain gaps and is accurate to a defined level. The final stage is annotation which identifies the protein coding sequence. The Human genome project was completed by implementing two approaches: clone-by-clone sequencing and whole genome shotgun sequencing.
2.4.1 Clone-by-Clone Sequencing
In this approach the chromosomes were mapped and then split up into sections. A rough map was drawn for each section, and then the sections themselves were split into smaller bits, with plenty of overlap between each of the bits. Each of these smaller bits would be sequenced, and the overlapping bits would be used to put the genome back together again. First, by mapping the genome researchers produce at an early stage, a genetic resource that can be used to map genes. In addition, since every DNA sequence is derived from a known region, it was relatively easy to keep track of the project and to determine where gaps are in the sequence. Assembly of relatively short regions of DNA is an efficient step. However, mapping can be a time-consuming and costly process.
2.4.2 Whole Genome Shotgun Sequencing
The alternative to the clone-by-clone approach is the ‘bottom-up’ whole genome shotgun (WGS) sequencing. It was developed by Fred Sanger in 1982. First, DNA is broken into fragments followed by sequencing at random and assembling together the overlaps. Advantage of the whole genome shotgun is that it requires no prior mapping. Its disadvantage is that large genomes need computing power and sophisticated software to reassemble the genome from its fragments. Unlike the clone-by-clone approach, assemblies cannot be produced until the end of the project. Whole genome shotgun for large genomes is especially valuable if there is an existing ‘scaffold’ of organized sequences, localized to the genome, derived from other projects. When the whole genome shotgun data are laid on the ‘scaffold’ sequence, it is easier to resolve ambiguities. Today, whole genome shotgun is used for most bacterial genomes and as a ‘top-up’ of sequence data for many other genome projects.
Stay updated, free articles. Join our Telegram channel

Full access? Get Clinical Tree


