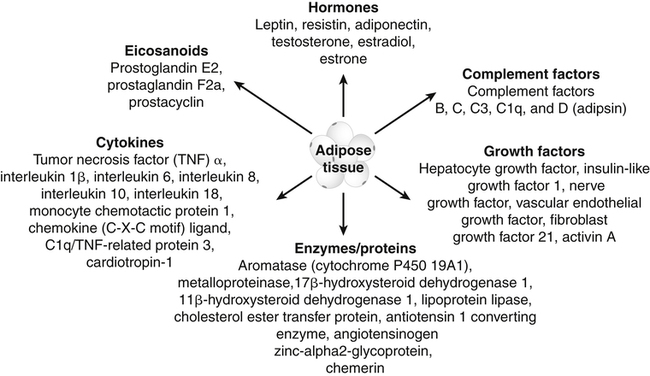
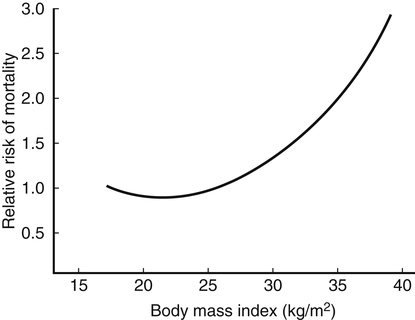
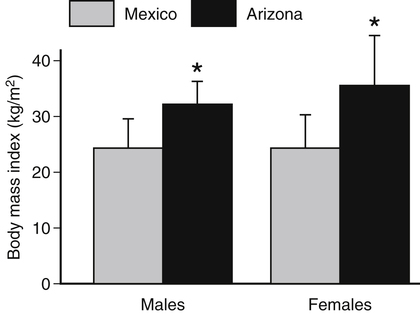
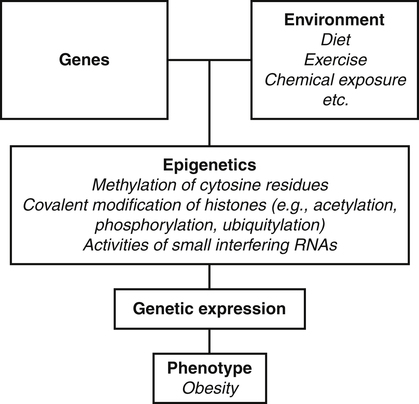
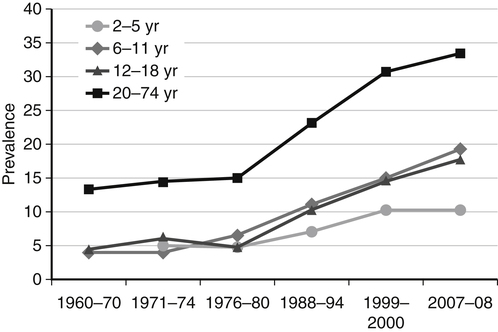
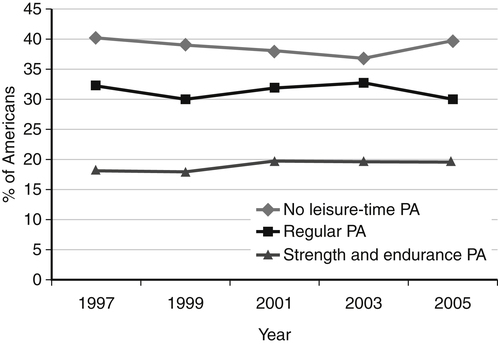
Darlene E. Berryman, PhD, RD and Christopher A. Taylor, PhD, RD, LD∗ A stable body weight is an indicator that energy balance has been maintained. As discussed in the previous chapter, the human body has a highly complex interactive means to help sustain energy balance. Despite this, many individuals experience chronic positive or negative energy balance resulting in significant weight gain or loss, respectively. The metabolic and health consequences that occur under energy imbalance will be reviewed in this chapter. Adipose tissue is the major site of stored energy in the body, with fat stores serving as an energy buffer; therefore this tissue is critical to energy balance. The importance of this energy reservoir in energy balance can best be illustrated by the metabolic disturbances that accompany an extreme excess (obesity) or an extreme loss (lipoatrophy) of adipose tissue. Because excess or deficient energy storage within this tissue is central to the metabolic disturbances observed in patients with obesity and lipodystrophies, it is important first to appreciate the varied functions and complexity of adipose tissue. Although once considered relatively simple, adipose tissue is clearly a much more interactive and dynamic tissue than originally appreciated. The focus of this section will be white adipose tissue (WAT); however, as mentioned in Chapter 21, there is also a more recent appreciation that brown adipose tissue may have a significant role in energy balance as well. WAT is a specialized loose connective tissue characterized by numerous lipid-laden adipocytes. These adipocytes have a great capacity to expand (hypertrophy) with excess energy changing their diameter up to twentyfold. However, their ability to expand is not infinite. Excess energy intake can also promote the formation of new adipocytes from precursor cells (preadipocytes) resident in the tissue (Drolet et al., 2008). Although the relatively large adipocytes contribute a large fraction of the total adipose tissue mass (~35% to 75% depending on how much fat they contain), they only comprise about 25% of the total cell population in adipose tissue. In addition to adipocytes, WAT contains macrophages, pericytes, lymphocytes, preadipocytes, fibroblasts, endothelial cells, and blood cells. These other cell types contribute to the tissue’s complexity and can influence the metabolic function of the tissue. The increased number of macrophages present in adipose tissue of obese animals or humans is an example of a case in which the tissue complexity changes the metabolic functions of the tissue (Weisberg et al., 2003). WAT is unique in that it is not a discrete tissue but is a distributed tissue found in various depots and as a component of most organs. WAT is not a uniform tissue, and marked differences can be observed among adipose tissue located in different regions of the body. Conventionally, WAT has been classified as either subcutaneous, which is just under the skin, or as visceral (intrabdominal), which surrounds internal organs. WAT typically accounts for the majority (~70%-90%) of all WAT. Visceral adipose tissue accounts for the other 10% to 30% (Müller et al., 2011). Visceral adipose tissue can be further subdivided into intraperitoneal (e.g., omental and mesenteric WAT) and extraperitoneal/retroperitoneal (e.g., perirenal WAT) deposits, and subcutaneous adipose tissue may be described by location (e.g., femoral, gluteal, or abdominal) (Frühbeck, 2008). Differences in vascularization (blood and lymphatic circulations), neural innervations, and cell composition all contribute to the differences in various adipose depots. For example, macrophage infiltration in adipose tissue of obese individuals is more prominent in visceral depots than in subcutaneous depots (Harman-Boehm et al., 2007). There are also sex-specific patterns of fat distribution and metabolism (Lee et al., 2010). For example, women have larger femoral-gluteal subcutaneous fat depots than do men. Because of the functional differences in various depots, it is not surprising that the specific regional distribution of adipose tissue is considered to be an important indicator of the metabolic alterations that accompany chronic disease. Overall, excess visceral adipose tissue is associated with an increased risk of numerous comorbidities that are associated with obesity as well as overall mortality. An excess of visceral fat is known as central obesity, and individuals with excess visceral fat have an “apple shaped” body type and large waist circumference. Although visceral fat itself has been implicated in the etiology of obesity and metabolic disease, the ability of the much larger subcutaneous depots to expand to store excess energy and prevent storage of fat in visceral adipose or nonadipose tissues is also important. More recently, adipose tissue has been shown to have important additional functions. Specifically, adipose tissue is a potent endocrine tissue (Galic et al., 2010). Collectively, the adipocyte-derived molecules secreted by adipose tissue are referred to as adipokines. Adipokines influence a variety of body processes including insulin sensitivity, inflammation, energy balance, adipocyte differentiation, and angiogenesis (Figure 23-1). Although adipokines, by definition, are adipocyte-derived hormones or cytokines produced by adipocytes, some of these molecules may also be produced by other cell types within the adipose tissue. For example, leptin is produced solely by adipocytes, but tumor necrosis factor-α is made by both the macrophages and the adipocytes. Thus the cellular composition of the WAT can influence the proportions of adipokines produced. Although the list of adipokines continues to grow, a full understanding of the function of most remains elusive. Proinflammatory adipokines have been implicated in the development of insulin resistance and the increased risks of type 2 diabetes and cardiovascular disease that are associated with obesity. Leptin levels may play an important role in the regulation of immune function, and lack of leptin might be involved in increased susceptibility to infection in malnourished individuals. Some of these adipokines, such as leptin, have important roles in controlling energy balance, as discussed in Chapter 22. Regardless, as adipose tissue mass is altered, adipokine production is impacted, which likely contributes to the pathogenic effects associated with obesity and lipodystrophies. Obesity has become a significant public health concern in the United States and around the world. A combination of genetic, lifestyle, and environmental factors have contributed to the increased prevalence of overweight and obesity. Accumulation of body fat has serious deleterious health outcomes (McPherson, 2007). The current rates of obesity have contributed to the rise in incidence of obesity-related comorbidities, such as sleep apnea, depression, hypertension, cardiovascular disease, diabetes, and some cancers. Overweight and obesity refer to an individual possessing a greater body weight than considered healthy because of excess accumulation of adipose tissue. Clinically, obesity is most commonly defined by an increased body mass index (BMI) or waist circumference (WC). BMI has historically served as the clinical marker of obesity in adults. BMI is the ratio of weight in kilograms to the square of height in meters (kg/m2). Individuals with a BMI greater than 25 kg/m2 are considered overweight, and those with a BMI greater than 30 kg/m2 are classified as obese (Table 23-1; National Institutes of Health [NIH], 1998). These categories are based on evidence that health risks are greater in individuals with a BMI of 25 kg/m2 or greater, with risk progressively increasing as BMI increases above of 25 kg/m2 (Figure 23-2). Although a useful screening tool to assess weight status and to monitor trends in populations, BMI cannot discern between lean mass and adipose tissue directly. It should be noted, therefore, that individuals with a greater amount of lean muscle mass may be falsely classified as overweight or obese on the basis of BMI. TABLE 23-1 Definitions of Child and Adult Obesity Based on BMI Child obesity is based on the gender-specific body mass index (BMI)–for-age percentiles from the growth charts. Adult obesity is based on BMI values (kg/m2). In addition to high BMI values, the distribution of excess fat depots and the amount of weight gained during adulthood seem to be associated with increased risk of morbidity. Individuals who accumulate excess body fat in upper body adipose depots, particularly visceral depots, may be at greater risk of developing negative health consequences of obesity than individuals who accumulate the same amount of excess body fat in the lower body (Pouliot et al., 1994). For this reason, WC has become another clinical measure to assess obesity and determine chronic disease risk. Chronic disease risk is increased in men with a WC larger than 102 cm (>40 inches) and in women with a WC larger than 88 cm (>35 inches). The visceral location of excess adipose tissue increases risk of comorbid conditions beyond that indicated by an elevated BMI alone (World Health Organization [WHO], 1997; Pi-Sunyer, 1993). Data from many studies suggest that excess fat located in visceral depots is an independent risk factor for type 2 diabetes and cardiovascular disease (Mathieu et al., 2010). Because of the normal changes associated with growth and puberty, assessment of obesity in children and adolescents requires that age be considered when calculating BMI. BMI-for-age standardized growth curves were developed to account for the trajectories of growth and development in children and adolescents (Figure 23-3). BMI-for-age categories similar to the BMI categories applied to adults are used to describe child and adolescent obesity data; the classification cutoffs are presented in Table 23-1. More recently, an examination of central, or abdominal, adiposity in children and adolescents was done to generate thresholds specific for age, gender, and race–ethnicity for assessment of obesity by measuring WC. Children and adolescents with a WC above the age and gender-specific 90th percentile are classified as obese (Fernandez et al., 2004). Obesity is increasing at an alarming rate in both developed and developing countries and in both adults and children. In 2005 the World Health Organization (WHO) estimated that more than 1.6 billion individuals older than age 14 years were overweight, with approximately one quarter of them being obese. The worldwide prevalence of obesity ranges from less than 5% of the population in rural China, Japan, and some African countries to levels as high as 80% of the adult population in the South Pacific island nation of Nauru (WHO, 2005). In the United States, the prevalence of obesity has significantly increased during the past three decades; age-adjusted rates of obesity more than doubled from 1960 (13.4%) to 2008 (33.9%). Trends in obesity among U.S. adults are presented in Figure 23-4. According to the data from the 2007–2008 National Health and Nutrition Examination Survey (NHANES), the age-adjusted prevalence of overweight or obesity in the United States was over 68%, with one third (33.8%) of U.S. adults presenting with obesity (Flegal et al., 2010). Hispanics have the highest rates of overweight, with more than three quarters with a BMI higher than 25 kg/m2. Non-Hispanic blacks, especially females, were most likely to be classified as obese. Overweight and obesity are more difficult to assess in children than in adults because the height and weight of growing children are constantly changing. However, all indications are that overweight and obesity are also increasing in children (Ogden and Carroll, 2010). Based on the 2007–2008 NHANES data, child obesity has increased twofold to fourfold since the 1960s, with 10% of children age 2 to 5 years and 20% of children age 6 to 11 years being classified as obese based on the 2007–2008 data (see Figure 23-4). Marked increases in obesity also have been observed in adolescent boys and girls, with the prevalence of obesity in 2007–2008 being more than 25% for Mexican American adolescent boys and non-Hispanic black girls. Thus the prevalence of overweight and obesity has increased in children and adolescents as well as in adults in the United States over the last several decades. Early evidence for a genetic component to body weight regulation comes from studies of families, twins, and adoptees. That is, identical twins, even when raised in different environments, show similarities in body weight and body composition. Similarly, these studies reveal that body weight and composition of twins is more strongly correlated with biological parents than adoptive parents, again implicating a strong genetic influence (Silventoinen et al., 2010). In fact, some studies have suggested that genetic factors contribute anywhere from 40% to 70% to the interindividual variation in the susceptibility to obesity. Humans appear to have evolved many redundant genetic pathways to prevent starvation; fewer genes appear to be involved in prevention of excess adipose tissue mass, a problem faced by many current societies. The role of genetics in obesity is firmly supported by examples of single gene defects (mutations, deletions, insertions) that cause obesity. As of October 2005 (the last update of the Human Obesity Gene Map), 176 cases of obesity due to single gene defects had been published worldwide, and these 176 cases involved mutations in 11 different genes (Rankinen et al., 2006). The majority of the reported cases of monogenic obesity are due to defects in the gene encoding melanocortin receptor 4. Among the other 10 genes are those encoding leptin, leptin receptor, melanocortin receptor 3, proopiomelanocortin (POMP), corticotorpin-releasing hormone receptor, and several others. Monogenic causes of obesity are clearly extremely rare and cannot explain the current obesity epidemic. Additional candidate genes have been identified from the study of patients with syndromes, such as Prader-Willi syndrome, that both are associated with obesity and show a Mendelian pattern of inheritance (i.e., due to single gene mutations). These studies have identified about 50 loci (regions of chromosomes) and the associated candidate genes that may influence susceptibility to obesity. Common forms of obesity are thought to be influenced by several genes and are said to be multigenic. Individuals have always differed somewhat in body fat levels, and evidence from animal models, human linkage studies, twin studies, and population studies suggests that the variation in susceptibility to obesity has a genetic component. Progress in identifying genes associated with the common forms of obesity has been slow but is accelerating with advances in genotyping and genomic technology. Hundreds of promising candidates have been identified by genome-wide association scans. Two gene variants that consistently show promise are the MC4R (melanocortin 4 receptor) and FTO (fat mass and obesity-associated protein) genes. MC4R is expressed in the arcuate nucleus and influences feeding behavior as discussed in Chapter 22; mutations in or around this gene are the most common form of monogenic obesity, as mentioned above. Variants in MC4R also are strongly associated with a significant fraction of obesity cases in several populations (e.g., up to 6% of obese adults) (Tao, 2010). Many independent population-based studies report that variants in FTO might be responsible for up to 22% of all cases of common obesity in the general population. Interestingly, variants of this gene also show a strong association with type 2 diabetes and polycystic ovary syndrome, both of which are characterized by insulin resistance (Tan et al., 2010). The function of this gene is not fully understood and is currently under intense scientific investigation. The exponential increase in the prevalence of obesity that has occurred in the United States over the last few decades cannot be solely attributed to genetic causes, suggesting a more complex milieu at work. Changes in lifestyle behaviors as well as a host of environmental factors are influencing the prevalence of obesity. Increased access to foods, especially less expensive and less healthy options, and a decline in the physical environment that supports regular physical activity both provide additional barriers to obesity prevention and treatment (Drewnowski and Darmon, 2005). These factors combined have precipitated behavioral and physiological changes that have contributed to the recent rise in obesity and related chronic diseases. Moderate increases in the percentage of calories from dietary fat intake, and consequently increases in the energy density of the diet, have contributed to the increase in the prevalence of obesity (Astrup et al., 2008; Goris and Westerterp, 2008; James, 2008). Americans consume diets with an average of about 34% of total energy from fat. When high-fat diets are fed to laboratory rodents, the majority become obese. Obesity appears to result both from an increased voluntary energy intake due to high-fat diets and from the body’s ability to assimilate excess dietary fat more efficiently than excess dietary carbohydrate or protein (Horton et al., 1995). Furthermore, macronutrient distributions also influence the metabolism of energy intakes. High-protein diets have been explored as a means of promoting weight loss, in an attempt to moderate insulin action and capitalize on the energy cost of gluconeogenesis. Similarly, the consumption of refined sugars, especially fructose and sucrose, is controversially linked to an increased risk for obesity (Tappy and Lê, 2010). While Americans are consuming more energy, they are also expending less energy through physical activity. In 2005, 39.6% of U.S. adults were inactive or reported no leisure-time physical activity (Figure 23-5) (Centers for Disease Control and Prevention [CDC], 2007). Physical activity levels were more likely to be inadequate in older adults, less educated people, and racial and ethnic minorities. Such trends in limited physical activity have ramifications on the development of obesity, but also numerous additional health outcomes. Much of the decline in physical activity can be attributed to modernization, which has made it easier to be sedentary both at work and at home. The increased availability of automobiles and labor-saving devices has substantially reduced the amount of time spent being physically active. An increase in the time spent in sedentary activities, including watching television and sitting at the computer, is thought to play a role in reducing physical activity in children. The highly attractive nature of these sedentary activities is an additional challenge to promoting more physically active behaviors (Physical Activity Guidelines Advisory Committee, 2008). During the period from 2001 to 2005, the proportion of U.S. adults meeting physical activity recommendations (i.e., moderate intensity activity for at least 30 min/day, 5 or more days a week; or vigorous intensity activity for at least 20 min per day, 3 or more days per week) increased modestly from 45.3% to 48.8%, but the rates of obesity continued to rise. Many other factors dictate the metabolic utilization of energy intakes. Alterations in the dietary habits of individuals in poverty as well as those suffering from food insecurity have been linked to increased rates of obesity (Drewnowski and Darmon, 2005; Dinour et al., 2007). A greater reliance on foods that are energy-dense, nutrient-poor, and inexpensive commonly leads to diets that are high in fat; these habits have precipitated poor health outcomes, including increased fat deposition and increased risk for several chronic diseases. Physiological responses to food components and contaminants have also been discovered. Changes in gut microflora due to dietary practices or consumption of chemical contaminants, such as bisphenol A in plastics, are two examples (Grün, 2010; Musso et al., 2010). There is even some evidence that infectious agents can influence obesity onset (Mitra and Clarke, 2010). Importantly, the varied rates of obesity within individuals exposed to the same potentially obesogenic environments suggest that many factors, including consumption of high-fat diets or physical inactivity, should not be viewed as known causes of obesity. Rather, these environmental factors increase the probability of an imbalance between energy intake and energy expenditure for individuals living in that environment. Much research has also indicated that the intrauterine growth environment during pregnancy can have an impact on physiology in childhood and adulthood, altering the propensity to develop obesity and chronic diseases (Varvarigou, 2010). Obesity is most likely to occur when a genetically susceptible individual encounters an environment conducive to obesity, sometimes referred to as an obesogenic environment. An example is provided by Pima Indians living in Arizona as compared to those in northern Mexico. These populations are genetically similar but have very different lifestyle patterns and rates of obesity. Pima Indians in Arizona show an extremely high prevalence of obesity and report low levels of physical activity combined with high intakes of energy-dense diets (Figure 23-6). In contrast, Mexican Pima Indians are farmers, consuming food that they grow and engaging in high levels of physical activity (Esparza et al., 2000). The Mexican Pima Indians are significantly less obese than the Arizona Pima Indians, demonstrating the importance of environmental factors on body weight. However, the mean BMI for the Mexican Pima Indians is still greater than would be expected for a highly active population consuming a low-fat diet, suggesting that Pima Indians, regardless of environment, have genes that favor high body weight. Interestingly, FTO gene variants appear to have some role in influencing BMI in the Pima Indian population (Rong et al., 2009). Additional studies beyond those in Pima Indians provide further evidence of such an FTO gene–environment interaction. For specific FTO variants, BMI is greater in individuals who are sedentary, whereas this association is attenuated in those who are physically active (Andreasen et al., 2008; Ruiz et al., 2010). These results suggest that genetic susceptibility toward obesity induced by variation in at least FTO can be overcome to some degree by lifestyle modifications. It should be noted that no studies have yet shown a similar gene–environment interaction for MC4R, although data are limiting. Epigenetics, or the heritable changes in gene function that occur without a change in the nucleotide sequence, is another means by which genes interact with the environment (Figure 23-7). Epigenetic changes often involve changes in DNA methylation or histone modification. Although this is an emerging field, there are several examples in which environmental exposure to nutrients can alter epigenetic factors (Campión et al., 2009). An example is the agouti gene from mouse studies. Increased agouti gene expression can result in obesity; expression of this gene is influenced by DNA methylation. Dietary intake of methyl donors, such as folic acid, can alter DNA methylation of this gene, which in turn controls expression of this obesity-inducing gene. How obesity susceptibility is influenced by epigenetic modifications in humans is being intensively studied. The data in Figure 23-8 illustrate the strong relationships between BMI and the risks of type 2 diabetes, coronary heart disease, high blood pressure, and metabolic syndrome (Nguyen et al., 2008). Significant associations were also found between BMI and the prevalence of hypercholesterolemia, asthma, and fair or poor general health. Box 23-1 lists the most frequently observed comorbidities associated with obesity. The risk of developing a comorbidity is influenced by the extent of obesity, the location of excess body fat, and the degree of weight gain over the adult years. In general, obesity-associated morbidity and mortality increase in direct proportion to increases in BMI. Furthermore, health care costs have been estimated to be approximately 22% higher in individuals presenting with central adiposity (Højgaard et al., 2008). The combination of increased BMI and the presence of central adiposity further increases the risk of comorbid conditions.
Disturbances of Energy Balance
Adipose Tissue in Energy Balance
Physiology of White Adipose Tissue
Functions of White Adipose Tissue
Obesity
Definition of Obesity
WEIGHT CATEGORY
CHILDREN∗
(BMI-FOR-AGE PERCENTILE)
ADULTS†
(BMI)
Underweight
<5th percentile
<18.5 kg/m2
Healthy weight
5th to 84th percentile
18.5–24.9 kg/m2
Overweight
85th to 94th percentile
25–29.9 kg/m2
Obese class I
≥95th percentile
30–34.9 kg/m2
Obese class II
35–39.9 kg/m2
Obese class III
≥40 kg/m2
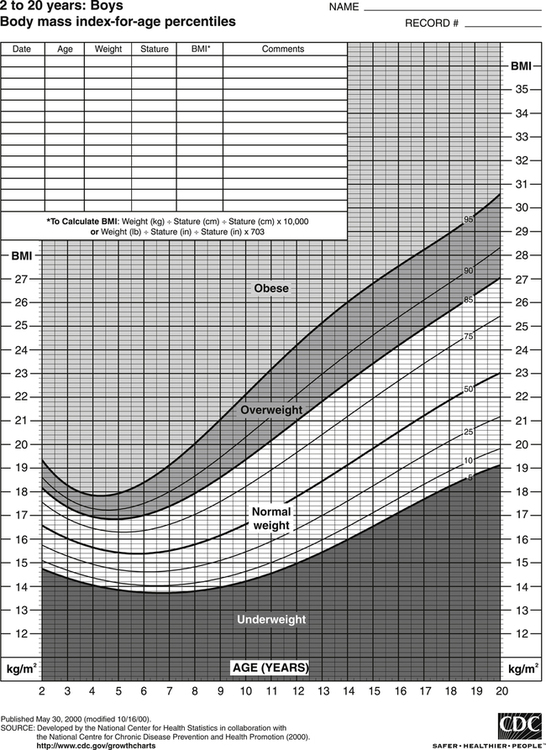
Prevalence of Obesity
Factors Involved in the Development of Obesity
Genetic Factors
Behavioral and Environmental Factors
Interactions of Genes and Environment
Health Consequences of Obesity
Comorbidities