Diabetes Mellitus
KEY CONCEPTS
![]() Diabetes mellitus (DM) is a group of metabolic disorders of fat, carbohydrate, and protein metabolism that results from defects in insulin secretion, insulin action (sensitivity), or both.
Diabetes mellitus (DM) is a group of metabolic disorders of fat, carbohydrate, and protein metabolism that results from defects in insulin secretion, insulin action (sensitivity), or both.
![]() The incidence of type 2 DM is increasing. This has been attributed in part to a Western-style diet, increasing obesity, sedentary lifestyle, and an increasing minority population.
The incidence of type 2 DM is increasing. This has been attributed in part to a Western-style diet, increasing obesity, sedentary lifestyle, and an increasing minority population.
![]() The two major classifications of DM are type 1 (insulin deficient) and type 2 (combined insulin resistance and relative deficiency in insulin secretion). They differ in clinical presentation, onset, etiology, and progression of disease. Both are associated with microvascular and macrovascular disease complications.
The two major classifications of DM are type 1 (insulin deficient) and type 2 (combined insulin resistance and relative deficiency in insulin secretion). They differ in clinical presentation, onset, etiology, and progression of disease. Both are associated with microvascular and macrovascular disease complications.
![]() Diagnosis of diabetes is made by four criteria: fasting plasma glucose ≥126 mg/dL (≥7 mmol/L), a 2-hour value from a 75-g oral glucose tolerance test ≥200 mg/dL (≥11.1 mmol/L), a casual plasma glucose level of ≥200 mg/dL (≥11.1 mmol/L) with symptoms of diabetes, or a hemoglobin A1c [HbA1c] ≥6.5% (≥0.065; ≥48 mmol/mol Hb). The diagnosis should be confirmed by repeat testing if obvious hyperglycemia is not present.
Diagnosis of diabetes is made by four criteria: fasting plasma glucose ≥126 mg/dL (≥7 mmol/L), a 2-hour value from a 75-g oral glucose tolerance test ≥200 mg/dL (≥11.1 mmol/L), a casual plasma glucose level of ≥200 mg/dL (≥11.1 mmol/L) with symptoms of diabetes, or a hemoglobin A1c [HbA1c] ≥6.5% (≥0.065; ≥48 mmol/mol Hb). The diagnosis should be confirmed by repeat testing if obvious hyperglycemia is not present.
![]() Goals of therapy in DM are directed toward attaining normoglycemia (or appropriate glycemic control based on the patient’s comorbidities), reducing the onset and progression of retinopathy, nephropathy, and neuropathy complications, intensive therapy for associated cardiovascular risk factors, and improving quality and quantity of life.
Goals of therapy in DM are directed toward attaining normoglycemia (or appropriate glycemic control based on the patient’s comorbidities), reducing the onset and progression of retinopathy, nephropathy, and neuropathy complications, intensive therapy for associated cardiovascular risk factors, and improving quality and quantity of life.
![]() Metformin should be included in the therapy for all type 2 DM patients, if tolerated and not contraindicated, as it is the only oral antihyperglycemic medication proven to reduce the risk of total mortality, according to the United Kingdom Prospective Diabetes Study (UKPDS).
Metformin should be included in the therapy for all type 2 DM patients, if tolerated and not contraindicated, as it is the only oral antihyperglycemic medication proven to reduce the risk of total mortality, according to the United Kingdom Prospective Diabetes Study (UKPDS).
![]() Intensive glycemic control is paramount for reduction of microvascular complications (neuropathy, retinopathy, and nephropathy) as evidenced by the Diabetes Control and Complications Trial (DCCT) in type 1 DM and the UKPDS in type 2 DM. The UKPDS also reported that control of hypertension in patients with diabetes will not only reduce the risk of retinopathy and nephropathy but also reduce cardiovascular risk.
Intensive glycemic control is paramount for reduction of microvascular complications (neuropathy, retinopathy, and nephropathy) as evidenced by the Diabetes Control and Complications Trial (DCCT) in type 1 DM and the UKPDS in type 2 DM. The UKPDS also reported that control of hypertension in patients with diabetes will not only reduce the risk of retinopathy and nephropathy but also reduce cardiovascular risk.
![]() Short-term (3 to 5 years), intensive glycemic control does not lower the risk of macrovascular events as reported by the Action in Diabetes and Vascular Disease, Action to Control Cardiovascular Risk in Diabetes, and Veterans Administration Diabetes Trial trials. Microvascular event reduction may be sustained, and macrovascular events reduced by improved early glycemic control, as evidenced by the UKPDS and DCCT follow-up studies. Significant reductions in macrovascular risk may take 15 to 20 years. This sustained reduction in microvascular risk and new reduction in macrovascular risk has been coined metabolic memory.
Short-term (3 to 5 years), intensive glycemic control does not lower the risk of macrovascular events as reported by the Action in Diabetes and Vascular Disease, Action to Control Cardiovascular Risk in Diabetes, and Veterans Administration Diabetes Trial trials. Microvascular event reduction may be sustained, and macrovascular events reduced by improved early glycemic control, as evidenced by the UKPDS and DCCT follow-up studies. Significant reductions in macrovascular risk may take 15 to 20 years. This sustained reduction in microvascular risk and new reduction in macrovascular risk has been coined metabolic memory.
![]() Knowledge of the patient’s quantitative and qualitative meal patterns, activity levels, pharmacokinetics of insulin preparations, and pharmacology of oral and injected antihyperglycemic agents is essential to individualize the treatment plan and optimize blood glucose control while minimizing risks for hypoglycemia and other adverse effects of pharmacologic therapies.
Knowledge of the patient’s quantitative and qualitative meal patterns, activity levels, pharmacokinetics of insulin preparations, and pharmacology of oral and injected antihyperglycemic agents is essential to individualize the treatment plan and optimize blood glucose control while minimizing risks for hypoglycemia and other adverse effects of pharmacologic therapies.
![]() Type 1 DM treatment necessitates insulin therapy. Currently, the basal–bolus insulin therapy or pump therapy in motivated individuals often leads to successful glycemic outcomes. Basal–bolus therapy includes a basal insulin for fasting and postabsorptive control, and rapid-acting bolus insulin for mealtime coverage. Addition of mealtime pramlintide in patients with uncontrolled or erratic postprandial glycemia may be warranted.
Type 1 DM treatment necessitates insulin therapy. Currently, the basal–bolus insulin therapy or pump therapy in motivated individuals often leads to successful glycemic outcomes. Basal–bolus therapy includes a basal insulin for fasting and postabsorptive control, and rapid-acting bolus insulin for mealtime coverage. Addition of mealtime pramlintide in patients with uncontrolled or erratic postprandial glycemia may be warranted.
![]() Type 2 DM treatment often necessitates use of multiple therapeutic agents (combination therapy), including oral and/or injected antihyperglycemics and insulin, to obtain glycemic goals due to the persistent reduction in β-cell function over time. Slowing, but not arresting, β-cell failure has been shown with thiazolidinediones and the glucagon-like peptide-1 (GLP-1) agonist class of medications.
Type 2 DM treatment often necessitates use of multiple therapeutic agents (combination therapy), including oral and/or injected antihyperglycemics and insulin, to obtain glycemic goals due to the persistent reduction in β-cell function over time. Slowing, but not arresting, β-cell failure has been shown with thiazolidinediones and the glucagon-like peptide-1 (GLP-1) agonist class of medications.
![]() Aggressive management of cardiovascular disease risk factors in type 2 DM is necessary to reduce the risk for adverse cardiovascular events or death. Smoking cessation, use of antiplatelet therapy as a secondary prevention strategy and in select primary prevention situations, aggressive management of dyslipidemia—primary goal to lower low-density lipoprotein cholesterol (<100 mg/dL [<2.59 mmol/L]) and secondarily to raise high-density lipoprotein cholesterol to ≥40 mg/dL (≥1.03 mmol/L)—and treatment of hypertension (again often requiring multiple drugs) to <130/80 mm Hg are vital.
Aggressive management of cardiovascular disease risk factors in type 2 DM is necessary to reduce the risk for adverse cardiovascular events or death. Smoking cessation, use of antiplatelet therapy as a secondary prevention strategy and in select primary prevention situations, aggressive management of dyslipidemia—primary goal to lower low-density lipoprotein cholesterol (<100 mg/dL [<2.59 mmol/L]) and secondarily to raise high-density lipoprotein cholesterol to ≥40 mg/dL (≥1.03 mmol/L)—and treatment of hypertension (again often requiring multiple drugs) to <130/80 mm Hg are vital.
![]() Prevention strategies for type 1 DM have been unsuccessful. Prevention strategies for type 2 DM are established. Lifestyle changes, dietary restriction of fat, aerobic exercise for 30 minutes five times a week, and weight loss form the backbone of successful prevention. No medication is currently FDA approved for prevention of diabetes, although several, including metformin, acarbose, pioglitazone, and rosiglitazone, have clinical trials demonstrating a delay of diabetes onset.
Prevention strategies for type 1 DM have been unsuccessful. Prevention strategies for type 2 DM are established. Lifestyle changes, dietary restriction of fat, aerobic exercise for 30 minutes five times a week, and weight loss form the backbone of successful prevention. No medication is currently FDA approved for prevention of diabetes, although several, including metformin, acarbose, pioglitazone, and rosiglitazone, have clinical trials demonstrating a delay of diabetes onset.
![]() Patient education and ability to demonstrate self-care and adherence to therapeutic lifestyle and pharmacologic interventions are crucial to successful outcomes. Multidisciplinary teams of healthcare professionals including physicians (primary care, endocrinologists, ophthalmologists, and vascular surgeons), podiatrists, dietitians, nurses, pharmacists, social workers, behavioral health specialists, and certified diabetes educators are needed, as appropriate, to optimize these outcomes in persons with DM.
Patient education and ability to demonstrate self-care and adherence to therapeutic lifestyle and pharmacologic interventions are crucial to successful outcomes. Multidisciplinary teams of healthcare professionals including physicians (primary care, endocrinologists, ophthalmologists, and vascular surgeons), podiatrists, dietitians, nurses, pharmacists, social workers, behavioral health specialists, and certified diabetes educators are needed, as appropriate, to optimize these outcomes in persons with DM.
![]() Diabetes mellitus (DM) is a heterogeneous group of metabolic disorders characterized by hyperglycemia. It is associated with abnormalities in carbohydrate, fat, and protein metabolism and may result in chronic complications including microvascular, macrovascular, and neuropathic disorders. It is estimated that in 2010, 26 million Americans ≥20 years old have DM, with as many as one fourth of these patients being undiagnosed, and an additional 79 million at high risk for the development of diabetes. The economic burden of DM approximated $218 billion in 2007, for diabetes and prediabetes. This is representative of an annual cost for each citizen of the United States of $700. DM is the leading cause of blindness in adults aged 20 to 74 years and the leading cause of end-stage renal disease in the United States. It also accounts for approximately 65,000 lower extremity amputations annually. Finally, a cardiovascular event is responsible for two thirds of deaths in individuals with type 2 DM and is the leading cause of death in type 1 DM of long duration.1
Diabetes mellitus (DM) is a heterogeneous group of metabolic disorders characterized by hyperglycemia. It is associated with abnormalities in carbohydrate, fat, and protein metabolism and may result in chronic complications including microvascular, macrovascular, and neuropathic disorders. It is estimated that in 2010, 26 million Americans ≥20 years old have DM, with as many as one fourth of these patients being undiagnosed, and an additional 79 million at high risk for the development of diabetes. The economic burden of DM approximated $218 billion in 2007, for diabetes and prediabetes. This is representative of an annual cost for each citizen of the United States of $700. DM is the leading cause of blindness in adults aged 20 to 74 years and the leading cause of end-stage renal disease in the United States. It also accounts for approximately 65,000 lower extremity amputations annually. Finally, a cardiovascular event is responsible for two thirds of deaths in individuals with type 2 DM and is the leading cause of death in type 1 DM of long duration.1
Optimal management of the patient with DM will reduce or prevent complications, decreasing morbidity and mortality while improving quality of life. Research, clinical trials, and drug development efforts over the past several decades have provided valuable information that applies directly to improving outcomes in patients with DM and have expanded the therapeutic armamentarium. Additionally, interventions in an attempt to prevent complications and the onset of diabetes have been reported for type 1 and 2 DM.
EPIDEMIOLOGY
Type 1 DM accounts for 5% to 10% of all cases of DM and is most often due to autoimmune destruction of the pancreatic β cells.2 Although type 1 DM most frequently develops in childhood or early adulthood, new cases occur at any age.
Type 1 DM is thought to be initiated by the exposure of a genetically susceptible individual to an environmental agent. The development of β-cell autoimmunity occurs in less than 10% of the genetically susceptible population and progresses to type 1 DM in less than 1% of that population.3 There is a direct relation to the prevalence of β-cell autoimmunity and the incidence of type 1 DM in various populations. The countries of Sweden, Sardinia, and Finland have the highest prevalence of islet cell antibody (ICA; 3% to 4.5%) and are associated with the highest incidence of type 1 DM: 22 to 35 per 100,000.4 The prevalence of type 1 DM is increasing, but the cause of this increase is not fully understood.
Markers of β-cell autoimmunity are detected in 14% to 33% of persons with adult-onset diabetes. This type of DM is referred to as latent autoimmune diabetes in adults (LADA) and presents with early failure of oral agents and need for insulin therapy.4
Idiopathic type 1 DM is a nonautoimmune form of diabetes frequently seen in minorities, especially Africans and Asians, with intermittent insulin requirements.2
Secondary forms of DM occur due to a variety of causes.2 Maturity onset diabetes of youth (MODY) is due to one of six genetic defects. Endocrine disorders such as acromegaly and Cushing’s syndrome may also cause diabetes. Any disease of the exocrine pancreas such as cystic fibrosis, pancreatitis, and hereditary hemochromatosis can damage β cells and impair insulin secretion. These unusual causes, however, only cause 1% to 2% of the total cases of DM. Please see Other Specific Types of Diabetes (<5% of Diabetes) below for further discussion.
Type 2 DM accounts for up to 90% of all cases of DM. Overall the prevalence of type 2 DM in the United States is about 11.3% in persons aged 20 or older; this prevalence is increasing. It is estimated that for every four persons who are diagnosed with DM, one person remains undiagnosed.1
There are multiple risk factors for the development of type 2 DM, including family history (i.e., parents or siblings with diabetes); obesity (i.e., ≥20% over ideal body weight, or body mass index [BMI] ≥25 kg/m2); chronic physical inactivity; race or ethnicity (see list below); history of impaired glucose tolerance (IGT), impaired fasting glucose (IFG), or hemoglobin A1c (HbA1c) 5.7% to 6.4% (0.057 to 0.064; 39 to 46 mmol/mol Hb) (see Diagnosis of Diabetes below); hypertension (≥140/90 mm Hg in adults); high-density lipoprotein (HDL) cholesterol (HDL-C) ≤35 mg/dL (≤0.91 mmol/L) and/or a triglyceride level ≥250 mg/dL (≥2.83 mmol/L); history of gestational diabetes mellitus (GDM) (see Classification of Diabetes below) or delivery of a baby weighing >9 lb (>4 kg); history of vascular disease; presence of acanthosis nigricans; and polycystic ovary disease.5
![]() The prevalence of type 2 DM increases with age and varies widely among various racial and ethnic populations. The prevalence of type 2 DM is especially increased in Native Americans, Hispanic Americans, Asian Americans, African Americans, and Pacific Islanders. While the prevalence of type 2 DM increases with age, the disorder is increasingly being diagnosed in adolescence. Much of the rise in adolescent type 2 DM is related to an increase in overweight/obesity and sedentary lifestyle, in addition to genetic predisposition.6 Most cases of type 2 DM are polygenetic; the underlying pathophysiology remains uncertain7 (Figs. 57-1 and 57-2).
The prevalence of type 2 DM increases with age and varies widely among various racial and ethnic populations. The prevalence of type 2 DM is especially increased in Native Americans, Hispanic Americans, Asian Americans, African Americans, and Pacific Islanders. While the prevalence of type 2 DM increases with age, the disorder is increasingly being diagnosed in adolescence. Much of the rise in adolescent type 2 DM is related to an increase in overweight/obesity and sedentary lifestyle, in addition to genetic predisposition.6 Most cases of type 2 DM are polygenetic; the underlying pathophysiology remains uncertain7 (Figs. 57-1 and 57-2).
FIGURE 57-1 National Health and Nutrition Evaluation Survey (NHANES) prevalence of diabetes by age among adults ≥20 years of age: United States, 2005–2008. (Centers for Disease Control and Prevention, 2011 National Diabetes Fact Sheet at http://www.cdc.gov/diabetes/pubs/estimates11.htm.)
FIGURE 57-2 Rate of new cases of type 1 and type 2 diabetes among youth aged <20 years, by race/ethnicity, 2002–2005. (NHW, non-Hispanic whites; NHB, non-Hispanic blacks; H, Hispanics; API, Asians/Pacific Islanders; AI, American Indians.) (Centers for Disease Control and Prevention, 2011 National Diabetes Fact Sheet at http://www.cdc.gov/diabetes/pubs/estimates11.htm.)
GDM complicates approximately 7% of all pregnancies in the United States.8 Most women become normoglycemic after pregnancy; however, 30% to 50% may develop prediabetes or type 2 DM later in life.
PATHOGENESIS, DIAGNOSIS, AND CLASSIFICATION
Classification of Diabetes
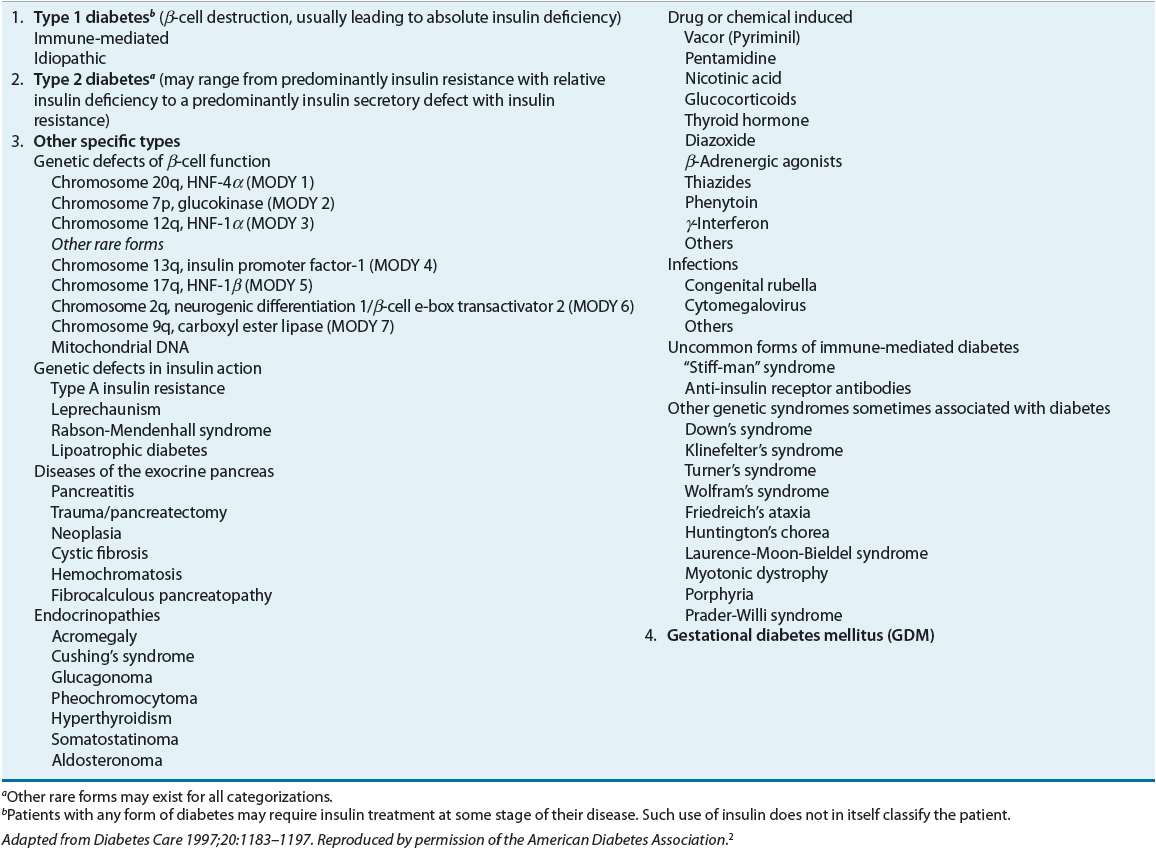
Diabetes is a metabolic disorder characterized by resistance to the action of insulin, insufficient insulin secretion, or both.2 The clinical manifestation of these disorders is hyperglycemia. The vast majority of diabetic patients are classified into one of two broad categories: type 1 diabetes caused by an absolute deficiency of insulin or type 2 diabetes defined by the presence of insulin resistance with an inadequate compensatory increase in insulin secretion. Women who develop diabetes due to the stress of pregnancy are classified as having gestational diabetes. Finally, uncommon types of diabetes caused by infections, drugs, endocrinopathies, pancreatic destruction, and known genetic defects are classified separately (Table 57-1).
TABLE 57-1 Etiologic Classification of Diabetes Mellitusa
Type 1 Diabetes
![]() This form of diabetes results from autoimmune destruction of the β cells of the pancreas. Evidence of β-cell autoimmunity, including ICAs, antibodies to glutamic acid decarboxylase, islet protein tyrosine phosphatase-like molecule IA2, and/or antibodies to insulin, is present at the time of diagnosis in 90% of individuals. Type 1 diabetes is often thought to most commonly present in children and adolescents; however, it can occur at any age. Younger individuals typically have a more rapid rate of β-cell destruction and often present with ketoacidosis. Adults may maintain sufficient insulin secretion to prevent ketoacidosis for many years; this is referred to as latent autoimmune diabetes in adults.3,4
This form of diabetes results from autoimmune destruction of the β cells of the pancreas. Evidence of β-cell autoimmunity, including ICAs, antibodies to glutamic acid decarboxylase, islet protein tyrosine phosphatase-like molecule IA2, and/or antibodies to insulin, is present at the time of diagnosis in 90% of individuals. Type 1 diabetes is often thought to most commonly present in children and adolescents; however, it can occur at any age. Younger individuals typically have a more rapid rate of β-cell destruction and often present with ketoacidosis. Adults may maintain sufficient insulin secretion to prevent ketoacidosis for many years; this is referred to as latent autoimmune diabetes in adults.3,4
Type 2 Diabetes
![]() Type 2 DM is characterized by a combination of some degree of insulin resistance and a relative lack of insulin secretion (being insufficient to normalize plasma glucose levels), with progressively lower insulin secretion over time. Most individuals with type 2 diabetes exhibit abdominal obesity, which itself causes insulin resistance. In addition, hypertension, dyslipidemia (high triglyceride levels and low HDL-C levels), and elevated plasminogen activator inhibitor-1 (PAI-1) levels, which contribute to a hypercoagulable state, are often present in these individuals. Due in part to these factors, patients with type 2 diabetes are at increased risk of developing macrovascular complications in addition to microvascular complications. Type 2 diabetes has a strong genetic predisposition and is more common in all ethnic groups other than those of European ancestry.4,5
Type 2 DM is characterized by a combination of some degree of insulin resistance and a relative lack of insulin secretion (being insufficient to normalize plasma glucose levels), with progressively lower insulin secretion over time. Most individuals with type 2 diabetes exhibit abdominal obesity, which itself causes insulin resistance. In addition, hypertension, dyslipidemia (high triglyceride levels and low HDL-C levels), and elevated plasminogen activator inhibitor-1 (PAI-1) levels, which contribute to a hypercoagulable state, are often present in these individuals. Due in part to these factors, patients with type 2 diabetes are at increased risk of developing macrovascular complications in addition to microvascular complications. Type 2 diabetes has a strong genetic predisposition and is more common in all ethnic groups other than those of European ancestry.4,5
Gestational Diabetes Mellitus
GDM is defined as glucose intolerance that is first recognized during pregnancy. Hormone changes during pregnancy result in increased insulin resistance, and GDM may ensue when the mother cannot adequately compensate with increased insulin secretion to maintain normoglycemia. In most, glucose intolerance occurs near the beginning of the third trimester, although risk assessment and intervention when appropriate should begin from the first prenatal visit due to the risk of undiagnosed diabetes. If DM is diagnosed prior to pregnancy, this is not GDM, but rather pregnancy with preexisting DM. Clinical detection is important, as therapy will reduce perinatal morbidity and mortality.2
Other Specific Types of Diabetes (<5% of Diabetes)
Genetic Defects MODY is characterized by impaired insulin secretion in response to a glucose stimulus with minimal or no insulin resistance. Patients typically exhibit mild hyperglycemia at an early age, but diagnosis may be delayed, depending on the severity of presentation. The disease is inherited in an autosomal dominant pattern with at least six different loci identified to date (MODY 2 and 3 are most common). The production of mutant insulin molecules has been identified in a few families and results in mild glucose intolerance.2
Several genetic mutations have been described in the insulin receptor and are associated with insulin resistance. Type A insulin resistance refers to the clinical syndrome of acanthosis nigricans, virilization in women, polycystic ovaries, and hyperinsulinemia. In contrast, anti-insulin receptor antibodies may block the binding of insulin. This was referred to in the past as type B insulin resistance. Endocrinopathies, pancreatic exocrine dysfunction, drugs, and infections, among others, may also result in hyperglycemia (Table 57-1).
Screening
Type 1 Diabetes Mellitus
The prevalence of type 1 DM is low in the general population. Due to the acute onset of symptoms in most individuals at time of diagnosis, screening for type 1 DM in the asymptomatic general population is not recommended.5 Screening for β-cell autoantibody status in high-risk family members may be appropriate; however, such screening is most often recommended in the context of clinical trials for the prevention of type 1 DM.
Type 2 Diabetes Mellitus
The American Diabetes Association (ADA) recommends screening for type 2 DM at any age in individuals who are overweight (BMI ≥25 kg/m2) and have at least one other risk factor for the development of type 2 DM. Risk factors, in addition to being overweight or obese, include physical inactivity, first-degree relative with diabetes or high-risk ethnicity/race, women who have delivered a baby >9 lb (>4 kg) or a history of GDM, hypertension, high triglycerides, low HDL, women with polycystic ovary syndrome, diagnosed with prediabetes, acanthosis nigricans, or a history of cardiovascular disease (CVD; see also Epidemiology above). The recommended screening test is the fasting plasma glucose (FPG), HbA1c, or 2-hour oral glucose tolerance test (OGTT). Adults without risk factors should be screened starting at age 45 years, as age itself is a risk factor for type 2 DM. The optimal time between screenings is not known, and the index of suspicion for the presence of diabetes should guide the clinician. Repeat testing every 3 to 5 years is cost-effective.5
Children and Adolescents
Despite a lack of clinical evidence to support widespread testing of children for type 2 DM, it is clear that more children and adolescents are developing type 2 DM. The ADA, by expert opinion, recommends that overweight (defined as BMI >85th percentile for age and sex, weight for height >85th percentile, or weight >120% of ideal) youths with at least two of the following risk factors: a family history of type 2 diabetes in first- and second-degree relatives; Native Americans, African Americans, Hispanic Americans, and Asians/South Pacific Islanders; those with signs of insulin resistance or conditions associated with insulin resistance (acanthosis nigricans, hypertension, dyslipidemia, polycystic ovary syndrome, or small-for-gestational-age birth weight); or maternal history of diabetes or GDM during the child’s gestation be screened. Screening should be done every 3 years starting at 10 years of age or at the onset of puberty if it occurs at a younger age.5
Gestational Diabetes
Risk assessment for GDM should occur at the first prenatal visit. Due to the increasing incidence of obesity and undiagnosed DM, it is reasonable to screen women with risk factors for the development of diabetes as soon as feasible. If the initial screening is negative, they should undergo retesting at 24 to 28 weeks’ gestation. Screening for GDM is done with a standard 75-g OGTT. The diagnosis of GDM is confirmed when any one plasma glucose value measured at baseline (fasting), 1 hour, or 2 hours meets the diagnostic criteria. These criteria are unique to GDM (Table 57-2).2,5,8
Diagnosis of Diabetes
![]() The diagnosis of diabetes requires the identification of a glycemic cut point, which discriminates normals from diabetic patients. The cut points are meant to reflect the level of glucose above which microvascular complications have been shown to increase. Cross-sectional studies have shown a consistent increase in the risk of developing retinopathy at a fasting glucose level above 99 to 116 mg/dL (5.5 to 6.4 mmol/L), a 2-hour postprandial level above 125 to 185 mg/dL (6.9 to 10.3 mmol/L), and a HbA1c above 5.9% to 6.0%. (0.059 to 0.060; 41 to 42 mmol/mol Hb). Current diagnostic criteria are slightly above these cut points (Table 57-3).2
The diagnosis of diabetes requires the identification of a glycemic cut point, which discriminates normals from diabetic patients. The cut points are meant to reflect the level of glucose above which microvascular complications have been shown to increase. Cross-sectional studies have shown a consistent increase in the risk of developing retinopathy at a fasting glucose level above 99 to 116 mg/dL (5.5 to 6.4 mmol/L), a 2-hour postprandial level above 125 to 185 mg/dL (6.9 to 10.3 mmol/L), and a HbA1c above 5.9% to 6.0%. (0.059 to 0.060; 41 to 42 mmol/mol Hb). Current diagnostic criteria are slightly above these cut points (Table 57-3).2
TABLE 57-3 Criteria for the Diagnosis of Diabetes Mellitusa
The HbA1c was not recommended in the past due to many nonstandardized assays. Most laboratories now use a method that is National Glycohemoglobin Standardization Program (NGSP) certified and standardized to the Diabetes Control and Complications Trial (DCCT) assay, which allows for cross-application of their results. If standardized, the HbA1c is logical for the diagnosis of diabetes as it measures glycemic exposure over the past 2 to 3 months, in contrast to a single-day, single-point glucose evaluation. In addition, patients do not have to be fasting and the test is easily monitored. An HbA1c of 6% to 6.4% (0.060 to 0.066; 42 to 46 mmol/mol Hb) denotes a 10-fold increase in risk of diabetes, yet does not consistently identify patients with IFG or IGT. In addition, there are slight race differences in normal HbA1c levels. One-third fewer individuals with diabetes are identified using the A1C ≥6.5% (≥0.065; ≥48 mmol/mol Hb) versus a FPG ≥126 mg/dL (≥7 mmol/L), yet more providers may be more likely to diagnose diabetes from an A1C than from an obviously elevated FPG level. The ADA continues to recommend three other glucose criteria for the diagnosis of DM in nonpregnant adults (Table 57-3). If the patient has obvious hyperglycemia and diabetes, reconfirming the diagnosis by one of the above criteria is not required.2
Increased Risk of Diabetes or Prediabetes
As shown in Table 57-4, the ADA identified a HbA1c value of 5.7% to 6.4% (0.057 to 0.064; 39 to 46 mmol/mol Hb) to define an increased risk for diabetes. The HbA1c lower limit of 5.7% (0.057; 39 mmol/mol Hb) was chosen due to its good specificity, although it has a low sensitivity, to identify patients at increased risk for diabetes. IFG continues to be defined as a plasma glucose of at least 100 mg/dL (5.6 mmol/L) but less than 126 mg/dL (7 mmol/L). IGT is defined as a 2-hour glucose value ≥140 mg/dL (≥7.8 mmol/L), but less than 200 mg/dL (11.1 mmol/L) during a 75-g OGTT.2,5
TABLE 57-4 Categorizations of Abnormal Glucose Status
Serial measurements, at clinician-defined intervals, can help to identify patients moving toward diabetes, and those who are stable. Patients who have even minor increases in glucose or HbA1c values over time should be followed closely. Also, the HbA1c measurement can be affected by anemias and several hemoglobinopathies, which necessitates the use of one of the plasma glucose criterion in these individuals.
Pathogenesis
Type 1 Diabetes Mellitus
Type 1 DM results from pancreatic β-cell failure with “absolute” deficiency of insulin secretion. Most often this is due to immune-mediated destruction of pancreatic β cells, but rare unknown or idiopathic processes may also contribute. There often is a long preclinical period of immune-mediated β-cell destruction later followed by onset of hyperglycemia when 80% to 90% of the β cells have been destroyed. Occasionally there is a period of transient remission called the “honeymoon” phase, before established disease develops along with the requirement for lifelong insulin therapy and the potential risk of diabetes-related complications (Fig. 57-3).
FIGURE 57-3 Scheme of the natural history of the β-cell defect in type 1 diabetes mellitus. (Copyright © 2008 American Diabetes Association. From Medical Management of Type 1 Diabetes, 5th ed. Reprinted with permission from the American Diabetes Association.)
It is thought that in order for type 1 DM to develop, there must be a trigger in a genetically susceptible individual. However, it is unknown whether there are one or more inciting factors such as cow’s milk (or lack of breast-feeding), or viral, dietary, or other environmental exposures that initiate the autoimmune process.2,3 Vitamin D deficiency has been observed to be more prevalent in patients who develop type 1 DM; however, further study is needed to confirm a role in causation.9
The autoimmune process is mediated by macrophages and T lymphocytes with circulating autoantibodies to various β-cell antigens. The most commonly detected antibody associated with type 1 DM is the ICA. Other autoantibodies include insulin, glutamic acid decarboxylase 65, and zinc transporter 8 (ZnT8). These antibodies are generally considered markers of disease rather than mediators of β-cell destruction. They have been used to identify individuals at risk for type 1 DM and in evaluating disease prevention strategies.3
More than 90% of newly diagnosed persons with type 1 DM have one of these antibodies, as will up to 4% of unaffected first-degree relatives. Once insulin autoantibodies are detected, there is an increased risk of development of additional autoantibodies and progression to diabetes. β-Cell autoimmunity may precede the diagnosis of type 1 DM by up to 9 to 13 years. Autoimmunity may remit in some individuals, or can progress to absolute β-cell failure in others. Other autoimmune disorders frequently associated with type 1 DM include Hashimoto’s thyroiditis, Graves’ disease, Addison’s disease, vitiligo, and celiac sprue. The extent of involvement can range from no other associated disorders to autoimmune polyglandular failure.
There are strong genetic linkages to the DQA and B genes and certain human leukocyte antigens (HLAs). Some are associated with increased risk (DR3 and DR4) while others are protective (DRB1*04008-DQB1*0302 and DRB1*0411-DQB1*0302) on chromosome 6.10 Additional candidate gene regions have been identified on other chromosomes as well. Because twin studies do not show 100% concordance, environmental factors such as infectious, chemical, and dietary agents likely also contribute to the expression of the disease.
The autoimmune destruction of pancreatic β-cell function results in hyperglycemia due to an absolute deficiency of insulin. Insulin lowers blood glucose (BG) by a variety of mechanisms, including stimulation of tissue glucose uptake, suppression of glucose production by the liver, and suppression of free fatty acid (FFA) release from fat cells.11 The suppression of FFAs plays an important role in glucose homeostasis. Increased levels of FFAs inhibit the uptake of glucose by muscle and stimulate hepatic gluconeogenesis.12
Type 2 Diabetes Mellitus
Normal Metabolism In the fasting state 75% of total body glucose disposal takes place in non–insulin-dependent tissues such as the brain, neurons, and others. Brain glucose uptake occurs at the same rate during fed and fasting periods. The remaining 25% of glucose metabolism takes place in the liver and muscle, which is dependent on insulin. In the fasting state approximately 85% of glucose production is derived from the liver, and the remaining amount is produced by the kidney. Glucagon, produced by pancreatic α cells, is secreted in the fasting state to oppose the action of insulin and stimulate hepatic glucose production and glycogenolysis. Glucagon and insulin secretion are closely linked; one increases while the other decreases to keep plasma glucose levels normal. In the fed state, carbohydrate ingestion increases the plasma glucose concentration and stimulates insulin release from the pancreatic β cells. The resultant hyperinsulinemia (a) suppresses hepatic glucose production, (b) stimulates glucose uptake by peripheral tissues, and (c) suppresses glucagon release (in conjunction with incretin hormones). The majority (~80% to 85%) of glucose is taken up by muscle, with only a small amount (~4% to 5%) being metabolized by adipocytes.7,13,14
Although fat tissue is responsible for only a small amount of total body glucose disposal, it plays a very important role in the maintenance of total body glucose homeostasis. Small increments in the plasma insulin concentration exert a potent antilipolytic effect, leading to a marked reduction in the plasma FFA levels. The decline in plasma FFA concentrations results in an increased glucose uptake in muscle and reduces hepatic glucose production indirectly.
Type 2 Diabetes Individuals are characterized by multiple defects including (a) defects in insulin secretion; (b) insulin resistance involving muscle, liver, and the adipocyte; (c) excess glucagon secretion; (d) glucagon-like peptide-1 (GLP-1) deficiency and possibly resistance.7
Impaired Insulin Secretion The pancreas in people with a normal-functioning β cell is able to adjus its secretion of insulin to maintain normal plasma glucose levels. In nondiabetic individuals, insulin increases in proportion to the severity of the insulin resistance and plasma glucose remains normal. Impaired insulin secretion is a hallmark finding in T2DM. In early β-cell dysfunction, first-phase insulin release, seen with an IV bolus of glucose, is deficient. First-phase insulin is released if there is stored insulin in the β cell and acts to “prime” the liver to nutrient intake. Absent first-phase insulin necessitates an increase in second-phase insulin to compensate for hyperglycemia. When the insulin released can no longer normalize plasma glucose, dysglycemia, including prediabetes and diabetes, can ensue. Both β-cell mass and function in the pancreas are reduced. β-Cell failure is progressive, and starts years prior to the diagnosis of diabetes. People with T2DM lose ~5% to 7% of β-cell function per year of diabetes. The reasons for this loss are likely multifactorial including (a) glucose toxicity; (b) lipotoxicity; (c) insulin resistance; (d) age; (e) genetics; and (f) incretin deficiency. Age results in declining β-cell responsiveness and possibly mass. β-Cell failure predisposition is also present in high-risk ethnicity/races. Glucotoxicity involves glucose levels chronically exceeding 140 mg/dL (7.8 mmol/L). The β cell is unable to maintain elevated rates of insulin secretion, and releases less insulin as glucose levels increase (Fig. 57-4).7,13,14
FIGURE 57-4 The relationship between fasting plasma insulin and fasting plasma glucose in 177 normal-weight individuals. Plasma insulin and glucose increase together up to a fasting glucose of 140 mg/dL (7.8 mmol/L). When the fasting glucose exceeds 140 mg/dL (7.8 mmol/L), the β cell makes progressively less insulin, which leads to an overproduction of glucose by the liver and results in a progressive increase in fasting glucose. (Reprinted from DeFronzo RA. Pathogenesis of type 2 diabetes mellitus. Med Clin N Am 2004;88:787–835, Copyright © 2004, with permission from Elsevier.)
Incretins In the type 2 diabetic patient, decreased postprandial insulin secretion is due to both impaired pancreatic β-cell function and a reduced stimulus for insulin secretion from gut hormones. The role gut hormones play in insulin secretion is best shown by comparing the insulin response to an oral glucose load versus an isoglycemic IV glucose infusion. In nondiabetic control individuals 73% more insulin is released in response to an oral glucose load compared with reproducing the oral glucose load’s plasma glucose curve by giving IV glucose. This increased insulin secretion in response to an oral glucose stimulus is referred to as “the incretin effect” and suggests that gut-derived hormones when stimulated by glucose lead to an increase in pancreatic insulin secretion. In type 2 diabetic patients, this “incretin effect” is blunted, with the increase in insulin secretion only being 50% of that seen in nondiabetic control individuals. It is now known that two hormones, GLP-1 and glucose-dependent insulinotropic polypeptide (GIP), are responsible for over 90% of the increased insulin secretion seen in response to an oral glucose load. Patients with type 2 diabetes remain sensitive to GLP-1 while GIP levels are normal or elevated in T2DM.7
GLP-1 is secreted from the L cells, with the highest L-cell concentration in the distal intestinal mucosa, in response to mixed meals. Since GLP-1 levels rise within minutes of food ingestion, neural signals and possibly proximal GI tract receptors stimulate GLP-1 secretion. The insulinotropic action of GLP-1 is glucose dependent, and for GLP-1 to enhance insulin secretion, glucose concentrations must be higher than 90 mg/dL (5 mmol/L). In addition to stimulating insulin secretion, GLP-1 suppresses glucagon secretion, slows gastric emptying, and reduces food intake by increasing satiety. These effects of GLP-1 combine to limit postprandial glucose excursions. GIP is secreted by K cells in the intestine and may have a role with insulin secretion during near-normal glucose levels and may act as an insulin sensitizer in adipocytes. However, GIP has no effect on glucagon secretion, gastric motility, or satiety. The half-lives of GLP-1 and GIP are short (<10 minutes). Both hormones are rapidly inactivated by removal of two N-terminal amino acids by the enzyme dipeptidyl peptidase-4 (DPP-4). GLP-1 levels appear to decrease as glucose values increase from normal to type 2 DM, and it is unlikely to be a primary defect that causes diabetes in the majority of T2DM. Genetically a minority may have the TCF7L2 gene defect, which is associated with a decreased response to GLP-1.7
Insulin Resistance
Liver In type 2 diabetic subjects with mild to moderate fasting hyperglycemia (140 to 200 mg/dL, 7.8 to 11.1 mmol/L), basal hepatic glucose production is increased by ~0.5 mg/kg/min. Consequently, during the overnight sleeping hours the liver of an 80-kg diabetic individual with modest fasting hyperglycemia adds an additional 35 g of glucose to the systemic circulation. This increase in fasting hepatic glucose production is the cause of fasting hyperglycemia.13,14
Following glucose ingestion, insulin is secreted into the portal vein and carried to the liver, where it reduces hepatic glucose output. T2DM patients also fail to suppress glucagon in response to a meal and may even have a paradoxical rise in glucagon levels. Thus, hepatic insulin resistance and hyperglucagonemia result in continued production of glucose by the liver. Therefore, T2DM patients have two sources of glucose in the postprandial state: one from the diet and one from continued glucose production from the liver. These sources of glucose may result in marked hyperglycemia.
Peripheral (Muscle) Muscle is the major site of postprandial glucose disposal in humans, and approximately 80% of total body glucose uptake occurs in skeletal muscle. In response to a physiologic increase in plasma insulin concentration, muscle glucose uptake increases linearly, reaching a plateau value of 10 mg/kg/min. Even in lean T2DM, the onset of insulin action is delayed for ~40 minutes, and the ability of insulin to stimulate leg glucose uptake is reduced by 50%. Impaired intracellular insulin signaling is a well-established abnormality, with notable impairments at almost every step of activation due to insulin resistance, lipotoxicity, and glucotoxicity. The compensatory hyperinsulinemia required to overcome impaired insulin signaling (insulin resistance) can activate an alternative pathway through MAP kinase, which may be involved in atherosclerosis. Mitochondrial dysfunction may also play a role in muscle insulin resistance. Mitochondrial function and/or density appear to be lower in type 2 DM. This may result in less energy expenditure and an increased risk of dysfunction with high-fat diets (Fig. 57-5).13,14
FIGURE 57-5 Whole-body glucose disposal, a measure of insulin resistance, is reduced 40% to 50% in obese nondiabetic and lean type 2 diabetic individuals. Obese diabetic individuals are slightly more resistant than lean diabetic patients. (From DeFronzo RA. Diabetes Reviews 1977;5:177–269.)
Peripheral (Adipocyte) In obese nondiabetic and T2DM, basal plasma FFA levels are increased and fail to suppress normally after glucose ingestion. FFAs are stored as triglycerides in adipocytes and serve as an important energy source during conditions of fasting. Insulin is a potent inhibitor of lipolysis, and restrains the release of FFAs from the adipocyte by inhibiting the hormone-sensitive lipase enzyme. It is now recognized that chronically elevated plasma FFA concentrations can lead to insulin resistance in muscle and liver, and impair insulin secretion. In addition to FFAs that circulate in plasma in increased amounts, T2DM patients have increased stores of intracellular fat products in muscle and liver, and the increased fat content correlates closely with the presence of insulin resistance in these tissues. Excess lipolysis from fat can also contribute to gluconeogenesis indirectly through glycerol and FFAs.7,13,14
Cellular Mechanisms of Insulin Resistance
Obesity and Insulin Resistance Weight gain leads to insulin resistance in most, and obese nondiabetic individuals with risk factors often have the same degree of insulin resistance as lean T2DM patients. Subsets of obese, but metabolically normal patients (6% to 30%) do exist, as well as nonobese, but metabolically abnormal patients, so broad categorization of risk for a patient needs to be confirmed by further examination.
The term visceral adipose tissue (VAT) refers to fat cells located within the abdominal cavity and includes omental, mesenteric, retroperitoneal, and perinephric adipose tissue. VAT has been shown to correlate with insulin resistance and explain much of the variation in insulin resistance seen. It represents 20% of fat in men and 6% of fat in women. Central obesity can be easily assessed using waist circumference, which is a good surrogate marker for VAT. This fat tissue has been shown to have a higher rate of lipolysis than subcutaneous fat, resulting in an increase in FFA production. These fatty acids are released into the portal circulation and drain into the liver, where they stimulate the production of very-low-density lipoproteins and decrease insulin sensitivity in peripheral tissues.13,14
VAT also produces a number of adipocytokines, such as TNF-α, interleukin 6, angiotensinogen, PAI-1, and resistin, which contribute to insulin resistance, hypertension, and hypercoagulability. These factors drain into the portal circulation and reduce insulin sensitivity in peripheral tissues. The fat cell also has the capability of producing at least one adipocytokine that improves insulin sensitivity: adiponectin. This factor is made in decreasing amounts as an individual becomes more obese. In animal models, adiponectin decreases hepatic glucose production and increases fatty acid oxidation in muscle.
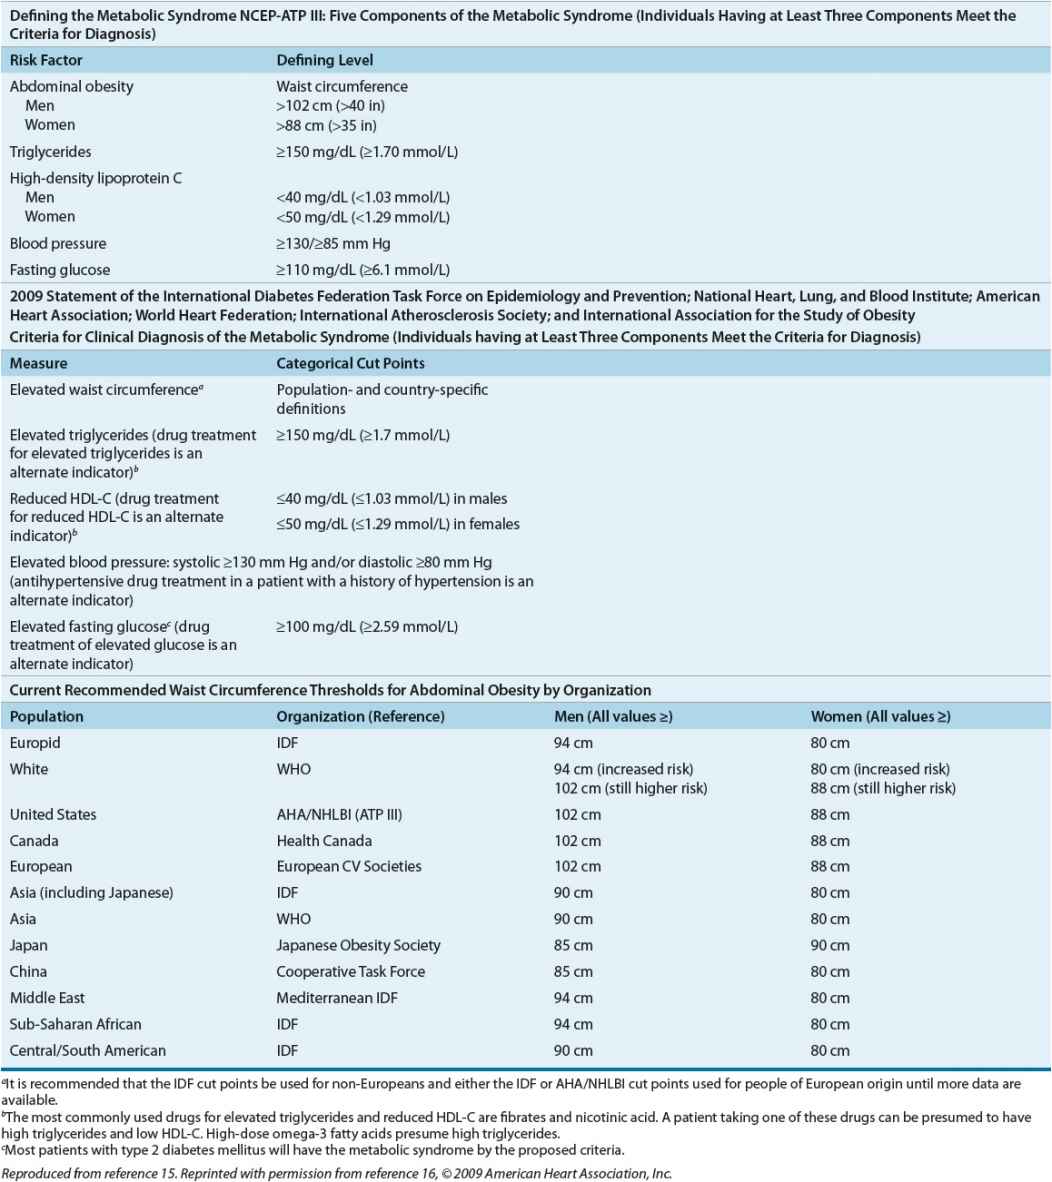
The Metabolic Syndrome The metabolic syndrome is a risk indicator, but not an absolute risk indicator, because it does not specifically account for all risk factors, such as age, sex, and low-density lipoprotein cholesterol (LDL-C) levels, or directly measure hypercoagulability of the proinflammatory condition. Patients with metabolic syndrome do have a higher risk for CVD, and at least a fivefold increase in their risk of type 2 DM, if they do not already have type 2 DM. The metabolic syndrome does not identify synergism among identified risk factors, but rather additive risk, leading many to question its relevance above adequate risk factor identification and aggressive treatment. It may be useful to certain clinicians to “package” risk factors into the metabolic syndrome to encourage aggressive management.
The most recent definition of metabolic syndrome was adopted by multiple organizations in 2009 (Table 57-5).15,16
TABLE 57-5 Defining the Metabolic Syndrome
Clinical Controversy…
CLINICAL PRESENTATION
The clinical presentations of type 1 DM and type 2 DM are very different. Autoimmune type 1 DM can occur at any age. Approximately 75% will develop the disorder before age 20 years, but the remaining 25% develop the disease as adults. Individuals with type 1 DM are often thin and are prone to develop diabetic ketoacidosis (DKA) if insulin is withheld, or under conditions of severe stress with an excess of insulin counterregulatory hormones.2,3,5 Symptoms in patients with type 1 DM such as polyuria, polydipsia, polyphagia, weight loss, and lethargy accompanied by hyperglycemia are the most common initial presentation. In the outpatient setting, many patients initially present with vague complaints such as weight loss and fatigue. Polyuria, polydipsia, and polyphagia may not be apparent unless a comprehensive history is taken. Twenty percent to 40% of patients with type 1 DM present with DKA after several days of polyuria, polydipsia, polyphagia, and weight loss. This presentation is common in patients from a low socioeconomic background. Rarely, type 1 DM patients are diagnosed without multiple symptoms or DKA when they have blood tests drawn for other reasons. This rare presentation typically occurs when patients have a first-degree family member with type 1 DM and are closely monitored.
CLINICAL PRESENTATION Diabetes Mellitusa
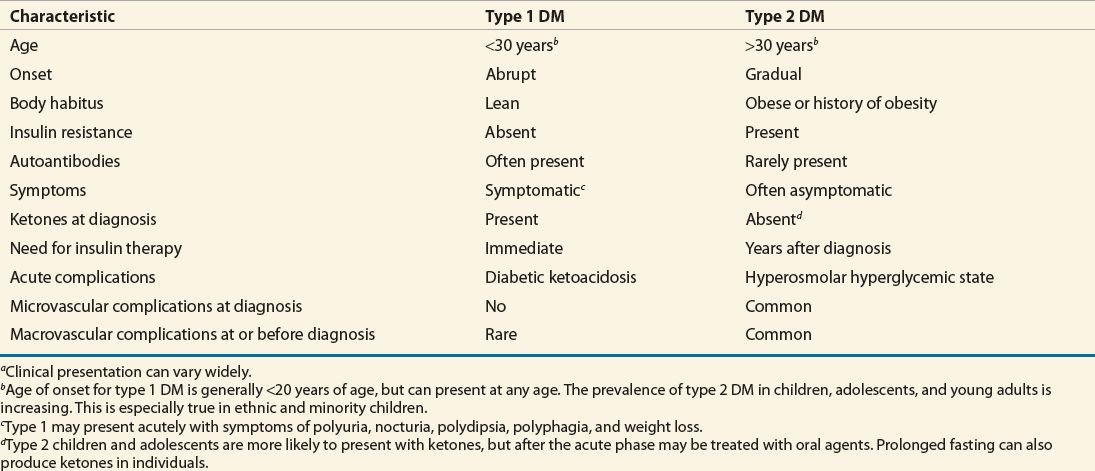
Patients with type 2 DM often present without symptoms, even though complications tell us that they may have been hyperglycemic for several years.10 Often these patients are diagnosed secondary to unrelated blood testing. Lethargy, polyuria, nocturia, and polydipsia can be seen at diagnosis in type 2 diabetes, but significant weight loss at diagnosis is less common. More often, patients with type 2 DM are overweight or obese. Clinically, DM is a spectrum of diseases ranging from absolute insulin deficiency to relative insulin deficiency, and patients can have normal to grossly abnormal insulin sensitivity. Classical clinical presentation characteristics should be used in conjunction with other definitive laboratory data to properly classify patients (see also Classical Clinical Presentation of Diabetes Mellitus below).
TREATMENT
Diabetes Mellitus
Desired Outcome
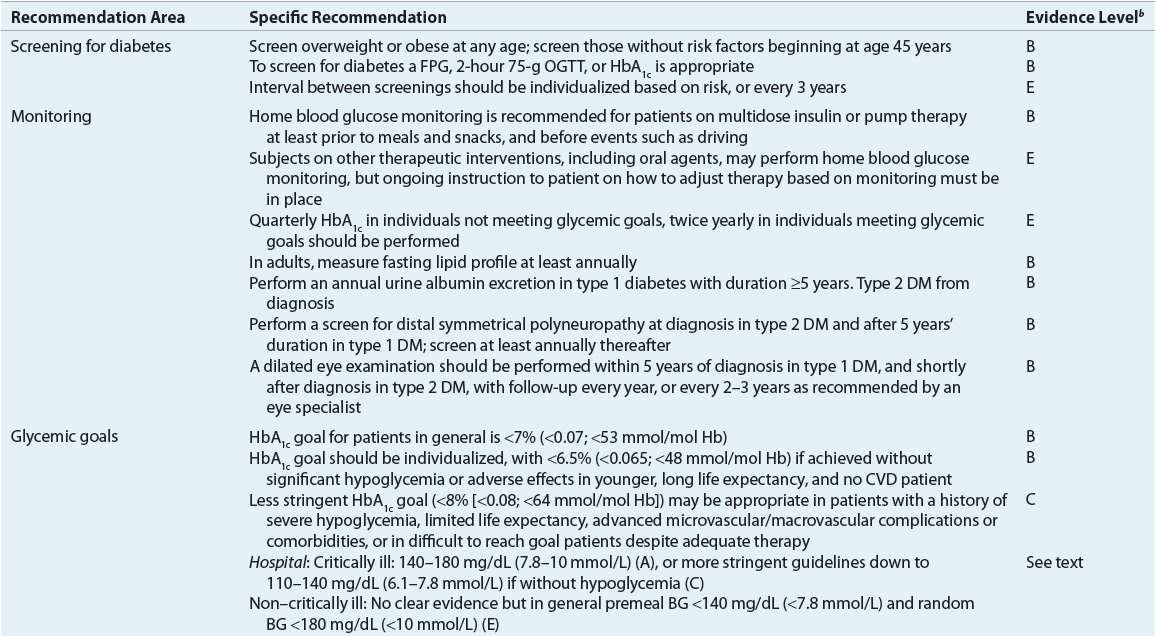
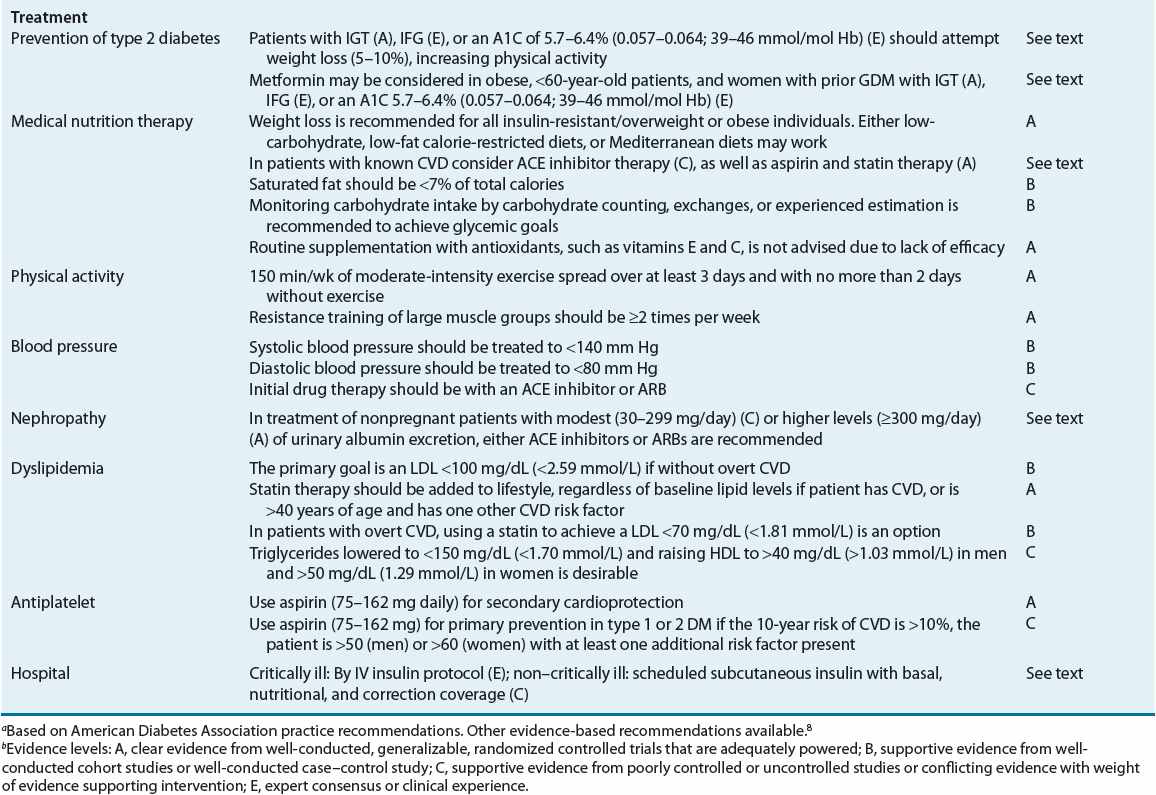
![]() The primary goals of DM management are to reduce the risk for microvascular and macrovascular disease complications, to ameliorate symptoms, to reduce mortality, and to improve quality of life.5 Early treatment with near-normal glycemia will reduce the risk for development of microvascular disease complications, but aggressive management of traditional cardiovascular risk factors (i.e., smoking cessation, treatment of dyslipidemia, intensive blood pressure control, and antiplatelet therapy) is needed to reduce the likelihood of development of macrovascular disease. Hyperglycemia not only increases the risk for microvascular disease but also contributes to poor wound healing, compromises white blood cell function, alters capillary function, and leads to classic symptoms of DM. DKA and hyperosmolar hyperglycemic state (HHS) are severe manifestations of poor diabetes control, almost always requiring hospitalization. Reducing the potential for microvascular complications is targeted by adherence to therapeutic lifestyle intervention (i.e., diet and exercise programs) and drug therapy regimens, as well as attaining blood pressure goals. Minimizing weight gain and hypoglycemia, especially severe hypoglycemia, and altering the glycemic goal to match the patient’s morbidities are necessary. Evidence-based guidelines, as published by the ADA, may help in the attainment of these goals (Table 57-6).5
The primary goals of DM management are to reduce the risk for microvascular and macrovascular disease complications, to ameliorate symptoms, to reduce mortality, and to improve quality of life.5 Early treatment with near-normal glycemia will reduce the risk for development of microvascular disease complications, but aggressive management of traditional cardiovascular risk factors (i.e., smoking cessation, treatment of dyslipidemia, intensive blood pressure control, and antiplatelet therapy) is needed to reduce the likelihood of development of macrovascular disease. Hyperglycemia not only increases the risk for microvascular disease but also contributes to poor wound healing, compromises white blood cell function, alters capillary function, and leads to classic symptoms of DM. DKA and hyperosmolar hyperglycemic state (HHS) are severe manifestations of poor diabetes control, almost always requiring hospitalization. Reducing the potential for microvascular complications is targeted by adherence to therapeutic lifestyle intervention (i.e., diet and exercise programs) and drug therapy regimens, as well as attaining blood pressure goals. Minimizing weight gain and hypoglycemia, especially severe hypoglycemia, and altering the glycemic goal to match the patient’s morbidities are necessary. Evidence-based guidelines, as published by the ADA, may help in the attainment of these goals (Table 57-6).5
TABLE 57-6 Selected American Diabetes Association Evidence-Based Recommendationsa
General Approach to Treatment
Appropriate care requires goal setting for glycemia, blood pressure, lipid levels (goals described later in chapter; see also Chaps. 3 and 11), regular monitoring for complications, dietary and exercise modifications, medications, appropriate self-monitoring of blood glucose (SMBG), and laboratory assessment of the aforementioned parameters.5 Glucose control alone does not sufficiently reduce the risk of macrovascular complications in persons with DM.22
Glycemic Goal Setting and Hemoglobin A1c
Controlled clinical trials provide ample evidence that glycemic control is paramount in reducing microvascular complications in both type 1 DM23 and type 2 DM.24 HbA1c measurements are the gold standard for following long-term glycemic control for the previous 2 to 3 months.5 Hemoglobinopathies, anemia, red cell membrane defects, transfusions, and substantial increase or decrease of red blood cell life span in a patient can affect HbA1c measurements. Identification of potential problems and then ensuring the test is performed in a laboratory using a method that is NGSP certified and standardized to the DCCT assay (see www.ngsp.org) will minimize issues. Other strategies such as measurement of fructosamine, which measures glycated plasma proteins or glycated albumin, may be necessary to assess diabetes control in patients with altered red blood cell life span, although they are less standardized, and not correlated to risk of complications.
The A1C-Derived Average Glucose study correlated multiple HbA1c and glucose readings to term the phrase estimated average glucose (eAG). The eAG better correlates with HbA1c readings, and now is regularly reported below HbA1c values on laboratory results. For example, a HbA1c of 6% or 7% (0.060 to 0.070; 42 to 53 mmol/mol Hb) correlates with an average glucose of 126 or 154 mg/dL (7 or 8.5 mmol/L), respectively, and online calculators and graphs are easily found.25
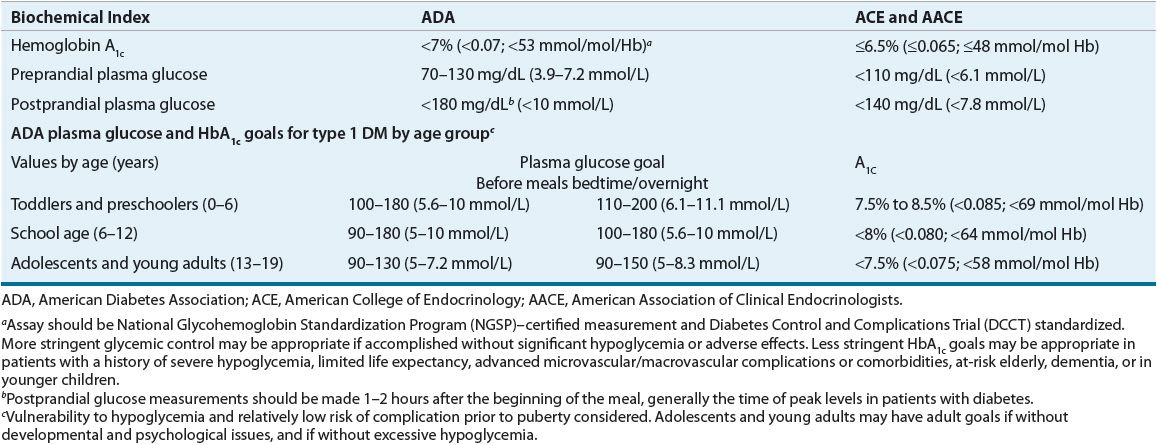
Less stringent HbA1c goals (>7% [>0.070; >53 mmol/mol Hb]) may be appropriate in patients with a history of severe hypoglycemia, limited life expectancy, advanced microvascular/macrovascular complications or comorbidities, at-risk elderly, dementia, or in younger children. A HbA1c target of <7% (<0.070; <0.53 mmol/mol Hb) is appropriate for others (Table 57-7), and lower values should be targeted if significant hypoglycemia, weight gain, and other adverse effects can be avoided.5 Glycemic control recommendations for different age groups of type 1 DM patients are based on the risk of hypoglycemia, the relatively low risk of complications prior to puberty, and psychological and/or developmental issues (Table 57-7).
Initial Evaluation of Diabetes Mellitus
On initial evaluation, a thorough medical history and identification of specific type of diabetes, including duration of diabetes, characteristics of onset (e.g., DKA or asymptomatic), dietary and weight history, education history, medication history including current and past medications for DM, current regimen including medications, diet, physical activity, and adherence, should be performed. Hospitalization history, hypoglycemia (frequency, cause, timing), and diabetes-related complications should be documented. Laboratory evaluation should include at a minimum an A1C, lipid profile, liver function tests, thyroid-stimulating hormone level, serum creatinine and electrolytes, and a urine analysis for microalbuminuria. In type 1 DM, consider screening for celiac disease by measuring tissue transglutaminase or antiendomysial antibodies. The physical examination and pertinent data should include all vital signs, weight and/or BMI, blood pressure assessment, thyroid palpation, cardiovascular and carotid auscultation, skin integrity, assessment for acanthosis nigricans, and a foot examination, including screening for impaired sensation detection with a 10-g force monofilament.5
Monitoring for Complications
The ADA recommends initiation of complications monitoring at the time of diagnosis of DM.8 Current recommendations continue to advocate yearly dilated eye examinations in type 2 DM, and an initial dilated eye examination in the first 3 to 5 years in type 1 DM, and then yearly thereafter. Less frequent testing (every 2 to 3 years) can be implemented on the advice of an eye care specialist. The blood pressure should be assessed at each visit. The feet should be examined at each visit for distal pulses, skin integrity, calluses, and deformities, and yearly screening should be done for loss of protective sensation with a distal polyneuropathy tool, such as the 10-g force Semmes-Weinstein monofilament. A urine test for microalbumin to screen for nephropathy once yearly from diagnosis is appropriate in type 2 DM, and initiated 5 years after diagnosis if the patient has type 1 DM. Yearly testing for lipid abnormalities, and more frequently if needed to achieve lipid goals, is recommended. It is generally accepted that a yearly thyroid-stimulating hormone level may be appropriate in type 1 DM, LADA, and select type 2 DM patients.5
Self-Monitored Blood Glucose and Continuous Glucose Monitoring
The advent of SMBG in the early 1980s revolutionized the treatment of DM, enabling patients to know their BG concentration at any moment easily and relatively inexpensively. At its core, SMBG is a tool to provide structure for a change and/or safety: change, in that the patient has an opportunity to intervene when a SMBG value is obtained, and safety, as hypoglycemia and hyperglycemia need to be avoided and/or identified and treated. In general, SMBG frequency should match how complicated the regimen is for glycemic control and minimally allow testing to avoid hypoglycemia.
Frequent SMBG is necessary to achieve near-normal BG concentrations if hypoglycemic agents are used. Assessment for hypoglycemia and hyperglycemia, adjustment of prandial doses of insulin, administration of corrective doses of insulin, change in diet and exercise, and checking accuracy of continuous glucose monitors are but a few of the reasons a patient may need SMBG at a given time. This is particularly true in patients with type 1 DM, as most will be intensively managed with insulin. The more intense the pharmacologic regimen is, the more intense the SMBG needs to be (before meals, at bedtime, occasionally after meals, and middle of sleep cycle in patients on multiple insulin injections or pump therapy whether type 1 or type 2 DM). The optimal frequency of SMBG for patients with type 2 DM on oral agents is unresolved.26 Frequency of monitoring in type 2 DM should be sufficient to facilitate reaching glucose goals and to test for hypoglycemia. The role of SMBG in improving glycemic control in type 2 DM patients is controversial, but has shown to reduce the HbA1c ~0.4% (~0.004; ~4 mmol/mol Hb) to no improvement. What is clear is that patients must be empowered to change their therapeutic regimen (lifestyle and medications) in response to test results, or no meaningful glycemic improvement is likely to be effected.5
Alternate site testing may improve adherence to SMBG recommendations, but only SMBG meters that can “sip” blood onto the strip will accommodate such testing. Alternate site glucose testing is performed on the palm, forearm, or the thigh. These areas tend to have less nerve endings and may be more comfortable for a patient, but several cautions must be observed. Interstitial glucose readings identified with alternative site testing will lag behind fingertip capillary blood, as the capillary flow/density is often less in the alternate testing sites when compared with that in the fingertip. Alternate site testing is discouraged in any situation where immediate action will be needed based on the glucose reading, such as testing for hypoglycemia or in patients with hypoglycemia unawareness, wide fluctuations in SMBG, or when the BG is known to be fluctuating, such as postprandially.
Choosing a meter for your patient depends most importantly on his or her dexterity, eye acuity, strip cost, and features that may be important to him or her. Demonstrate to and then have the patient confirm the monitoring technique to minimize problems. Each meter has specifications on hematocrit, elevation, whole blood versus plasma, and heat/cold tolerance. In addition, acetaminophen, ascorbate, dopamine, mannitol, and sugar-based products may alter testing results. Consult the manufacturer materials for specifics.
Continuous glucose monitoring (CGM) may be useful in select patients. CGM measures interstitial glucose, which lags behind capillary SMBG, and the same cautions as alternate site testing should be followed. CGM can be useful in patients with frequent hypoglycemia or hypoglycemic unawareness, nocturnal hypoglycemia, and for identification of fluctuating glucose patterns and/or previously unknown problems in patients with higher or lower than expected HbA1c results. CGM still needs to be calibrated after insertion of a new sensor and minimally every 12 hours with SMBG readings, alarms need to be properly set, and a new sensor must be placed every 3 to 7 days. The ADA currently recommends that CGM can be considered in type 1 DM adults ≥25 years of age, and those <25 years of age, if adherent to its use, and in others with the above issues noted.5
Nonpharmacologic Therapy
Diet
Medical nutrition therapy is recommended for all persons with DM and, along with activity, is a cornerstone of treatment.5 Paramount for all medical nutrition therapy is the attainment of optimal metabolic outcomes and the prevention and treatment of complications. It is imperative that patients understand the connection between carbohydrate intake, medications, and glucose control. For individuals with type 1 DM, the focus is on physiologically regulating insulin administration with a balanced diet to achieve and maintain a healthy body weight. A healthy meal plan that is moderate in carbohydrates and low in saturated fat (<7% of total calories), with a focus on balanced meals delivering all of the essential vitamins and minerals, is recommended in DM. The amount (grams) and type (via the glycemic index, though controversial) of carbohydrates, whether accounted for by exchanges or carbohydrate counting, should be considered. All foods can be fit into a healthy meal plan, and the days of recommending no sweets are in the past. If a healthy weight and normal glucose goals can be maintained, there is no reason to deny food choices. Overweight/obese patients with type 2 DM often require caloric restriction to promote weight loss, and portion size and frequency are often issues. The specific diet appears to be less important than if the patient will adhere to the diet, although low-fat diet for CVD or avoiding a high-protein diet in nephropathy may be appropriate. Rather than a set diabetic diet, advocate a diet using foods that are within the financial reach and cultural milieu of the patient. Discourage bedtime and between-meal snacks, set realistic goals for changes based on what the patient can/will change, and follow up to see how and if those changes occurred.27
Activity
In general, most patients with DM can benefit from increased activity.28 Aerobic exercise improves insulin sensitivity and modestly improves glycemic control in the majority of individuals, and reduces cardiovascular risk factors, contributes to weight loss or maintenance, and improves well-being. The patient should choose an activity that he or she is likely to continue. Start exercise slowly in previously sedentary patients. It remains unclear which asymptomatic patients should be screened for CVD prior to the beginning of an exercise regimen. Patients with long-standing disease (age >35 years, or >25 years old with DM ≥10 years), patients with multiple cardiovascular risk factors, presence of microvascular disease (especially renal disease), and patients with previous evidence of atherosclerotic disease should have a cardiovascular evaluation, probably including an electrocardiogram, with further workup related to CVD risk. In addition, several complications (uncontrolled hypertension, autonomic neuropathy, insensate feet, and retinopathy) may require restrictions on the activities recommended. Physical activity goals include at least 150 min/wk of moderate (50% to 70% maximal heart rate) intensity exercise spread over at least 3 days a week with no more than 2 days between activity. In addition, resistance/strength training, in patients without retinal contraindications, is recommended to be added into this exercise regimen at least two times a week.5
Pharmacologic Therapy
From the late 1970s to 1995, only two options for pharmacologic treatment were available for patients with diabetes: sulfonylureas (for type 2 DM only) and insulin (for type 1 or 2). Since 1995, a number of new oral agents, injectables, and insulins have been introduced in the United States.
The Look Action for Health in Diabetes (Look AHEAD) trial recently reported that no decrease in cardiovascular outcomes from intensive lifestyle changes in type 2 DM subjects was noted after 10 years of follow-up. In addition, intensive lifestyle was not able to obtain intensive glycemic control in the majority of subjects, reiterating the need for early diabetes medication use in conjunction with diet and exercise interventions.
Currently, nine classes of oral agents are approved for the treatment of type 2 diabetes: α-glucosidase inhibitors, biguanides, meglitinides, peroxisome proliferator–activated receptor γ (PPAR-γ) agonists (which are also commonly identified as thiazolidinediones [TZDs] or glitazones), DPP-4 inhibitors, dopamine agonists, bile acid sequestrants, sodium-glucose cotransporter 2 inhibitors, and sulfonylureas. Oral antidiabetic agents are often grouped according to their glucose-lowering mechanism of action. Biguanides and TZDs are often categorized as insulin sensitizers due to their ability to reduce insulin resistance. Sulfonylureas and meglitinides are often categorized as insulin secretagogues because they enhance endogenous insulin release. Three injectable classes, including insulin, GLP-1 receptor agonists, and amylinomimetics, are also available.
Drug Class Information
Insulin
Pharmacology Insulin is an anabolic and anticatabolic hormone. It plays major roles in protein, carbohydrate, and fat metabolism. Endogenously produced insulin is cleaved from the larger proinsulin peptide in the β cell to the active peptide of insulin and inactive C-peptide. All commercially available insulin preparations contain only the active insulin peptide.
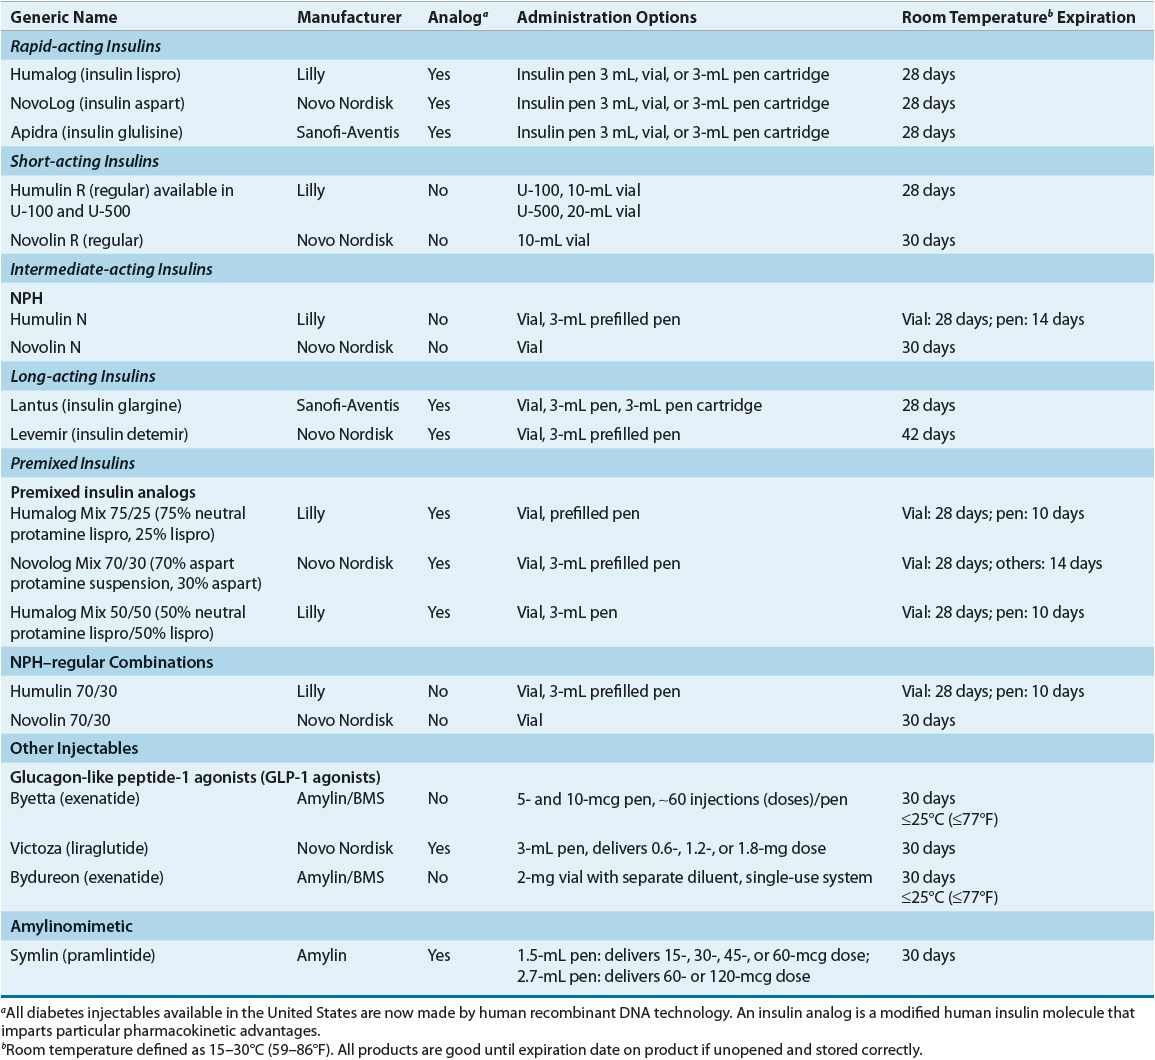
Characteristics Characteristics that are commonly used to categorize insulin preparations include source, strength, onset, and duration of action. Additionally, insulin may be characterized as analog, defined as insulin preparations that had amino acids within the insulin molecule modified and/or “modifiers” added to impart particular physiochemical and pharmacokinetic advantages. Table 57-8 summarizes available insulin preparations.
TABLE 57-8 Available Injectable and Insulin Preparations