and Miguel A. R. B. Castanho2
(1)
Instituto de Bioquímica Médica Leopoldo de Meis, Federal University of Rio de Janeiro, Rio de Janeiro, Rio de Janeiro, Brazil
(2)
Institute of Biochemistry and Institute of Molecular Medicine, School of Medicine, University of Lisbon, Lisbon, Portugal
The increase in the body weight in the world population has become one of the most important public health problems, as it is a major risk factor for several pathologies such as cardiovascular diseases and diabetes.
A systematic analysis evaluating the worldwide changes in the body mass index (BMI, defined as the body mass divided by the square of the height) was performed by the Global Burden of Metabolic Risk of Chronic Diseases Collaborating Group. They used health examination surveys and epidemiological studies from 199 countries and territories in the world, including 9.1 million participants, and showed that the mean worldwide BMI increased by 0.4 kg/m2 per decade for men and 0.5 kg/m2 per decade for women. Figure 11.1 shows the results of the percentage of the obese (BMI ≥ 30 kg/m2) or overweight (BMI ≥ 25 kg/m2) people, between 1980 and 2008, in distinct areas of the globe. It is clear that although there are some differences among the regions, the increase in body weight seems to be a global phenomenon.
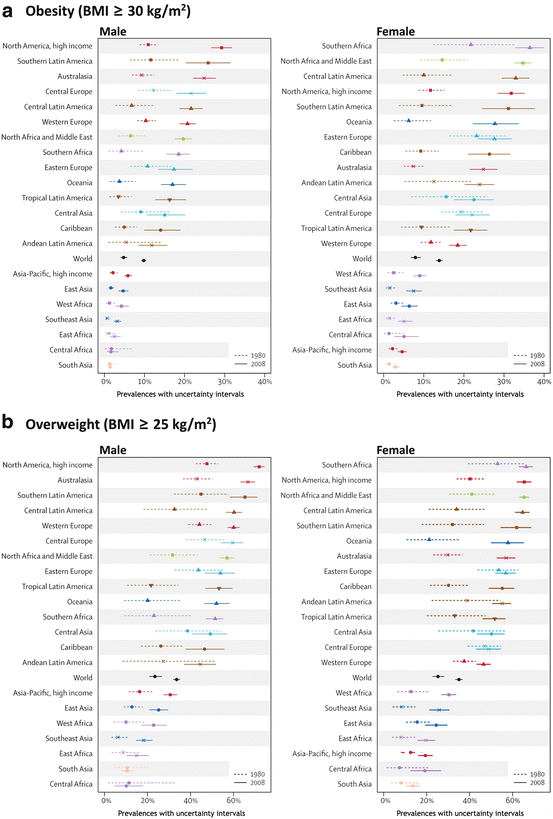

Fig. 11.1
Prevalence of obesity (a) or overweight (b) in 1980 and 2008 among males (left) and females (right) in different areas of the world (Reproduced from Finucane et al., Lancet 377:557–567, 2011, with permission from Elsevier)
Body weight is a result of the balance between food intake and energy expenditure. Several peripheral mediators secreted by different cells in the body act on the central nervous system , influencing the feeding behavior by controlling appetite or satiety, as well as regulating body energy expenditure by changing the metabolic rate and controlling thermogenesis. In this chapter we will discuss the mechanisms by which the body weight is controlled as well as the main proposals on how the impairment of this control may cause the modern metabolic diseases.
11.1 Humoral Control of Food Ingestion
Although eating is a complex behavior that involves distinct areas of the brain, including the sensory areas that process the information of food taste, smell, and appearance, and the cortex, which is responsible for the psychological component of the appetite and satiety, the hypothalamus may be seen as a central player in the control of feeding.
The hypothalamus is located below the thalamus, just above the brain stem, in the ventral part of the diencephalon (Fig. 11.2). Anatomically, it is divided in several regions; the following ones are directly involved in the control of energy balance: ARC, arcuate nucleus; VMH, ventromedial hypothalamus; DMH, dorsomedial hypothalamus; PVN, paraventricular nucleus; and LH, lateral hypothalamus (Fig. 11.2).
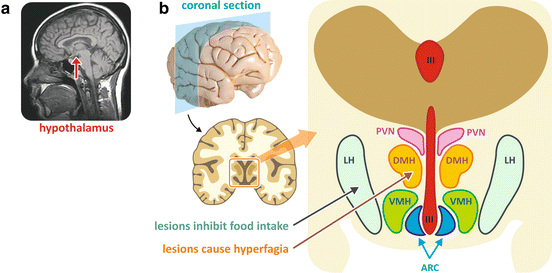

Fig. 11.2
(a) Magnetic resonance image of the human brain showing the localization of the hypothalamus (reproduced from the free media repository Wikimedia Commons). (b) Human brain section showing the anatomical localization of the hypothalamic regions. The blue arrow indicates the area whose lesion caused hyperphagia and the orange arrow indicates the area whose lesion caused the inhibition of food intake. III third ventricle, ARC arcuate nucleus, VMH ventromedial hypothalamus, DMH dorsomedial hypothalamus, PVN paraventricular nucleus, LH lateral hypothalamus
The hypothalamus induces anorexigenic (appetite-suppressing) or orexigenic (appetite-stimulating) behaviors by sensing several substances that are secreted by different cells in the body as a response to food intake or to the increase in adiposity. For instance, leptin , insulin , cholecystokinin (CCK), and peptide YY (PYY) provide the anorexigenic signals, while ghrelin is the main orexigenic mediator, as it will be discussed in the next sections.
11.1.1 A Historical Perspective of the Role of Hypothalamus in Food Intake
The first evidence showing that the hypothalamus controls the body energy balance came from a number of studies conducted in the 1940s. These experiments showed that lesions in areas of the medial-basal hypothalamus caused either hyperphagia and obesity or anorexia, depending on the specific region that was lesioned (as indicated in Fig. 11.2).
More than just revealing its role in the control of food ingestion, these experiments led to the hypothesis that the hypothalamus would act as a sensor of the feeding status of the organism, stimulating or inhibiting food intake depending on the amount of the energy stored in the body. A question that was immediately raised was how this sensing mechanism would operate. An attractive hypothesis was that it occurred through the circulating metabolites detected by the hypothalamus.
At that time, a common approach to investigate the participation of a circulating mediator in a given phenomenon was through parabiosis experiments. In these experiments, the blood vessels of two animals were surgically connected to allow the exchange of circulating factors between them. In a classical experiment performed in 1959, parabiotic pairs of rats were subjected to a lesion in the hypothalamus of one of the animals. While the lesioned rats became obese, as expected, the unlesioned partners stopped eating and lost weight, indicating that a circulating factor produced by the obese animals, for which the lesion turned the animal unresponsive, inhibited food intake in the normal ones (see the result of this experiment in Fig. 11.3).
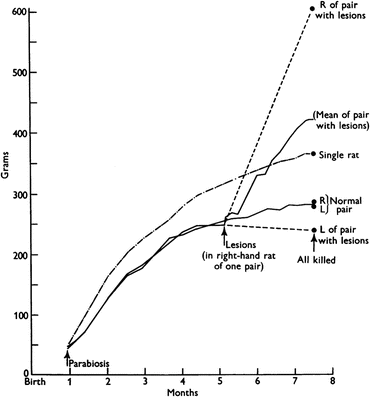

Fig. 11.3
Growth curves of parabiotic rats. When the animals were 5 month old, lesions were made in the hypothalamus of the right-hand member of the parabiotic pair. The last point in the curve corresponds to the individual body weights after death and separation of the parabiotic pairs. The dashed lines indicate the presumed body weight of each member of the pair based on the weight at the end of the experiment. The growth curve of a single rat is also shown for comparison. Figure reproduced with permission from Hervey, J. Physiol. 145:336–352, 1959
Other parabiosis experiments were performed in the 1950s taking advantage of the description of two spontaneous recessive mutations in mice that result in a phenotype of extreme obesity caused by hyperphagia. The two mutated genes were called ob (from the obese phenotype; Fig. 11.4) and db (from diabetic, and also obese, phenotype).
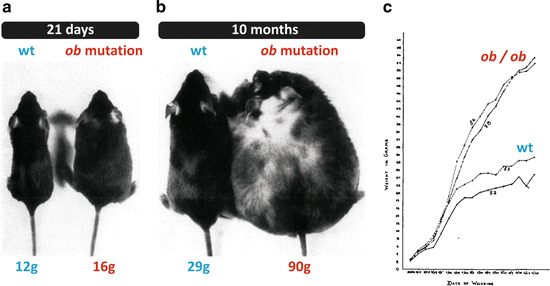

Fig. 11.4
Photographs and growth curves reproduced from the original article that described the phenotype of the animal with the spontaneous mutation in the ob gene. (a) Normal and ob/ob mice at 21 days of age. (b) Normal and ob/ob mice at 10 months of age. (c) Growth curves of two normal and two ob/ob mice from birth to 4 months of age. Figures reproduced with permission from Ingalls et al., J. Hered. 41:317–318, 1950
When a homozygotic mouse for a mutation in the ob gene (ob/ob mouse) was joined through parabiosis to a normal mouse, the obese animal stopped eating in excess and tended to normalize its weight. This suggested that the product of the ob gene, which is defective in the ob/ob mouse, would be the circulating factor that signalizes to the hypothalamus the excess of body weight, leading to the inhibition of food intake. In contrast, when a db/db mouse was connected to a normal mouse, only the normal animal lost weight, suggesting that the mutation caused a failure in the response to the “obesity” factor, which acts in the normal mouse inhibiting food ingestion (Fig. 11.5).
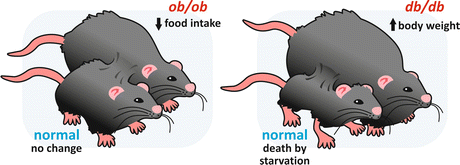

Fig. 11.5
Schematic representation of the parabiosis experiments with ob/ob and db/db mice. When an ob/ob mouse was connected to a normal mouse, the obese animal stopped eating in excess and lost weight, while no changes occurred in the normal mouse. When a db/db mouse was connected to a normal one, only the normal mouse lost weight
11.1.2 Leptin: A Hormone Indicative of Adiposity
The parabiosis experiments with the ob/ob and db/db mice described in the previous section indicated that the amount of adipose tissue accumulated in the body was regulated by the endocrine system. However, the hormone (the circulating factor) responsible for the transmission of the information of the increase in body weight to the hypothalamus remained unknown until 1994, when the product of the ob gene was finally discovered. More interestingly, it was found that this protein is expressed almost exclusively in the adipose tissue. This protein was named leptin (from the Greek word leptos, which means thin), and its discovery represented a revolution in the study of obesity both due to the expectations it raised on the pharmaceutical industry and because it revealed a complete new function for the adipose tissue, whose role changed dramatically from an inert tissue of energy storage to an endocrine organ (Box 11.1).
Immediately after the discovery of leptin , massive investments were made in the development of new treatments that envisaged the elimination of obesity by simply administrating leptin to obese people. However, as high as the expectations were the disappointments when it became clear that in humans the mutations in the leptin gene accounted for a very small number of obesity cases, and the simple administration of leptin in the remaining obesity cases did not lead to weight loss.
Box 11.1 The Adipose Tissue as an Endocrine Organ
The discovery of leptin opened the way to the identification of a series of proteins secreted by the adipose tissue, which were named adipokines (see table). These proteins act as hormones or cytokines and are mainly involved in the regulation of energy metabolism or in inflammation. This made the white adipose tissue to be recognized as a dynamic endocrine organ besides being a lipid storage tissue.
Active polypeptides secreted by the adipose tissue
Name | Molecular nature | Main features and functions |
|---|---|---|
Leptin | 16 kDa protein | Expressed mainly in adipocytes. Controls energy balance (see main text) |
Adiponectin | 30 kDa protein that forms multimeric complexes | Expressed exclusively in adipocytes. Blood levels inversely correlate to adiposity. Increases lipid catabolism and insulin sensitivity |
Resistin | 75 kDa protein | Expressed mainly in adipocytes. Secreted during adipogenesis. Increases insulin resistance |
Visfatin | 52 kDa protein | Extracellular isoform of the enzyme nicotinamide phosphoribosyltransferase of the NAD biosynthesis pathway. Stimulates insulin secretion |
Apelin | 55 amino acid precursor that generates several active fragments | Expressed in many cell types including adipocytes. Increases cardiac contractility and lowers blood pressure |
Retinol-binding protein- 4 (RBP-4) | 20 kDa protein | Expressed mainly in hepatocytes and adipocytes. Transports retinol in the blood but also decreases insulin sensitivity |
Tumor necrosis factor-α (TNF-α) | 17 kDa protein that forms soluble trimers | Pro-inflammatory cytokine secreted mainly by macrophages but also by many other cells including adipocytes. Triggers the inflammatory response and regulates cell death, but also increases insulin resistance (see Sect. 11.3.1) |
interleukin 6 (IL-6) | 24 kDa protein | Produced by many cell types. Acts as a pro-inflammatory cytokine |
Monocyte chemotactic protein- 1 (MCP-1) | 13 kDa protein | Produced by many cell types. Acts on the inflammatory process, but also impairs insulin signaling in skeletal muscle cells |
Plasminogen activator inhibitor- 1 (PAI-1) | 47 kDa protein | Expressed in endothelium but also in other cell types such as adipocytes. Inhibits the proteases involved in the degradation of blood clots |
Despite the failure of using leptin to treat obesity, it soon became clear that the plasma levels of leptin directly correlated with the BMI and to the percentage of fat in the body, showing that the increase in the amount of adipose tissue determined the increase in plasma leptin (Fig. 11.6).
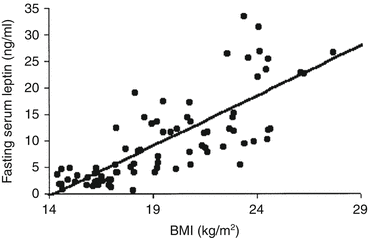

Fig. 11.6
Correlation of plasma leptin concentrations with BMI in a sample of 41 obese children (aged 6–9 years old) and the same number of nonobese children (control group), matched by age and sex (Reproduced with permission from Valle et al., Int. J. Obes. Relat. Metab. Disord. 27:13–18, 2003)
Leptin is a small protein of 167 amino acid residues forming an α-helical structure that resembles the structure of some cytokines (Fig. 11.7). Leptin effects are mediated by its binding to specific receptors expressed by neurons in the central nervous system , the inhibition of appetite being mainly due to its binding to receptors of the hypothalamic neurons (see also Sect. 11.1.5).
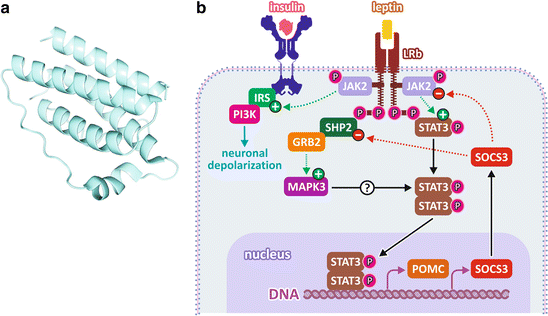

Fig. 11.7
(a) Leptin structure. (b) Leptin signal ing pathway. Leptin binding to its receptors in the hypothalamus leads to the activation of JAK2 and to the recruitment of STAT3, IRS , and SHP, which become active. STAT3 migrates to the nucleus, inducing the expression of POMC and the feedback inhibitor of the pathway SOCS3. IRS mediates the activation of PI3K , which induces neuronal depolarization involved in the rapid responses independent on gene expression. Activation of MAPK pathway is mediated by SHP recruitment
The leptin receptor is a homodimeric transmembrane protein that is constitutively associated to the enzyme Janus kinase 2 (JAK2, Box 11.2). Leptin binding promotes conformational changes in the receptor that mediate an increase in the tyrosine kinase activity of JAK2, resulting in its autophosphorylation and in the phosphorylation of different intracellular targets, leading to the activation of different signal ing pathways, including the JAK /STAT3, the phosphatidylinositol-3-kinase (PI3K ), and mitogen-activated protein kinase (MAPK ) pathways (Fig. 11.7).
Box 11.2 The Origin of the Janus Kinase Name
In the Roman mythology, Janus (in Latin, Ianus) is the god of the gateways, beginnings, and transitions, who keeps the door of Heaven. He is represented as having two faces looking in opposite directions (see figure with Janus representation in an old Roman coin), meaning that he can see the future and the past simultaneously. The first month of the year is named after him, as in January we look back at the last year and forward to the next. The reference to Janus in JAK ’s name is related to the fact that the members of this family of kinases possess two near-identical phosphate-transferring domains, one with kinase activity and the other that negatively regulates the kinase activity of the first.


Janus head represented in a Roman coin dated 225–214 BC (Reproduced from the free media repository Wikimedia Commons)
JAK /STAT3 is the predominant pathway that mediates leptin effects. When STAT3 is phosphorylated by JAK2, it migrates to the nucleus, where it regulates the expression of several genes. This includes those encoding some important neuropeptides involved in the appetite control, such as neuropeptide Y, which has its expression inhibited, and the pro-opiomelanocortin (POMC ), corticotropin-releasing hormone (CRH), and the cocaine- and amphetamine-regulated transcript (CART), which have their expression induced (see Sect. 11.1.5 for details on the role of these neuropeptides in the appetite control). STAT3 also induces the expression of feedback inhibitors of the signal ing pathway, such as SOCS3 (suppressor of cytokine signaling 3) (Fig. 11.7).
The active JAK2 also recruits proteins from the family of the insulin receptor substrates (IRS ), which mediate the activation of the PI3K pathway (for more details about this pathway, see the mechanism of insulin action in Sect. 8.4.2). Thus, there is a cross talk between the signal ing pathways triggered by leptin and insulin at the hypothalamic level, so that the leptin action on the hypothalamus is positively modulated by insulin and vice versa. PI3K regulates the electrophysiological properties of the hypothalamic neurons , modulating the release of neurotransmitters in the synapses, which also contribute to the reduction of feeding. It is important to mention that the blood concentration of both insulin and leptin are increased in response to food ingestion. Since the hypothalamic neurons are also rich in insulin receptors , both leptin and insulin contribute to the triggering of the anorexigenic responses after feeding.
In summary, the action of leptin on the hypothalamic neurons alters the gene expression pattern in these cells and causes cell depolarization , resulting in the activation or inhibition of the secretion of different neuropeptides (see Sect. 11.1.5). It is important to mention that leptin effects can be seen as part of the long-term effects on the control of the body weight. Leptin does not promote an abrupt interruption in food ingestion, but influences the amount of food intake and its relationship with the body energy expenditure over time. There are other hormones and mediators that directly promote the postprandial satiety or trigger appetite. These mostly short-term mediators are mainly secreted by the gastrointestinal tract, as discussed in the next sections.
11.1.3 Intestinal Peptides: Triggers of Postprandial Satiety
The satiety feeling just after a meal is a result of several signals, mainly arising from the gastrointestinal tract, that act on the brain, providing information regarding the quality and the quantity of food ingested. These signals are involved in the short-term regulation of food ingestion, especially the control of the meal size.
The first experiments suggesting the role of the intestine in promoting satiety were performed using a surgical procedure previously developed by Ivan P. Pavlov in his classic experiments of the decade of the1890s, which revealed the role of the central nervous system in the regulation of gastric secretion in dogs (see Box 11.3). This procedure consists of establishing an esophagic fistula in animals, so that when they eat, the food is tasted and swallowed, but does not accumulate in the stomach and does not pass into the small intestine, which is usually referred as sham feeding (Box 11.3).
Box 11.3 Pavlov and the Sham Feeding Experiments
Ivan Petrovich Pavlov was a Russian scientist whose research on the physiology of digestion led him to be awarded the Nobel Prize in Physiology or Medicine in 1904. Pavlov developed a surgical method that establishes fistulas in various organs, enabling the continuous observation of their functions. This opened a new era in the development of physiology, whose procedures until then were based essentially on vivisection methods, which allowed only an instantaneous picture of the analyzed process. The classical Pavlov’s experiments were performed on sham-fed dogs, to which a gastric fistula was applied (see figure). Within a few minutes after the beginning of sham feeding, gastric juice begins to flow without ceasing for hours.
Pavlov demonstrated that when the vagus nerves were lesioned, secretion of gastric juice during sham feeding was absent, showing the reflex nature of the first phase of gastric juice secretion.
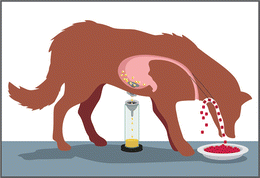

Pavlov’s esophagostomy associated to the application of a gastric fistula used in the sham-feeding experiments
A number of experiments performed in the 1970s showed that when the animals were sham fed, satiety did not occur, revealing that the satiety feeling originates from the passage of food through the gastrointestinal tract. These experiments allowed the subsequent identification of several intestinal peptides involved in triggering satiety and whose plasma levels rapidly increase after a meal (Fig. 11.8). In this section we will comment on the secretion profile and the action of three of these peptides: cholecystokinin (CCK), glucagon -like peptide 1 (GLP-1), and peptide YY (PYY).
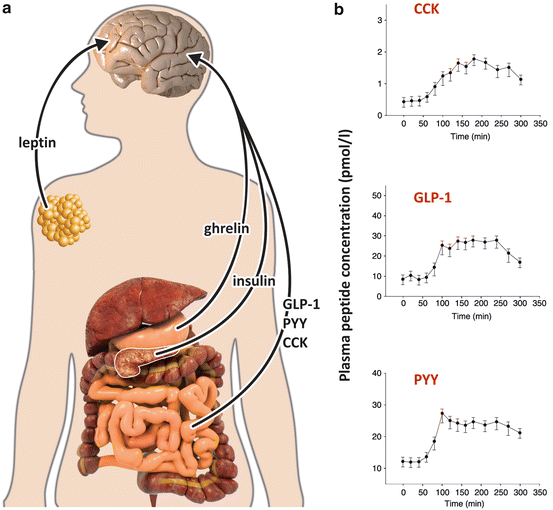

Fig. 11.8
(a) Sites of secretion of the peripheral factors that modify food intake and energy expenditure through direct effects on the brain: ghrelin is secreted by the stomach prior to the meals, inducing food intake (Sect. 11.1.4); CCK, GLP-1, and PYY are secreted by the intestine just after the meals, interrupting eating; leptin is secreted by the adipose tissue as a signal of adiposity (Sect. 11.1.2); and insulin is secreted by the pancreas in response to nutrient ingestion (Sect. 8.4). (b) Plasma concentrations of intestinal peptides in response to breakfast ingestion, which occurred 60 min after the beggining of the measurements. Data are from 12 subjects, presented as mean ± SEM. CCK, cholecystokinin; GLP-1, glucagon -like peptide -1; PYY, peptide tyrosine tyrosine (Reproduced with permission from Vidarsdottir et al., Eur. J. Endocrinol. 162:75–83, 2010)
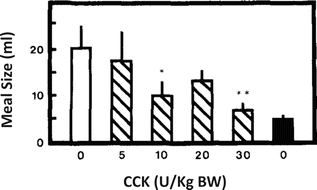
CCK is secreted by the I cells, mainly located in the proximal duodenum, suppressing food intake and decreasing meal size. CCK was one of the first gastrointestinal peptides to be demonstrated as an important trigger of the postprandial satiety. Experiments in the 1970s using sham-fed rats, which ate continuously due to the absence of intestinal stimulation, showed that the intraperitoneal injection of CCK suppressed feeding in a dose-dependent manner (Fig. 11.9).

