and Miguel A. R. B. Castanho2
(1)
Instituto de Bioquímica Médica Leopoldo de Meis, Federal University of Rio de Janeiro, Rio de Janeiro, Rio de Janeiro, Brazil
(2)
Institute of Biochemistry and Institute of Molecular Medicine, School of Medicine, University of Lisbon, Lisbon, Portugal
In humans, blood glucose is the main reporter of fed and fasting states. Its concentration directly regulates the secretion of hormones, including glucagon and insulin by the pancreas and glucocorticoids by the adrenal cortex. These hormones, in a coordinated action, regulate the energy metabolism in different organs, allowing the blood concentration of glucose to be maintained within a narrow range by a precise system balancing glucose production by the liver and its utilization by peripheral tissues.
The basis for this major role of glucose in controlling human metabolism may be discussed in the context of human evolution. About 4 million years ago, carbohydrates were important components of the diet of primates and prehuman ancestors, which possibly favored brain and reproductive tissues to develop a specific requirement for glucose as their primary fuel. The subsequent periods of human evolution were dominated by severe Ice Ages that selected the hominids who developed hunting and fishing abilities and consumed high-protein and low-carbohydrate diets. This led to metabolic adaptations to protect the brain and embryonic tissues from the low-glucose availability, resulting in the increased efficiency of hepatic glucose production and the decrease in peripheral glucose utilization. Additionally, the alternate periods of food scarcity and abundance selected metabolic mechanisms to increase deposition of energy reserves during periods of plenty for subsequent use when food was not available, favoring lipid accumulation and the development of the adipose tissue. However, the advent of agriculture after the last Ice Age greatly modified the quantity of carbohydrates consumed by humans, and the Industrial Revolution in the nineteenth century dramatically changed the quality of the carbohydrate ingested (see Box 9.1). These events together would result in an increase of postprandial glycemia and insulinemia, probably contributing to the predisposition of the modern diseases known as metabolic syndrome (see Chap. 11).
Nowadays, in Western cultures, humans have three main meals per day, and the amount of carbohydrates in a regular meal is about 50–60 %. After the digestion and absorption of the carbohydrates, glucose reaches the bloodstream and glycemia rapidly rises from the basal value of 4 mM to around 10 mM (see Fig. 8.2). In Chap. 8, we discussed the biochemical mechanisms that explain why plasma glucose concentration sharply falls down between the first and the second hour after a meal.
In this chapter, we will turn our attention to the subsequent hours, which are characterized by a slow decrease in glycemia. We will focus on the metabolic pathway s and the mechanisms involved in the maintenance of blood glucose concentration when carbohydrates are not ingested, which include the periods in between meals as well as during low-carbohydrate diets or prolonged starvation. Additionally, the metabolic interrelationships that take place in the different organs and the hormonal regulation in this situation will also be discussed.
Box 9.1: The Evolution of Human Diet
Paleolithic and current Western diets show profound differences in composition, especially regarding carbohydrate content and quality (see figure). Several studies suggest that two major dietary shifts occurred during human evolution: (a) in the Neolithic (~10,000 years ago), when agriculture emerged, leading to an increase in the consumption of domesticated cereals and the adoption of carbohydrate-rich diet, and (b) after the Industrial Revolution (~1850), with the introduction of industrially processed flour and sugar. This led to the hypothesis, proposed in a classical article published by Eaton and Konner in 1985, that predisposition of the modern diseases known as metabolic syndrome, resulted from an evolutionary discordance between the adaptations established in the Paleolithic era (2.6 million to 12,000 years ago) and the way of life in the industrialized world. Based on this, the authors proposed the “Paleolithic diet” as a reference for human nutrition. However, this view is being questioned nowadays, especially because (a) it implies that human genetic background has not changed since Paleolithic, although humans continued evolving in the Neolithic period, with genetic changes directly related to diet variations, such as on the genes that code for amylase (enzyme that degrades starch) production, and (b) it does not take into account the non-genomic form of inheritance, such as the epigenetic regulation of gene expression, which alters fitness in short-term environmental shifts, such as during in utero development.
The dietary impacts during human evolution can be exemplified with one interesting study that analyzed the genetic diversity of oral microbiota of calcified dental plaque obtained from prehistoric European human skeletons, including the remains of the last hunter-gatherers in Poland and the earliest farming culture in Europe (the Linear Pottery Culture, LBK), as well as late Neolithic (Bell-Beaker culture), early and later Bronze Age, and medieval rural and urban populations (see in the figure an example of phylum frequencies obtained comparing a specific genome region). This study revealed that oral microbiota became markedly less diverse in the modern times, with the dominance of the potentially cariogenic bacteria, like S. mutans (see figure).
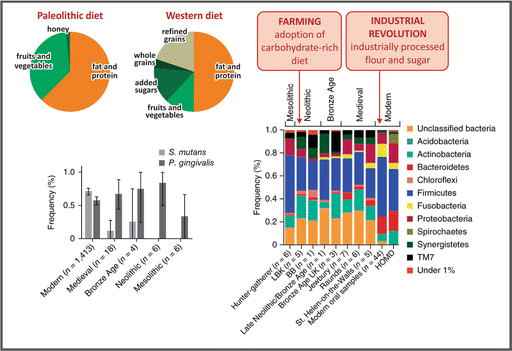
Carbohydrate consumption by man’s ancestors corresponds to about 35 % of the total energy intake, which comes mainly from fruits and vegetables, while 50 % daily energy in a Western diet is obtained from carbohydrate, of which about 15 % comes from sugar added to food during processing or consumption, and about 20 % comes from refined cereals (Based on data from Eaton SB. Proc. Nutr. Soc. 65:1–6, 2006). The changes in carbohydrate content and quality in human diet impact in the diversity of oral microbiota (Reproduced by permission from Macmillan Publishers Ltd: Adler et al., Nat. Genet. 45:450–456, 2013)
The maintenance of glycemia may be explained by two distinct phenomena: the decrease in glucose utilization by different tissues and the increase in its production and release into the bloodstream by the liver and kidney (Fig. 9.1). When plasma glucose concentration is above the basal levels, insulin secretion is stimulated and the action of this hormone allows for rapid glucose utilization by all the tissues (see Chap. 8). However, as glycemia decreases, glucagon secretion will predominate, leading to a complete change in metabolism , which is characterized by a decrease in glucose utilization, especially by the muscle and adipose tissues, and a continuous release of glucose in the bloodstream by the liver and, in smaller quantities, by the kidney cortex, as we will discuss in the next sections.
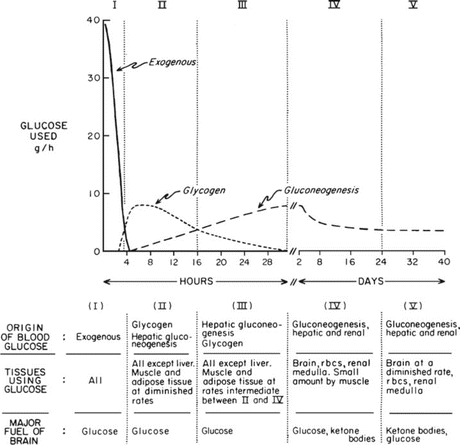
Fig. 9.1
Classical figure by Dr. George Cahill in which he describes five metabolic stages between the postabsorptive state and the near-steady state of prolonged starvation. The figure was constructed based on studies performed by Dr. Cahill and his group with patients submitted to therapeutic starvation in the 1960s (see Box 9.2). rbcs red blood cells (Reproduced with permission from Cahill. Ann. Rev. Nutr. 26:1–22, 2006)
9.1 Overview of Metabolism During Fasting: Exemplifying with Studies on Therapeutic Starvation
To introduce the issue of glycemia control, we will take advantage of some studies carried out between the 1950s and 1960s, when therapeutic starvation was used as a strategy to treat obesity (Box 9.2). It is important to note that this extreme situation was chosen as an example for clarity, but the adaptations and the metabolic pathway s that will be discussed along this chapter also occur in more common situations, such as low-carbohydrate diets, overnight fasting, or even during the periods in between meals.
Box 9.2: Therapeutic Starvation
The studies used here to exemplify the metabolic adaptations to hypoglycemia have been performed by the group of Dr. George F. Cahill (1927–2012) during the 1960s. As pointed out by Richard W. Hanson in a retrospective article on Dr. Cahill’s contributions to the understanding of human metabolism , the fact that he was not a biochemist but a physician–scientist made his approach to research integrative and not reductionist in nature. This integrative view allows him to make a crucial discovery regarding brain metabolism during fasting that explained how humans can survive for more than 60 days without food: ketone bodies , molecules derived from fatty acid metabolism, supply most of the energy requirements of the brain during fasting (see details in Sect. 9.3.4). This finding “resulted in a total reappraisal of the hierarchy of fuels used by different tissues of humans,” as stated by Dr. Oliver E. Owen, who worked with Dr. Cahill on these classical experiments. In the 1950s and 1960s, therapeutic starvation of obese subjects was in vogue. The studies described here were performed in the Peter Bent Brigham Hospital, which has a National Institutes of Health-supported clinical research center where the patients were housed and continuously observed during experimental protocols. The patients spent 5–6 weeks fasting with total withdrawal of calories, when the daily intake consisted of one multivitamin capsule, water, and salt replacement. Dr. Owen tells in one of his articles that when someone asked him why he chose a 6-week period for starvation, he answered citing St. Matthew 4:2: “Jesus fasted forty days and forty nights and afterward he hungered.” During treatment, the patients volunteered for blood and urine collections for measurements of the plasma concentrations of different metabolites . Furthermore, some of them underwent catheterization to determine the consumption or the production of metabolites by different organs by measuring the arterial-venous differences of these substances. Some of the data originated from these studies will be used in this chapter to discuss several aspects of human adaptation to fasting.
The variation of blood concentration of different metabolites during fasting will be used as the starting point for our discussion on the metabolic adaptations to hypoglycemia (Fig. 9.2).
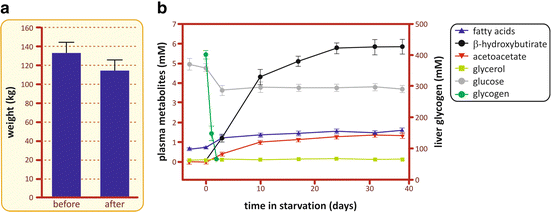
Fig. 9.2
(a) Average weight of a group of 11 obese patients before and after they were subjected to the treatment at the Clinical Center of the Peter Bent Brigham Hospital. (b) Concentrations of different metabolites in the plasma and glycogen in the liver during fasting (Based on data from Owen et al. J. Clin. Invest. 48, 574–583, 1969)
As seen in Fig. 9.2, the concentration of fatty acid s in the blood, after a slight increase, remains constant during all the period of fasting due to the equilibrium between its use as energy source by many tissues and its mobilization from triacylglycerol stored in the adipose tissue. Indeed, the content of triacylglycerol stored in the human body may provide energy for approximately 2 months of fasting (Table 9.1).
Table 9.1
Human nutrient stores (typical of a 70 kg man)
Molecule | Weight (g) | Energetic value (kcal) | Period as single energy source (days) |
|---|---|---|---|
Triglyceride (adipose tissue) | 9,000–15,000 | ~108,000 | 60 |
Glycogen (liver) | 90 | 360 | 0.2 |
Glycogen (muscle) | 250 | 1000 | 0.55 |
Glucose (blood and body fluids) | 20 | 80 | 0.044 |
Proteins (mainly muscle) a | 8000 | 32,000 | 17.8 |
As ketone bodies are the main product of fatty acid oxidation in the liver (see Sect. 7.4.6), it is expected that the concentration of these metabolites increases along fasting, as observed in Fig. 9.2. It is possible to note two different phases in the profile of the blood concentration of ketone bodies. In the first 10 days of fasting, there is a constant increase in their concentration, which then gradually reaches a plateau after 25 days. This second phase may be explained by the increase in ketone bodies’ consumption and/or excretion by the organism. In fact, brain adaptation to the use of ketone bodies as its main source of energy contributes to their removal from the bloodstream as well as decreasing whole body glucose requirements (for more details, see Fig. 9.16).
A remarkable observation regarding the profile of plasma metabolites during fasting is that glucose concentration, after a small decrease in the first 3 days, is maintained constant during all the period of starvation. From this observation, immediate questions arise: Why is it necessary to maintain glycemia? Why not use only fatty acid s as the energy source during fasting since they are, quantitatively, the major fuel reserve in the body (see Table 9.1)? The answer lies in the fact that some cells depend on glucose as their exclusive or preferential source of energy. This is the case of cells that lack mitochondria , as erythrocytes and the cells from crystalline lens, which depend on the anaerobic metabolism (glucose fermentation, see Sect. 6.1) to survive. It is also the case of the cells from the nervous system and the embryonic tissues, which are isolated from the systemic circulation by blood barriers that do not allow the uptake of fatty acids since these molecules are bound to albumin, their major form of transport in the bloodstream (Box 9.3). Therefore, it is essential that glucose is constantly produced and released in the bloodstream during the periods in which it is not ingested. The metabolic pathway s involved in the maintenance of glycemia will be discussed in the next sections.
Box 9.3: Glucose Transport Through the Blood–Brain Barrier (BBB)
BBB is a highly selective permeability barrier that restricts the passage of most substances from the circulating blood to the central nervous system (CNS) fluids (see also Sect. 3.3.4.1). It is formed by three cellular components (see figure): (a) the brain capillary endothelial cells; (b) the astrocytic end feet, which cover the vessel wall maintaining the endothelial barrier; and (c) the pericytes. The brain capillary endothelial cells are connected by tight junctions that make the paracellular transport of substances through BBB negligible under physiological conditions. Additionally, these cells express a number of drug efflux transporters, such as the glycoprotein P (Pgp) and several members of the multidrug resistance (MDR) protein family, which prevent the entry or remove drugs and other substances from the CNS. Glucose transport through BBB is mediated by GLUT1 (see Sect. 8.1). It is important to remind that GLUTs are facilitated-diffusion transporters, which means that glucose cannot be transported against a gradient from bloodstream to CNS. Additionally, GLUT1 K M for glucose transport is about 1–2 mM. Thus, the human brain cannot be supplied with glucose when its blood concentration is low (normoglycemia is about 5 mM), so that the only strategy to protect brain cells from starvation is to prevent hypoglycemia.
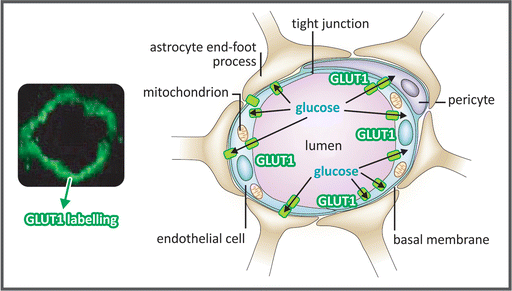
Micrograph of a brain microvessel section showing GLUT1 labeled with a green fluorescent probe (left) and the schematic representation of the BBB with its three cellular components (right), highlighting the glucose transport through GLUT1 (represented as green rectangles). (Reproduced by permission from Macmillan Publishers Ltd: Löscher & Potschka. Nature Rev Neurosci 6:591–602, 2005)
9.2 Glycogen Degradation in the Liver
The crucial role of liver metabolism in producing glucose to maintain glycemia started to be elucidated in the middle of the nineteenth century, with the pioneering studies developed by Claude Bernard (Box 9.4).
In 1853, Claude Bernard showed that the liver was able to release glucose in the bloodstream even when carbohydrate was not present in the diet. This finding completely changed the current idea about animal nutrition. It contradicted the accepted concept that animals always decompose complex substances obtained from food and for the first time suggested that organism functions would be maintained by a metabolic interplay among different tissues. Some years later, Claude Bernard isolated from the liver a substance that he named “la matière glycogène” (the substance that generates glucose), the glycogen .
At that time, it was not yet clear that glucose was released from the liver by a combination of two processes: the degradation of glycogen and the synthesis of glucose from noncarbohydrate precursors. Glycogen may be seen as a transient storage of the ingested sugar that is mobilized when necessary, while different non-glycidic molecules may be converted to glucose by a pathway named gluconeogenesis . This will be discussed in the next sections of this chapter.
Box 9.4: Claude Bernard: The Founder of Experimental Medicine
Maybe the most important accomplishment of Claude Bernard was to introduce the scientific methodology into medicine and physiology, establishing the basic rules of experimentation in the life sciences. This can be noticed in one of this letters to his friend Mme. Raffalovich: “The scientist must have imagination, but he must master this imagination and coldly probe the unknown. However, if he lets himself be carried away by his imagination, he will be overcome by vertigo and, like Faust and others, fall into the chasm of magic and succumb to phantoms of the mind.” Early in his career, he aimed to follow the fate of the sugar absorbed from the food in the animal body. The hypothesis at that time was that the ingested sugar was burned in the lungs, passing the liver through the hepatic portal system (see Box 8.1) without any processing to reach the bloodstream. To confirm this hypothesis (and also to discard that the sugar was not destroyed in the liver, as it seems that he suspected), Claude Bernard measured the amount of sugar in the portal and hepatic veins of a dog fed with sweet milk. He would be convinced when he found a large amount of glucose in the blood that had passed through the liver, but he was not, as he pointed out on his book Introduction à l´Étude de la Medicine Expérimentale: “More than one researcher would have stopped here and would have thought that any control experiment was useless. But I performed a control experiment because I am convinced that in physiology you should always doubt even if the doubt doesn’t seem to be permitted.” The control was a similar experiment in which the dog was fed only with meat. For his surprise, he found a large amount of sugar in the hepatic vein, which led him to state: “I don’t understand anything anymore.”
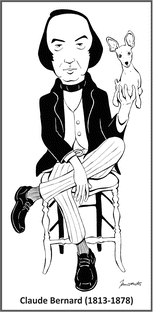
This unexpected finding led Claude Bernard to isolate glycogen some years later, but his contribution to the understanding of animal metabolism did not stop there. The observation that liver releases glucose into the blood led him to establish the concept of “internal secretion.” Additionally, Claude Bernard was the first to express the idea that the animals have an inner milieu, different from the external environment, whose constancy would be a requirement for life maintenance (the basis from which the principle of homeostasis emerged), as he stated: “la fixité du milieu intérieur est la condition d’une vie libre et indépendent” (the stability of the internal environment is the condition for a free and independent life).
In many tissues, especially in the liver and muscles , glycogen is the storage form of glucose , being observed as dense granules at the microscope (see Fig. 8.5). Liver glycogen content may correspond to about 10 % of wet weight of this organ in well-fed humans. In the muscles, glycogen content can account for 1–2 % of their wet weight, but since the muscles occupy a much larger area of the body than the liver, total muscle glycogen content is twice as high as that of liver.
The process of glycogen degradation , known as glycogenolysis, was almost entirely elucidated by Carl and Gerty Cori. They discovered (a) the nature of glycogen degradation reaction, a phosphorolysis reaction; (b) the enzyme that catalyzes it, glycogen phosphorylase ; and (c) its product, glucose -1-phosphate . Due to this great contribution to carbohydrate metabolism , Carl and Gerty Cori were awarded the Nobel Prize in Physiology or Medicine in 1947.

9.2.1 Reactions of Glycogen Degradation
Glycogen is a highly branched polymer of glucose containing α1,6-glycoside linkages in the branch points, with 10–12 glucose residues linked by α1,4-glycoside linkages between each branch (see Sect. 3.2.1). Its degradation depends on two enzymes , the glycogen phosphorylase (GP) and the debranching enzyme .
GP catalyzes the phosphorolysis of the α1,4 glycoside linkage at a terminal glucose unit from the nonreducing ends of the molecule, yielding glucose-1-phosphate (Fig. 9.3). In their first studies on glycogen degradation , the Coris showed that the reaction catalyzed by GP was reversible in vitro. However, now it is clear that phosphorolysis is greatly favored in vivo due to the very high intracellular ratio [Pi ]/[glucose-1-phosphate], and glycogen synthesis has to occur through another pathway (see Sect. 8.2).
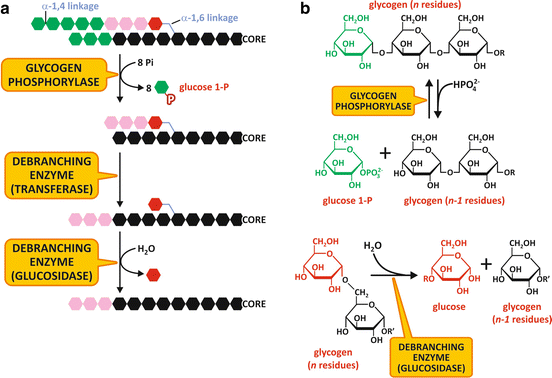
Fig. 9.3
(a) Schematic representation of glycogen degradation . (b) Reactions catalyzed by glycogen phosphorylase (top) and the glucosidase activity of the debranching enzyme (bottom)
The branched structure of glycogen enables its rapid degradation, since about 50 % of glucose units are in the outer branches. Glucose units are removed sequentially until four units before the branch point, where the enzyme loses its activity leaving what is known as a limit dextrin (a molecule with short branches of four glucose units in length).
Further removal of the glucose units from a glycogen molecule depends on the activity of the debranching enzyme . This enzyme has two different activities in the same polypeptide chain. The first is a glucosyltransferase activity, in which a trisaccharide unit at the end of a branch is transferred through an α1,4-linkage to a nonreducing end of another chain, resulting in an extended chain susceptible to GP action (Fig. 9.3). The second activity is an amylo-1,6-glucosidase, in which the α1,6-glycoside linkage in the branch points is hydrolyzed to form glucose. It is interesting to note that due to this activity, about 7 % of the glucose residues in glycogen are released as glucose and not as glucose-1-phosphate .
Glucose-1-phosphate produced during glycogenolysis may be converted to glucose-6-phosphate by the action of the enzyme phosphoglucomutase (Fig. 9.3).
In the liver , glucose -6-phosphate may be dephosphorylated through the action of glucose-6-phosphatase (G6Pase), allowing glucose units to be removed from glycogen and released in the bloodstream. G6Pase is an integral protein of the endoplasmic reticulum membrane with the active site on the luminal side of this compartment (Fig. 9.4). It is expressed only in the liver and kidney , and because muscle cells lack this enzyme , the glucose units removed from muscular glycogen are metabolized in muscle tissue itself.
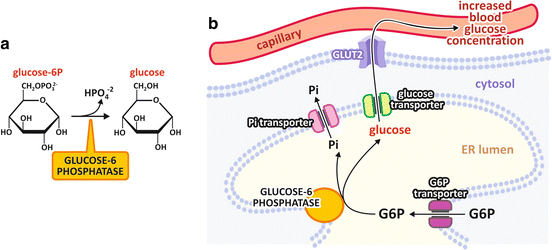
Fig. 9.4
(a) Glucose-6-phosphatase reaction. (b) Intracellular localization of glucose-6-phosphatase . The enzyme is an integral protein in the endoplasmic reticulum (ER ) membrane that catalyzes the dephosphorylation of glucose-6-phosphate in the lumen of this organelle. The enzyme substrate (glucose-6-phosphate) and products (glucose and inorganic phosphate ) are transported across ER membrane through specific transporters
In their first physiological studies on carbohydrate metabolism , the Coris proposed that the lactate produced in muscle from glycogen degradation (and subsequent glycolysis ) reached the liver through the bloodstream being then reconverted to glycogen, in a cycle that became known as the “Cori cycle .” However, although the idea of cycling metabolites between tissues is a very important concept, the “Cori cycle,” exactly as it was proposed, does not occur physiologically. Glucose produced in the liver from muscle lactate, instead of being converted to glycogen, is released into the bloodstream to be used by the brain, as well as by erythrocytes and other fermentation-dependent cells. Additionally, it is very unlikely that glucose produced in the liver goes to the muscles , since its internalization in muscle cells depends on the insulin action, which is not operating in this situation (see Sect. 8.4). In fact, we can construct a more complex picture of glycogen/glucose-lactate cycling in different organs, as presented in Fig. 9.5.
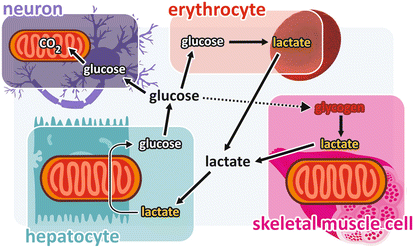
Fig. 9.5
Glycogen/glucose -lactate cycling: glycogen degradation in the muscles forms lactate, which is released in the bloodstream and enters the liver , where it is converted to glucose by gluconeogenesis . Glucose released from the liver into the bloodstream is taken up by the glucose-dependent cells, such as those from the brain and the erythrocytes . Uptake of glucose by the skeletal muscle (forming the so-called Cori cycle ) is hypothetical because the physiological conditions that favor lactate production by muscle cells do not favor glucose uptake by these cells (see text)
9.2.2 Regulation of Glycogen Degradation in the Liver
Liver glycogen content largely varies in response to food intake (Fig. 9.6). Glycogen accumulates rapidly after carbohydrate ingestion and then it is gradually mobilized to generate free glucose in between the meals.
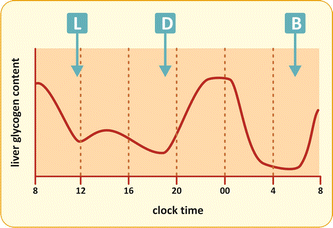
Fig. 9.6
Variation in the liver glycogen content after each meal
Glycogen degradation is mainly controlled by regulating GP activity. This enzyme is a dimer that exists in two different conformations, one more active, named phosphorylase a, and one much less active, named phosphorylase b (Fig. 9.7). These two forms are interconvertible by phosphorylation /dephosphorylation of a serine residue (Ser14), induced by hormone action (see Sect. 9.3.3).
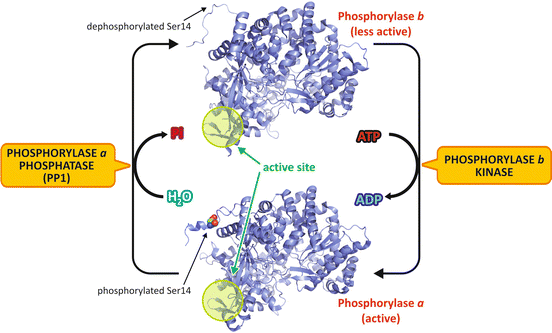
Fig. 9.7


Regulation of GP activity by phosphorylation . In the liver , glucagon action triggers the phosphorylation of the less active form of GP, named phosphorylase b (PDB 1FC0), in its Ser14, which promotes a structural change to the active form, phosphorylase a (PDB 1FA9). The N-terminal segment, which contains the phosphorylation site (Ser14), converts from a completely disordered conformation to a well-ordered structure, and several structural transitions occur in the active site (highlighted in green). To facilitate the visualization of enzyme conformational changes, the monomer structures are shown in the figure, although the enzyme exists as homodimers
Stay updated, free articles. Join our Telegram channel
Full access? Get Clinical Tree
