a. The RCA usually supplies the most of the right ventricle, a small part of the diaphragmatic aspect of left ventricle, the right atrium, part of left atrium, and posteroinferior one-third of interventricular septum.
b. The RCA gives rise to the posterior descending artery (PDA). Coronary artery dominance is defined by the artery that supplies the PDA. In 70% of the population, the PDA is supplied by the RCA, coronary circulation referred to as right dominant. In 10% of the population, the PDA is supplied by circumflex artery and is left dominant.
3. The left main coronary artery usually supplies the free wall of the left ventricle, a narrow strip of the right ventricle anteriorly, the anterior two-thirds of ventricular septum, and most of left atrium.
a. After arising from the left coronary sinus, the left main coronary artery passes to the left atrioventricular groove, where it branches into left anterior descending artery (LAD) and the circumflex artery.
b. The first septal branch of the LAD is usually targeted for ablation in interventional treatment for hypertrophic cardiomyopathy.
D. The Cardiac Conduction System
1. The cardiac conduction system consists of the sinoatrial (SA) node, the atrioventricular (AV) node, the AV bundle also known as the bundle of His, the bundle branches, and the Purkinje fibers (Fig. 15-2). The cardiac impulse is normally initiated by the SA node. This causes the atria to contract, first the right atrium followed by the left atrium.
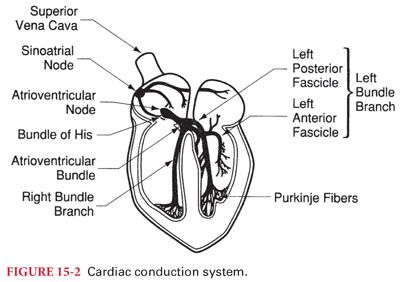
2. From the SA node, the impulse is conducted to the AV node (supplied by the RCA in a large majority of population). The cardiac electrical impulse is delayed in the AV node about a fifth of a second before being conducted to the bundle of His and on to the ventricles, so that the atria contract just before the ventricles to augment end diastolic filling.
3. The bundle of His branches into right and left bundle branches. The left bundle splits further into anterior and posterior fascicles. The bundle branches descend through the ventricular septum, where they continue on as the Purkinje fibers that end up directly stimulating the myocardium to contract.
III. Clinical Electrophysiology and Electrocardiogram. Body fluids are good electrical conductors, making it possible to record the sum of the action potentials of the cardiac cells on the surface of the body. Continuous monitoring of this electrocardiogram (ECG) during anesthesia is an essential tool for detecting myocardial ischemia, arrhythmias, and conduction system abnormalities.
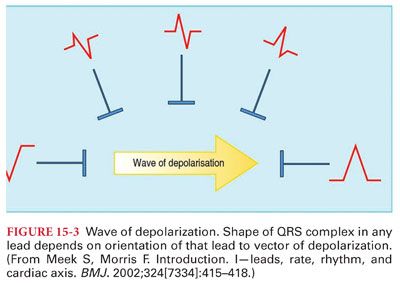
A. Electrocardiogram Leads. The cardiac electrical activity is usually measured by electrodes placed on the skin (bipolar leads consist of two electrodes, one positive and one negative, and unipolar leads consist of one positive electrode [exploring] and a composite pole). Depolarization directed toward the positive electrode produces a positive deflection, whereas directed away from it produces a negative deflection. When the depolarization wave is perpendicular to the lead, a biphasic deflection is recorded (Fig. 15-3).
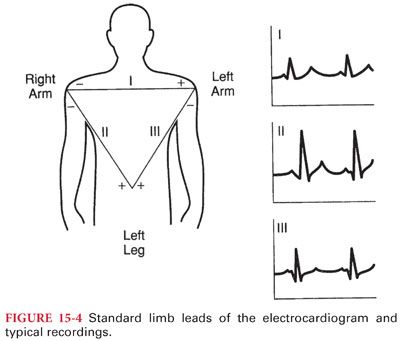
1. Standard Limb Leads. The standard limb leads (I, II, and III) record the potential difference between two points of the body (Fig. 15-4). In lead I, the electrodes are placed on the left shoulder (positive) and right shoulder (negative). In lead II, the positive electrode is on the left leg and the negative is on the right shoulder. In lead III, the positive electrode is on the left leg and the negative on the left arm. The limb leads form the triangle of Einthoven which is used together with the augmented limb leads to calculate the electrical axis of the heart in the frontal axis. The direction of the depolarization of the atria parallels lead II, resulting in a prominent P wave in this lead.
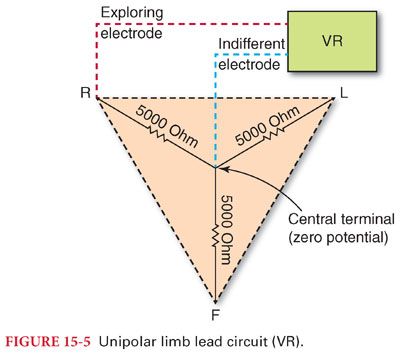
2. Augmented limb leads are similar to the standard limb leads but are unipolar (Fig. 15-5). The positive (exploring) electrode for augmented voltage right arm (aVR) is on the right shoulder, for augmented voltage left arm on the left shoulder, and for augmented voltage foot on the left leg.
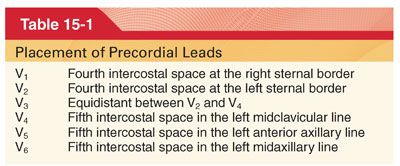
3. Precordial leads (V1 to V6) are unipolar leads that are placed on the chest wall, with the exploring electrode over one of six separate points (Table 15-1).
B. Electrocardiographic axis of the heart represents the overall direction of the electric impulse in the heart and is created by averaging all the action potentials. It is biased toward the left because of the larger muscle mass of the left ventricle compared to the right (Fig. 15-6).
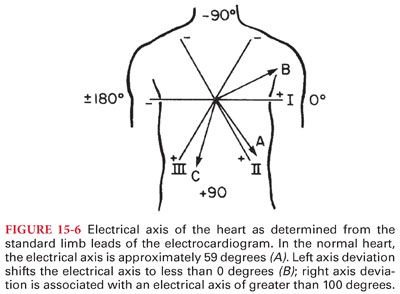
1. Left axis deviation (left ventricular hypertrophy) is defined as an axis less than –30 degrees and right axis deviation (right ventricular hypertrophy) as more than 90 degrees.
2. Abnormalities in the normal conduction pathway (blocks) in the heart also cause changes in the electrical axis.
C. Electrocardiogram Lead Systems
1. The three-lead system (most basic ECG system) consists of leads (I, II, and II) placed on the right arm, left arm, and left leg (provides adequate monitoring for arrhythmias; its use for detection myocardial ischemia is limited). For detecting intraoperative myocardial ischemia, V5 has the greatest sensitivity. Lead II is superior in monitoring atrial arrhythmias.
2. It is important to differentiate artifacts from real ECG findings (modern ECG monitors have incorporated filters for signal processing to minimize the presence of electrical artifacts).
D. Recording the Electrocardiogram
1. The ECG is recorded on a graph paper consisting of 1-mm squares with every five squares separated by a darker line. Each 1-mm horizontal line represents 0.04 second and each 1-mm vertical line represents 0.1 mV, assuming proper calibration 1 cm/1 mV and standardized paper speed of 25 mm per second. Therefore, the distance between two darker lines represents 0.2 second and 0.5 mV on the horizontal and the vertical axes, respectively.
2. The heart rate in beats per minute can be calculated by dividing 60 by the number of seconds (= 0.04 second × number of small boxes) between two consecutive beats.
3. The electrical activity that activates the cardiac contraction is observed on a monitor display as a graph of voltage change through time.
E. Normal Electrocardiographic Deflections. The cardiac electrical impulse is initiated at the sinoatrial (SA) node, which is located at the junction of the superior vena cava to the right atrium. Any part of the conduction system can spontaneously depolarize and initiate an impulse, but the SA node normally has the highest rate of depolarization and is the pacemaker of the heart. The impulse is transmitted through right and left intraatrial pathways to the AV node and then to the bundle of His, through the Purkinje fibers to the ventricular subendocardium, which causes the myocardium to depolarize. The speed of conduction is different between the various areas of the system, with the slowest through the AV node producing atrioventricular synchrony for optimal end diastolic filling from atrial contraction. The normal ECG consists of a P wave (atrial systole), a QRS complex (ventricular systole), and a T wave (ventricular repolarization). The atrial repolarization wave is obscured by the larger QRS complex (Fig. 15-7).
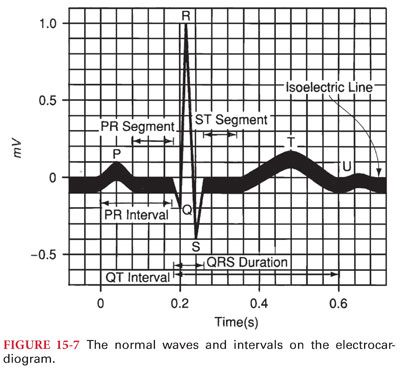
1. P wave represents the atrial depolarization and has a normal duration and amplitude of 0.08 to 0.12 second and less than 2.5 mm in the limb leads. An enlarged P wave signifies atrial enlargement.
2. P-R interval corresponds to the time from the beginning of the atrial depolarization to the beginning of the ventricular depolarization. It is measured from the start of the P wave to the start of the QRS. The normal duration of the P-R interval is 0.12 to 0.2 second. Prolonged P-R interval is called first-degree AV block.
3. Q wave is defined as an initial negative deflection of the QRS and is usually absent in leads aVR, V1, and V2. A Q wave whose amplitude is more than one-third of the corresponding R wave, duration is longer than 0.04 second, and depth is greater than 1 mm, is indicative of myocardial infarction.
4. QRS complex is caused by the depolarization of the ventricles and normally has a duration of less than 0.10 second.
a. A prolonged QRS duration may be due to left ventricular hypertrophy (LVH), impaired ventricular conduction (bundle branch block), beats initiated outside the conduction system (ectopic or paced beats), and beats passing through abnormal conduction pathways (Wolff-Parkinson-White syndrome).
b. Normally, the QRS amplitude gradually increases in the precordial leads from V1 to V5 (called R wave progression).
5. ST segment starts when all myocardial cells are depolarized (end of QRS) and ends when ventricular repolarization begins (T wave). It is normally isoelectric and elevation or depression more than 1 mm from the baseline may indicate myocardial ischemia. Hyperkalemia and pericarditis may also cause ST elevation.
6. T wave is caused by the repolarization of the ventricles and is usually in the same direction as the QRS. Delay of conduction of cardiac impulses through the ventricles (prolonged depolarization), as occurs with myocardial ischemia, bundle branch blocks, or ectopic ventricular beats, may result in T-wave polarity opposite the QRS complex.
a. Symmetrical or deeply inverted T waves may be indicative of myocardial ischemia.
b. Peaked T waves may be present in hyperkalemia, LVH, and intracranial bleeding.
7. QT interval includes both ventricular depolarization and repolarization (measured from the beginning of the QRS to the end of the T wave and varies in duration according to heart rate).
IV. Cardiac Physiology
A. Myocardium is the involuntary, striated muscle tissue in the heart between the epicardium and the endocardium. The primary structural proteins of the cardiac muscle are actin and myosin filaments, which interdigitate and slide along each other during contraction in a manner similar to skeletal muscle.
B. Cardiac Action Potential. At the initiation of an action potential in a cardiomyocyte, the cell membrane rapidly depolarizes as the transmembrane potential rises from –85 mV to +20 mV. The membrane remains depolarized for about 0.2 second, the plateau phase, which is then followed by rapid repolarization. During the plateau phase, the cardiomyocyte cannot be restimulated for about 0.25 to 0.3 second, called the refractory period. This is followed for additional 0.05 second by the relative refractory period, when the myocardium can only be stimulated by a strong excitatory signal.
V. Control of Cardiac Function
A. Neural Control
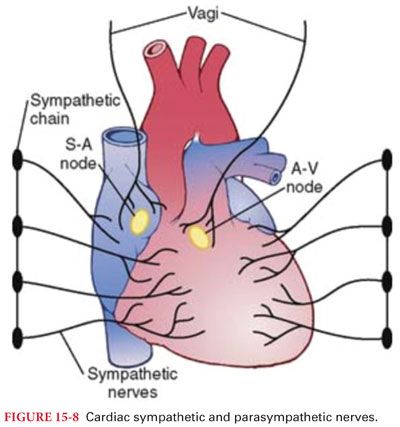
1. Heart function is controlled by the autonomic nervous system by both adrenergic and muscarinic acetylcholine receptors, modulating the cardiac output by influencing heart rate and myocardial contraction. The atria are innervated by both the sympathetic and parasympathetic nervous system, but the ventricles are supplied principally by the sympathetic nervous system (Fig. 15-8).
Stay updated, free articles. Join our Telegram channel

Full access? Get Clinical Tree


