FIGURE 14.1 Pathways in glucose metabolism.
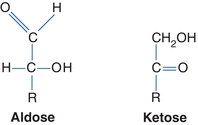
FIGURE 14.2 Two forms of carbohydrates.
Several models are used to represent carbohydrates. The Fisher projection of a carbohydrate has the aldehyde or ketone at the top of the drawing. The carbons are numbered starting at the aldehyde or ketone end. The compound can be represented as a straight chain or might be linked to show a representation of the cyclic, hemiacetal form (Fig. 14.3). The Haworth projection represents the compound in the cyclic form that is more representative of the actual structure. This structure is formed when the functional (carbonyl) group (ketone or aldehyde) reacts with an alcohol group on the same sugar to form a ring called either a hemiketal or a hemiacetal ring, respectively (Fig. 14.4).
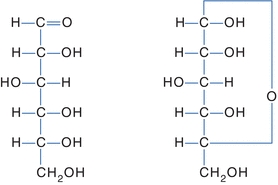
FIGURE 14.3 Fisher projection of glucose. Left: Open-chain Fisher projections. Right: Cyclic Fisher projection.
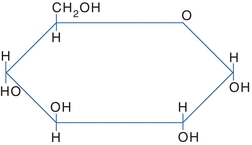
FIGURE 14.4 Haworth projection of glucose.
Stereoisomers
The central carbons of a carbohydrate are asymmetric (chiral)—four different groups are attached to the carbon atoms. This allows for various spatial arrangements around each asymmetric carbon (also called stereogenic centers) forming molecules called stereoisomers. Stereoisomers have the same order and types of bonds but different spatial arrangements and different properties. For each asymmetric carbon, there are 2n possible isomers; therefore, there are 21, or two, forms of glyceraldehyde. Because an aldohexose contains four asymmetric carbons, there are 24, or 16, possible isomers. A monosaccharide is assigned to the D or the L series according to the configuration at the highest numbered asymmetric carbon. This asymmetrically substituted carbon atom is called the “configurational atom” or chiral center. Thus, if the hydroxyl group (or the oxygen bridge of the ring form) projects to the right in the Fisher projection, the sugar belongs to the D series and receives the prefix d-, and if it projects to the left, then it belongs to the L series and receives the prefix l-. These stereoisomers, called enantiomers, are images that cannot be overlapped and are nonsuperimposable. In Figure 14.5, d-glucose is represented in the Fisher projection with the hydroxyl group on carbon number 5 positioned on the right. l-glucose has the hydroxyl group of carbon number 5 positioned on the left. Most sugars in humans are in the d-form.
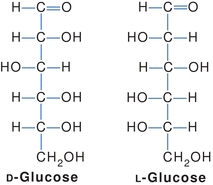
FIGURE 14.5 Stereoisomers of glucose.
Monosaccharides, Disaccharides, and Polysaccharides
Another classification of carbohydrates is based on the number of sugar units in the chain: monosaccharides, disaccharides, oligosaccharides, and polysaccharides. This chaining of sugars relies on the formation of glycoside bonds that are bridges of oxygen atoms. When two carbohydrate molecules join, a water molecule is produced. When they split, one molecule of water is used to form the individual compounds. This reaction is called hydrolysis. The glycoside linkages of carbohydrate can involve any number of carbons; however, certain carbons are favored, depending on the carbohydrate.
Monosaccharides are simple sugars that cannot be hydrolyzed to a simpler form. These sugars can contain three, four, five, and six or more carbon atoms (known as trioses, tetroses, pentoses, and hexoses, respectively). The most common include glucose, fructose, and galactose.
Disaccharides are formed when two monosaccharide units are joined by a glycosidic linkage. On hydrolysis, disaccharides will be split into two monosaccharides by disaccharide enzymes (e.g., lactase) located on the microvilli of the intestine. These monosaccharides are then actively absorbed. The most common disaccharides are maltose (comprising two d-glucose molecules in a 1 → 4 linkage), lactose, and sucrose.
Oligosaccharides are the chaining of 2 to 10 sugar units, whereas polysaccharides are formed by the linkage of many monosaccharide units. On hydrolysis, polysaccharides will yield more than 10 monosaccharides. Amylase hydrolyzes starch to disaccharides in the duodenum. The most common polysaccharides are starch (glucose molecules) and glycogen (Fig. 14.6).

FIGURE 14.6 Linkage of monosaccharides.
Chemical Properties of Carbohydrates
Some carbohydrates are reducing substances; these carbohydrates can reduce other compounds. To be a reducing substance, the carbohydrate must contain a ketone or an aldehyde group. This property was used in many laboratory methods in the past in the determination of carbohydrates.
Carbohydrates can form glycosidic bonds with other carbohydrates and with noncarbohydrates. Two sugar molecules can be joined in tandem forming a glycosidic bond between the hemiacetal group of one molecule and the hydroxyl group on the other molecule. In forming the glycosidic bond, an acetal is generated on one sugar (at carbon 1) in place of the hemiacetal. If the bond forms with one of the other carbons on the carbohydrate other than the anomeric (reducing) carbon, the anomeric carbon is unaltered and the resulting compound remains a reducing substance. Examples of reducing substances include glucose, maltose, fructose, lactose, and galactose. If the bond is formed with the anomeric carbon on the other carbohydrate, the resulting compound is no longer a reducing substance. Nonreducing carbohydrates do not have an active ketone or aldehyde group. They will not reduce other compounds. The most common nonreducing sugar is sucrose—table sugar (Fig. 14.7).

FIGURE 14.7 Haworth projection of sucrose.
All monosaccharides and many disaccharides are reducing agents. This is because a free aldehyde or ketone (the open-chain form) can be oxidized under the proper conditions. As disaccharide remains a reducing agent when the hemiacetal or ketal hydroxyl group is not linked to another molecule, both maltose and lactose are reducing agents, whereas sucrose is not.
Glucose Metabolism
Glucose is a primary source of energy for humans. The nervous system, including the brain, totally depends on glucose from the surrounding extracellular fluid (ECF) for energy. Nervous tissue cannot concentrate or store carbohydrates; therefore, it is critical to maintain a steady supply of glucose to the tissue. For this reason, the concentration of glucose in the ECF must be maintained in a narrow range. When the concentration falls below a certain level, the nervous tissue loses the primary energy source and is incapable of maintaining normal function.
Fate of Glucose
Most of our ingested carbohydrates are polymers, such as starch and glycogen. Salivary amylase and pancreatic amylase are responsible for the digestion of these nonabsorbable polymers to dextrins and disaccharides, which are further hydrolyzed to monosaccharides by maltase, an enzyme released by the intestinal mucosa. Sucrase and lactase are two other important gut-derived enzymes that hydrolyze sucrose to glucose and fructose and lactose to glucose and galactose.
When disaccharides are converted to monosaccharides, they are absorbed by the gut and transported to the liver by the hepatic portal venous blood supply. Glucose is the only carbohydrate to be directly used for energy or stored as glycogen. Galactose and fructose must be converted to glucose before they can be used. After glucose enters the cell, it is quickly shunted into one of three possible metabolic pathways, depending on the availability of substrates or the nutritional status of the cell. The ultimate goal of the cell is to convert glucose to carbon dioxide and water. During this process, the cell obtains the high-energy molecule adenosine triphosphate (ATP) from inorganic phosphate and adenosine diphosphate. The cell requires oxygen for the final steps in the electron transport chain (ETC). Nicotinamide adenine dinucleotide (NAD) in its reduced form (NADH) will act as an intermediate to couple glucose oxidation to the ETC in the mitochondria where much of the ATP is gained.
The first step for all three pathways requires glucose to be converted to glucose-6-phosphate using the high-energy molecule, ATP. This reaction is catalyzed by the enzyme hexokinase (Fig. 14.8). Glucose-6-phosphate can enter the Embden-Meyerhof pathway or the hexose monophosphate pathway (HMP) or can be converted to glycogen (Fig. 14.8). The first two pathways are important for the generation of energy from glucose; the conversion to glycogen pathway is important for the storage of glucose.
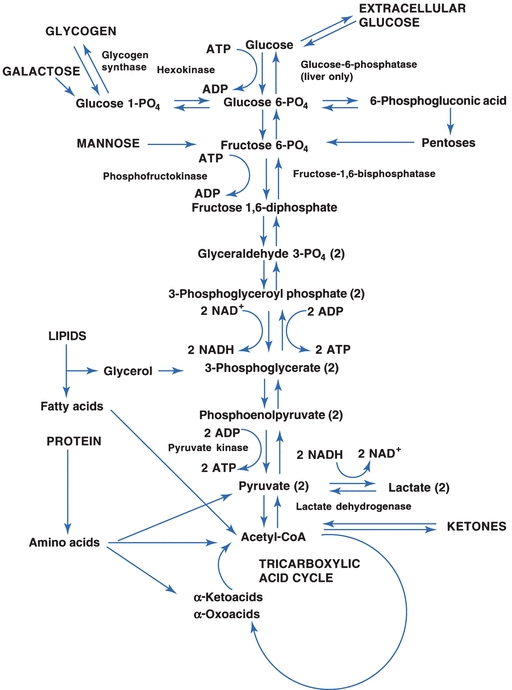
FIGURE 14.8 The Embden-Meyerhof pathway for anaerobic glycolysis.
In the Embden-Meyerhof pathway, glucose is broken down into two- and three-carbon molecules of pyruvic acid that can enter the tricarboxylic acid (TCA) cycle on conversion to acetyl-coenzyme A (acetyl-CoA). This pathway requires oxygen and is called the aerobic pathway (Fig. 14.8). Other substrates have the opportunity to enter the pathway at several points. Glycerol released from the hydrolysis of triglycerides can enter at 3-phosphoglycerate, and fatty acids and ketones and some amino acids are converted or catabolized to acetyl-CoA, which is part of the TCA cycle. Other amino acids enter the pathway as pyruvate or as deaminated α-ketoacids and α-oxoacids. The conversion of amino acids by the liver and other specialized tissue, such as the kidney, to substrates that can be converted to glucose is called gluconeogenesis. Gluconeogenesis also encompasses the conversion of glycerol, lactate, and pyruvate to glucose.
Anaerobic glycolysis is important for tissue such as muscle, which often have important energy requirements without an adequate oxygen supply. These tissues can derive ATP from glucose in an oxygen-deficient environment by converting pyruvic acid into lactic acid. The lactic acid diffuses from the muscle cell, enters the systemic circulation, and is then taken up and used by the liver (Fig. 14.8). For anaerobic glycolysis to occur, 2 mol of ATP must be consumed for each mole of glucose; however, 4 mol of ATP are directly produced, resulting in a net gain of 2 mol of ATP. Further gains of ATP result from the introduction of pyruvate into the TCA cycle and NADH into the ETC.
The second energy pathway is the HMP shunt, which is actually a detour of glucose-6-phosphate from the glycolytic pathway to become 6-phosphogluconic acid. This oxidized product permits the formation of ribose-5-phosphate and NADP in its reduced form (NADPH). NADPH is important to erythrocytes that lack mitochondria and are therefore incapable of the TCA cycle. The reducing power of NADPH is required for the protection of the cell from oxidative and free radical damage. Without NADPH, the lipid bilayer membrane of the cell and critical enzymes would eventually be destroyed, resulting in cell death. The HMP shunt also permits pentoses, such as ribose, to enter the glycolytic pathway.
When the cell’s energy requirements are being met, glucose can be stored as glycogen. This third pathway, which is called glycogenesis, is relatively straightforward. Glucose-6-phosphate is converted to glucose-1-phosphate, which is then converted to uridine diphosphoglucose and then to glycogen by glycogen synthase. Several tissues are capable of the synthesis of glycogen, especially the liver and muscles. Hepatocytes are capable of releasing glucose from glycogen or other sources to maintain the blood glucose concentration. This is because the liver synthesizes the enzyme glucose-6-phosphatase. Without this enzyme, glucose is trapped in the glycolytic pathway. Muscle cells do not synthesize glucose-6-phosphatase and, therefore, they are incapable of dephosphorylating glucose. Once glucose enters a muscle cell, it remains as glycogen unless it is catabolized. Glycogenolysis is the process by which glycogen is converted back to glucose-6-phosphate for entry into the glycolytic pathway. Table 14.1 outlines the major energy pathways involved either directly or indirectly with glucose metabolism.
TABLE 14.1 Pathways in Glucose Metabolism
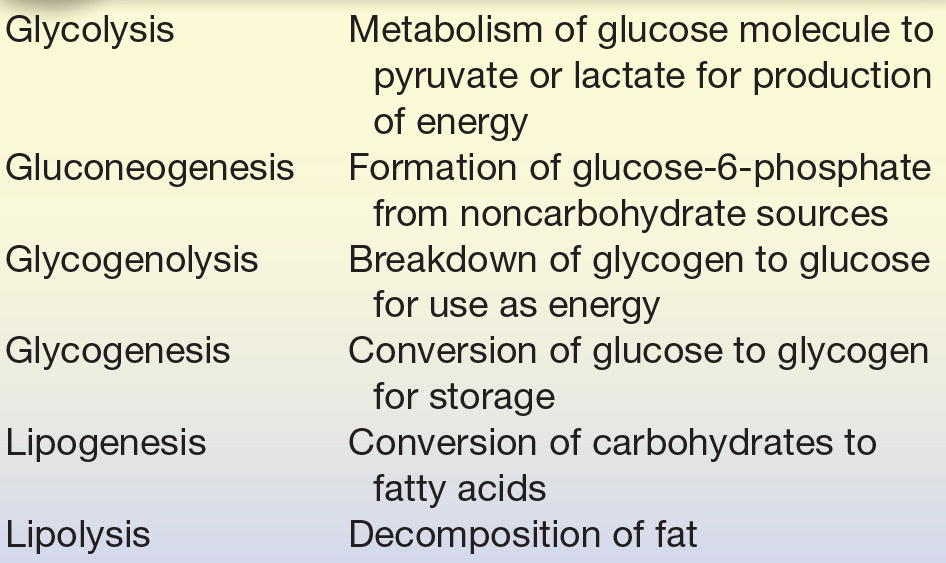
Overall, dietary glucose and other carbohydrates either can be used by the liver and other cells for energy or can be stored as glycogen for later use. When the supply of glucose is low, the liver will use glycogen and other substrates to elevate the blood glucose concentration. These substrates include glycerol from triglycerides, lactic acid from skin and muscles, and amino acids. If the lipolysis of triglycerides is unregulated, it results in the formation of ketone bodies, which the brain can use as a source of energy through the TCA cycle. The synthesis of glucose from amino acids is gluconeogenesis. This process is used in conjunction with the formation of ketone bodies when glycogen stores are depleted—conditions normally associated with starvation. The principal pathway for glucose oxidation is through the Embden-Meyerhof pathway. NADPH can be synthesized through the HMP shunt, which is a side pathway from the anaerobic glycolytic pathway (Fig. 14.8).
Regulation of Carbohydrate Metabolism
The liver, pancreas, and other endocrine glands are all involved in controlling the blood glucose concentrations within a narrow range. During a brief fast, glucose is supplied to the ECF from the liver through glycogenolysis. When the fasting period is longer than 1 day, glucose is synthesized from other sources through gluconeogenesis. Control of blood glucose is under two major hormones: insulin and glucagon, both produced by the pancreas. Their actions oppose each other. Other hormones and neuroendocrine substances also exert some control over blood glucose concentrations, permitting the body to respond to increased demands for glucose or to survive prolonged fasts. It also permits the conservation of energy as lipids when excess substrates are ingested.
Insulin is the primary hormone responsible for the entry of glucose into the cell. It is synthesized by the β-cells of islets of Langerhans in the pancreas. When these cells detect an increase in body glucose, they release insulin. The release of insulin causes an increased movement of glucose into the cells and increased glucose metabolism. Insulin is normally released when glucose levels are high and is not released when glucose levels are decreased. It decreases plasma glucose levels by increasing the transport entry of glucose in muscle and adipose tissue by way of nonspecific receptors. It also regulates glucose by increasing glycogenesis, lipogenesis, and glycolysis and inhibiting glycogenolysis. Insulin is the only hormone that decreases glucose levels and can be referred to as a hypoglycemic agent (Table 14.2).
TABLE 14.2 The Action of Hormones

Glucagon is the primary hormone responsible for increasing glucose levels. It is synthesized by the α-cells of islets of Langerhans in the pancreas and released during stress and fasting states. When these cells detect a decrease in body glucose, they release glucagon. Glucagon acts by increasing plasma glucose levels by glycogenolysis in the liver and an increase in gluconeogenesis. It can be referred to as a hyperglycemic agent (Table 14.2).
Two hormones produced by the adrenal gland affect carbohydrate metabolism. Epinephrine, produced by the adrenal medulla, increases plasma glucose by inhibiting insulin secretion, increasing glycogenolysis, and promoting lipolysis. Epinephrine is released during times of stress. Glucocorticoids, primarily cortisol, are released from the adrenal cortex on stimulation by adrenocorticotropic hormone (ACTH). Cortisol increases plasma glucose by decreasing intestinal entry into the cell and increasing gluconeogenesis, liver glycogen, and lipolysis.
Two anterior pituitary hormones, growth hormone and ACTH, promote increased plasma glucose. Growth hormone increases plasma glucose by decreasing the entry of glucose into the cells and increasing glycolysis. Its release from the pituitary is stimulated by decreased glucose levels and inhibited by increased glucose. Decreased levels of cortisol stimulate the anterior pituitary to release ACTH. ACTH, in turn, stimulates the adrenal cortex to release cortisol and increases plasma glucose levels by converting liver glycogen to glucose and promoting gluconeogenesis.
Two other hormones affect glucose levels: thyroxine and somatostatin. The thyroid gland is stimulated by the production of thyroid-stimulating hormone to release thyroxine that increases plasma glucose levels by increasing glycogenolysis, gluconeogenesis, and intestinal absorption of glucose. Somatostatin, produced by the δ-cells of the islets of Langerhans of the pancreas, increases plasma glucose levels by the inhibition of insulin, glucagon, growth hormone, and other endocrine hormones.
HYPERGLYCEMIA
Hyperglycemia is an increase in plasma glucose levels. In healthy patients, during a hyperglycemia state, insulin is secreted by the β-cells of the pancreatic islets of Langerhans. Insulin enhances membrane permeability to cells in the liver, muscle, and adipose tissue. It also alters the glucose metabolic pathways. Hyperglycemia, or increased plasma glucose levels, is caused by an imbalance of hormones.
Diabetes Mellitus
Diabetes mellitus is actually a group of metabolic diseases characterized by hyperglycemia resulting from defects in insulin secretion, insulin action, or both. In 1979, the National Diabetes Data Group developed a classification and diagnosis scheme for diabetes mellitus.1 This scheme included dividing diabetes into two broad categories: type 1, insulin-dependent diabetes mellitus (IDDM), and type 2, non–insulin-dependent diabetes mellitus (NIDDM).
Established in 1995, the International Expert Committee on the Diagnosis and Classification of Diabetes Mellitus, working under the sponsorship of the ADA, was given the task of updating the 1979 classification system. The proposed changes included eliminating the older terms of IDDM and NIDDM. The categories of type 1 and type 2 were retained, with the adoption of Arabic numerals instead of Roman numerals (Table 14.3).2
TABLE 14.3 Classification of Diabetes Mellitus
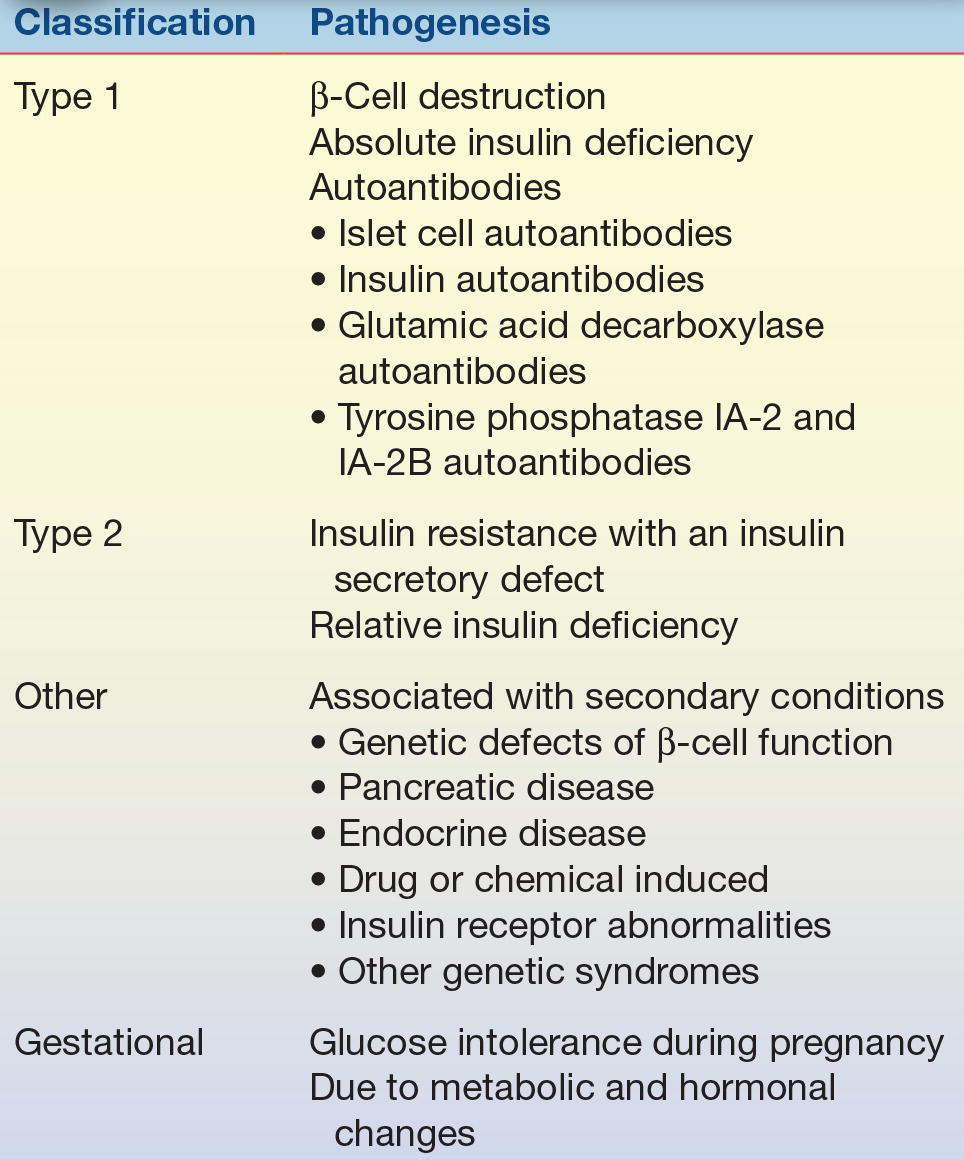
Therefore, the ADA/World Health Organization (WHO) guidelines recommend the following categories of diabetes:
- Type 1 diabetes
- Type 2 diabetes
- Other specific types of diabetes
- Gestational diabetes mellitus (GDM) (diagnosed in the second or third trimester of pregnancy that is not clearly overt diabetes)
CASE STUDY 14.1
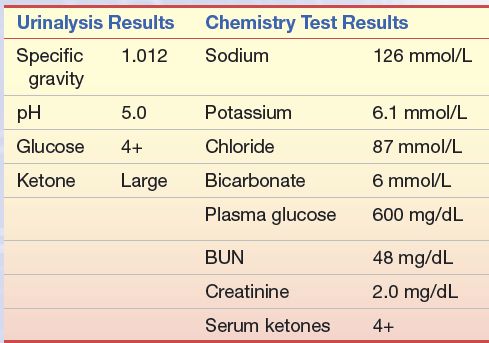
An 18-year-old male high school student who had a 4-year history of diabetes mellitus was brought to the emergency department because of excessive drowsiness, vomiting, and diarrhea. His diabetes had been well controlled with 40 units of NPH insulin daily until several days ago when he developed excessive thirst and polyuria. For the past 3 days, he has also had headaches, myalgia, and a low-grade fever. Diarrhea and vomiting began 1 day ago.
questions
1. What is the probable diagnosis of this patient based on the data presented?
2. What laboratory test(s) should be performed to follow this patient and aid in adjusting insulin levels?
3. Why are the urine ketones positive?
4. What methods are used to quantitate urine ketones? Which ketone(s) do they detect?
Type 1 diabetes is characterized by inappropriate hyperglycemia primarily a result of pancreatic islet β-cell destruction and a tendency to ketoacidosis. Type 2 diabetes, in contrast, includes hyperglycemia cases that result from insulin resistance with an insulin secretory defect. An intermediate stage, in which the fasting glucose is increased above normal limits but not to the level of diabetes, has been named impaired fasting glucose. Use of the term impaired glucose tolerance to indicate glucose tolerance values above normal but below diabetes levels was retained. Also, the term GDM was retained for women who develop glucose intolerance during pregnancy.
Type 1 diabetes mellitus is a result of cellular-mediated autoimmune destruction of the β-cells of the pancreas, causing an absolute deficiency of insulin secretion. Upper limit of 110 mg/dL on the fasting plasma glucose is designated as the upper limit of normal blood glucose. Type 1 constitutes only 10% to 20% of all cases of diabetes and commonly occurs in childhood and adolescence. This disease is usually initiated by an environmental factor or infection (usually a virus) in individuals with a genetic predisposition and causes the immune destruction of the β-cells of the pancreas and, therefore, a decreased production of insulin. Characteristics of type 1 diabetes include abrupt onset, insulin dependence, and ketosis tendency. This diabetic type is genetically related. One or more of the following markers are found in 85% to 90% of individuals with fasting hyperglycemia: islet cell autoantibodies, insulin autoantibodies, glutamic acid decarboxylase autoantibodies, and tyrosine phosphatase IA-2 and IA-2B autoantibodies.
Signs and symptoms include polydipsia (excessive thirst), polyphagia (increased food intake), polyuria (excessive urine production), rapid weight loss, hyperventilation, mental confusion, and possible loss of consciousness (due to increased glucose to brain). Complications include microvascular problems such as nephropathy, neuropathy, and retinopathy. Increased heart disease is also found in patients with diabetes. Table 14.4 lists the laboratory findings in hyperglycemia. Idiopathic type 1 diabetes is a form of type 1 diabetes that has no known etiology, is strongly inherited, and does not have β-cell autoimmunity. Individuals with this form of diabetes have episodic requirements for insulin replacement.
TABLE 14.4 Laboratory Findings in Hyperglycemia

Type 2 diabetes mellitus is characterized by hyperglycemia as a result of an individual’s resistance to insulin with an insulin secretory defect. This resistance results in a relative, not an absolute, insulin deficiency. Type 2 constitutes the majority of the diabetes cases. Most patients in this type are obese or have an increased percentage of body fat distribution in the abdominal region. This type of diabetes often goes undiagnosed for many years and is associated with a strong genetic predisposition, with patients at increased risk with an increase in age, obesity, and lack of physical exercise. Characteristics usually include adult onset of the disease and milder symptoms than in type 1, with ketoacidosis seldom occurring. However, these patients are more likely to go into a hyperosmolar coma and are at an increased risk of developing macrovascular and microvascular complications.
Other specific types of diabetes are associated with certain conditions (secondary), including genetic defects of β-cell function or insulin action, pancreatic disease, diseases of endocrine origin, drug- or chemical-induced insulin receptor abnormalities, and certain genetic syndromes. The characteristics and prognosis of this form of diabetes depend on the primary disorder. Maturity-onset diabetes of youth is a rare form of diabetes that is inherited in an autosomal dominant fashion.3
GDM has been defined as any degree of glucose intolerance with onset or first recognition during pregnancy. However, the latest recommendations suggest that “high-risk women found to have diabetes at their initial prenatal visit, using standard criteria (Table 14.5), receive a diagnosis of overt, not gestational, diabetes.”4 Women identified through the oral glucose tolerance, listed in Table 14.8, should receive a diagnosis of GDM. Causes of GDM include metabolic and hormonal changes. Patients with GDM frequently return to normal postpartum. However, this disease is associated with increased perinatal complications and an increased risk for the development of diabetes in later years. Infants born to mothers with diabetes are at increased risk for respiratory distress syndrome, hypocalcemia, and hyperbilirubinemia. Fetal insulin secretion is stimulated in the neonate of a mother with diabetes. However, when the infant is born and the umbilical cord is severed, the infant’s oversupply of glucose is abruptly terminated, causing severe hypoglycemia.
TABLE 14.5 Diagnostic Criteria for Diabetes Mellitus
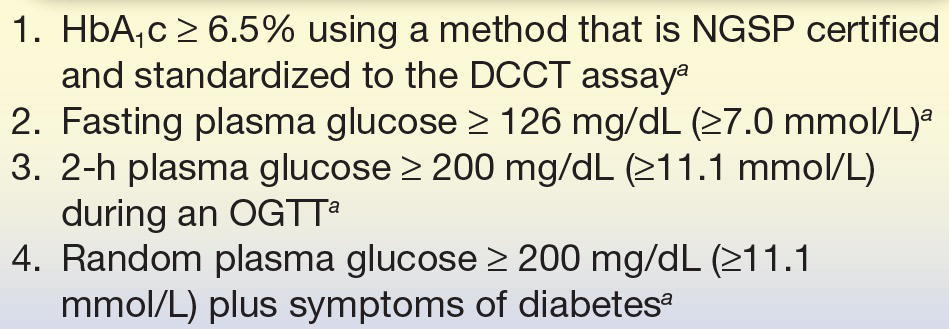
HbA1c, hemoglobin A1c; NGSP, National Glycohemoglobin Standardization Program; OGTT, oral glucose tolerance test.
aIn the absence of unequivocal hyperglycemia, these criteria should be confirmed by repeat testing on a different day. The fourth measure (OGTT) is not recommended for routine clinical use.
Pathophysiology of Diabetes Mellitus
In both type 1 and type 2 diabetes, the individual will be hyperglycemic, which can be severe. Glucosuria can also occur after the renal tubular transporter system for glucose becomes saturated. This happens when the glucose concentration of plasma exceeds roughly 180 mg/dL in an individual with normal renal function and urine output. As hepatic glucose overproduction continues, the plasma glucose concentration reaches a plateau around 300 to 500 mg/dL (17 to 28 mmol/L). Provided renal output is maintained, glucose excretion will match the overproduction, causing the plateau.
The individual with type 1 diabetes has a higher tendency to produce ketones. Patients with type 2 diabetes seldom generate ketones but instead have a greater tendency to develop hyperosmolar nonketotic states. The difference in glucagon and insulin concentrations in these two groups appears to be responsible for the generation of ketones through increased β-oxidation. In type 1, there is an absence of insulin with an excess of glucagon. This permits gluconeogenesis and lipolysis to occur. In type 2, insulin is not absent and may, in fact, present as hyperinsulinemia at times; therefore, glucagon is attenuated. Fatty acid oxidation is inhibited in type 2. This causes fatty acids to be incorporated into triglycerides for release as very low-density lipoproteins.
The laboratory findings of a patient with diabetes with ketoacidosis tend to reflect dehydration, electrolyte disturbances, and acidosis. Acetoacetate, β-hydroxybutyrate, and acetone are produced from the oxidation of fatty acids. The two former ketone bodies contribute to the acidosis. Lactate, fatty acids, and other organic acids can also contribute to a lesser degree. Bicarbonate and total carbon dioxide are usually decreased due to Kussmaul-Kien respiration (deep respirations). This is a compensatory mechanism to blow off carbon dioxide and remove hydrogen ions in the process. The anion gap in this acidosis can exceed 16 mmol/L. Serum osmolality is high as a result of hyperglycemia; sodium concentrations tend to be lower due in part to losses (polyuria) and in part to a shift of water from cells because of the hyperglycemia. The sodium value should not be falsely underestimated because of hypertriglyceridemia. Grossly elevated triglycerides will displace plasma volume and give the appearance of decreased electrolytes when flame photometry or prediluted, ion-specific electrodes are used for sodium determinations. Hyperkalemia is almost always present as a result of the displacement of potassium from cells in acidosis. This is somewhat misleading because the patient’s total body potassium is usually decreased.
More typical of the untreated patient with type 2 diabetes is the nonketotic hyperosmolar state. The individual presenting with this syndrome has an overproduction of glucose; however, there appears to be an imbalance between production and elimination in urine. Often, this state is precipitated by heart disease, stroke, or pancreatitis. Glucose concentrations exceed 300 to 500 mg/dL (17 to 28 mmol/L) and severe dehydration is present. The severe dehydration contributes to the inability to excrete glucose in the urine. Mortality is high with this condition. Ketones are not observed because the severe hyperosmolar state inhibits the ability of glucagon to stimulate lipolysis. The laboratory findings of nonketotic hyperosmolar coma include plasma glucose values exceeding 1,000 mg/dL (55 mmol/L), normal or elevated plasma sodium and potassium, slightly decreased bicarbonate, elevated blood urea nitrogen (BUN) and creatinine, and an elevated osmolality (>320 mOsm/dL). The gross elevation in glucose and osmolality, the elevation in BUN, and the absence of ketones distinguish this condition from diabetic ketoacidosis.
Other forms of impaired glucose metabolism that do not meet the criteria for diabetes mellitus include impaired fasting glucose and impaired glucose tolerance. These forms are discussed in the following section.
CASE STUDY 14.2
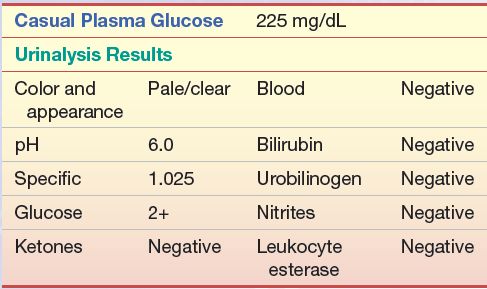
A 58-year-old obese man with frequent urination was seen by his primary care physician. The following laboratory work was performed, and the following results were obtained:
Questions
1. What is the probable diagnosis of this patient?
2. What other test(s) should be performed to confirm this? Which is the preferred test?
3. What values from no. 2 would confirm the diagnosis of diabetes?
4. After diagnosis, what test(s) should be performed to monitor his condition?
Criteria for Testing for Prediabetes and Diabetes
The testing criteria for asymptomatic adults for type 2 diabetes mellitus were modified by the ADA Expert Committee to allow for earlier detection of the disease. According to the ADA recommendations, all adults beginning at the age of 45 years should be tested for diabetes every 3 years using the hemoglobin A1c (HbA1c), fasting plasma glucose, or a 2-hour 75 g oral glucose tolerance test (OGTT) unless the individual has otherwise been diagnosed with diabetes.4 Testing should be carried out at an earlier age or more frequently in individuals who display overweight tendencies, that is, BMI greater than or equal to 25 kg/m2 (at-risk BMI may be lower in some ethnic groups, i.e., Asian Americans ≥23 kg/m2), and have additional risk factors, as follows:
- Habitually physically inactive
- Family history of diabetes in a first-degree relative
- In a high-risk minority population (e.g., African American, Latino, Native American, Asian American, and Pacific Islander)
- History of GDM or delivering a baby weighing more than 9 lb (4.1 kg)
- Hypertension (blood pressure ≥ 140/90 mm Hg)
- Low high-density lipoprotein (HDL) cholesterol concentrations (<35 mg/dL [0.90 mmol/L])
- Elevated triglyceride concentrations > 250 mg/dL (2.82 mmol/L)
- A1C ≥ 5.7% (33 mmol/mol), IGT, or IFG on previous testing
- History of impaired fasting glucose/impaired glucose tolerance
- Women with polycystic ovarian syndrome (PCOS)
- Other clinical conditions associated with insulin resistance (e.g., severe obesity and acanthosis nigricans)
- History of cardiovascular disease
In the absence of the above criteria, testing for prediabetes and diabetes should begin at the age of 45 years. If results are normal, testing should be repeated at least at 3-year intervals, with consideration of more frequent testing depending on initial results and risk status.
As the incidence of adolescent type 2 diabetes has risen dramatically in the past few years, criteria for the testing for type 2 diabetes in asymptomatic children have been developed. These criteria include initiation of testing at the age 10 years or at the onset of puberty, if puberty occurs at a younger age, with follow-up testing every 2 years. Testing should be carried out on children who display the following characteristics: overweight (BMI >85th percentile for age and sex, weight for height >85th percentile, or weight >120% of ideal for height) plus any two of the following risk factors:
- Family history of type 2 diabetes in first- or second-degree relative
- Race/ethnicity (e.g., Native American, African American, Latino, Asian American, and Pacific Islander)
- Signs of insulin resistance or conditions associated with insulin resistance (e.g., acanthosis nigricans, hypertension, dyslipidemia, and PCOS)
- Maternal history of diabetes or GDM
CASE STUDY 14.3
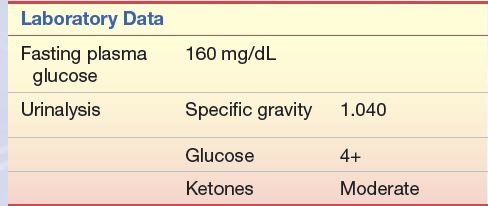
A 14-year-old male student was seen by his physician. His chief complaints were fatigue, weight loss, and increases in appetite, thirst, and frequency of urination. For the past 3 to 4 weeks, he had been excessively thirsty and had to urinate every few hours. He began to get up three to four times a night to urinate. The patient has a family history of diabetes mellitus.
Stay updated, free articles. Join our Telegram channel

Full access? Get Clinical Tree


