Perspiration
 Expired air
 Milk
Milk
 Other body fluids
Drugs that are excreted via expired air may change the odor of the breath. Drugs excreted through body fluids can sometimes be identified, since they can discolor the fluid, skin, or mucous membrane where the drug is eliminated. There are a few drugs that are notorious for having this type of discoloration. These include: rifampin (has an orange tinge on body fluids), daunorubicin (causes a reddish discoloration), and mitoxantrone (causes a blue/green tinge).
Pharmacokinetics
The next step involved in reviewing the disposition of medications once they are ingested and undergo ADME is to look at the time course of these processes, or rates of ADME. The relationship between the intensity and time course of ADME can be related to the therapeutic and/or adverse effects of drugs.
Here is a graphic depiction of ADME:
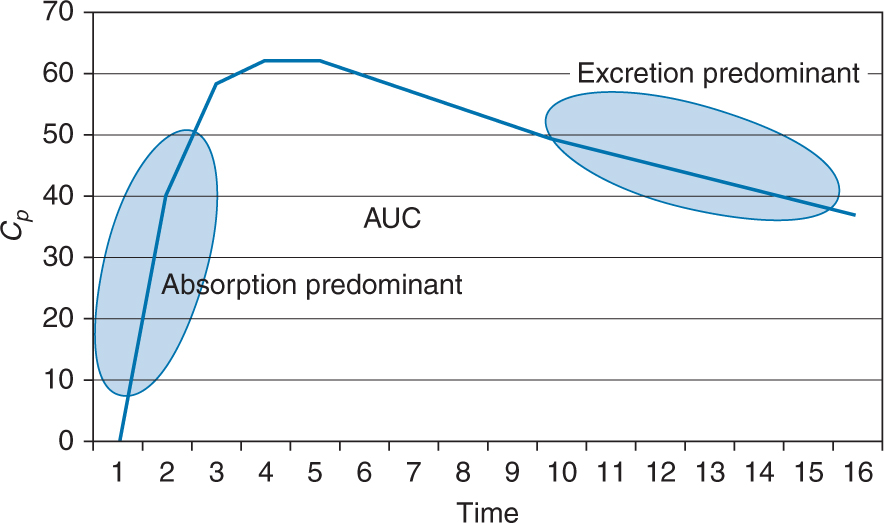
There are various terms that need to be defined for the purposes of understanding the basics of pharmacokinetics.
• Bioavailability is the percentage of the administered dose that reaches the systemic circulation (ie, is absorbed) and is able to exert its pharmacologic effect.
 It is influenced by
 The physical properties of the drug
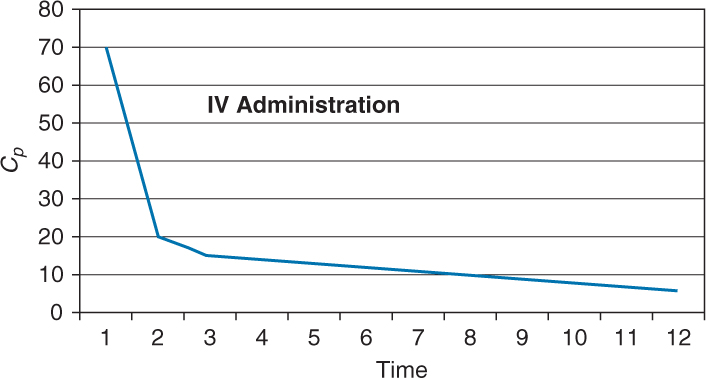
 The route of administration (IV route has 100% bioavailability)
 The dosage form and/or its formulation
 The conditions under which the drug is administered (ie, fasting or fed)
 Circadian and individual differences
 Metabolic enzyme induction or inhibition by other drugs or foods
 First pass metabolism
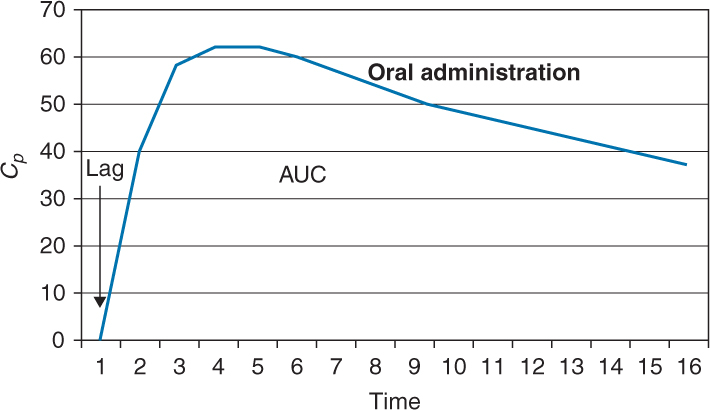
 It is graphically represented by the area under the curve (AUC)
 A lag time can be observed after oral administration and is seen graphically as a zero plasma concentration for the first few time intervals after the dose is administered.
 Can be increased or decreased based upon all the factors previously discussed that affect oral absorption (ie, particle size, ionization, formulation, etc)
Here is a graphic depiction of IV Administration.
Here is graphic depiction of oral administration with lag time.
Bioequivalence
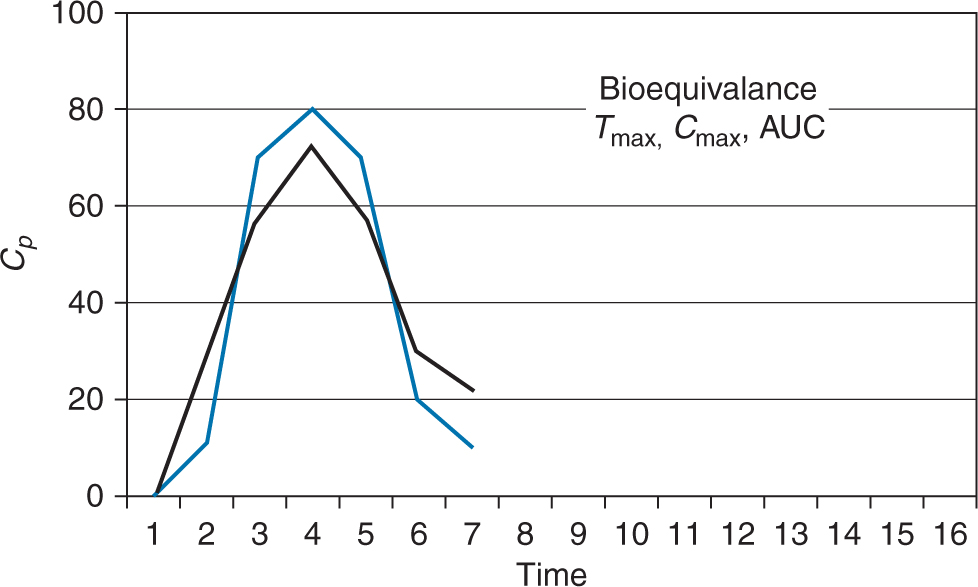
The comparison of bioavailability relative to another formulation of the same drug is termed bioequivalence and is used in the comparison between generic and brand name drugs. The caveat for bioequivalence comparisons is that the drugs are given
1. In the same dose
2. Via the same route
3. Under the same conditions (ie, food, time of day, etc)
When considering bioequivalence, there are only three pharmacokinetic parameters that must be considered:
 Maximum plasma concentration of drug (Cmax)
 Time to reach maximum plasma concentration of drug (Tmax)
 Area under the curve (bioavailability)
For generic drugs to be deemed bioequivalent to the brand name drug by the FDA, the above parameters must fall within the 90% confidence interval. In other words, the FDA accepts 80% to 125% (in the fasting state) of Cmax, Tmax, and AUC of the generic formulation versus the brand name.
First pass metabolism. This is a process whereby the concentration of the drug is greatly reduced before it reaches the systemic circulation to be able to exert its pharmacologic action. This process occurs when drugs are absorbed through the GI tract, travel to the liver via the portal vein and are immediately metabolized (ie, first pass through the liver). This first pass through the liver reduces the bioavailability of the drug. Examples of drugs that exhibit first pass metabolism are propranolol and imipramine.
Other routes of administration (such as suppository, IV, IM, sublingual, etc) avoid first pass because the drug is absorbed into the systemic circulation, not the portal circulation.
Plasma concentration (Cp). This is the total amount of drug in the plasma. It includes both bound and unbound drug although only the unbound drug can exert pharmacologic effects. Cp is monitored during therapy to ensure appropriate therapeutic ranges and to avoid potentially toxic levels. Clinical activity will be evident as long as Cp is above the minimum effective concentration (MEC). The MEC is the Cp level at which clinical activity is observed.
Loading Dose (DL)
Steady-state concentration (Css) is the preferred drug concentration in drug therapy as it avoids peaks and troughs (supra- or subtherapeutic levels). The loading dose is the amount of drug usually administered as an IV bolus to produce steady-state concentration as soon as possible. It usually takes 4 to 6 half lives of the drug to reach 95% to 99% steady-state concentration. The loading dose can be calculated if the target steady-state concentration and volume of distribution are known:
DL = Css Vd
Volume of Distribution (Vd)
Volume of distribution is a mathematical parameter that is the hypothetical volume of body fluid that would be required to dissolve the entire amount of drug in the body at the same concentration as that found in the plasma.
Since it is a hypothetical parameter, sometimes, upon calculation the volume is larger than reasonable for a human body’s worth of body fluids. This Vd value represents the distribution of a drug that is not found, or is in low concentration in the plasma and is preferentially distributed to tissues and/or fat. (The concentration in the plasma is very low.)
A drug that is highly protein bound, meaning that it stays in the circulation, will have a relatively low volume of distribution. Conversely, a lipid soluble drug will have a high volume of distribution.
The formula for volume of distribution is

Biological Half-Life (T1/2)
The half-life is the time necessary for the amount of drug in the plasma, C, to decrease by one-half. It is independent of the dose, route of administration or plasma concentration and is an indicator of the pharmacologic effects of the drug. It is also important in determining the optimum dosing interval. The formula for half-life is

Elimination Rate Constant (Ke)
The elimination rate constant is the percentage of the total amount of drug in the body that is removed over time. Removal of drug includes metabolism, excretion, biliary secretion, and the like. The formula for Ke is

Zero versus First Order Rates of Reaction
Rates of reaction describe the characteristics observed in rates of processes such as ADME. In graphic form, only absorption and excretion can be isolated on the curve. Zero order processes are ones in which the rate of the process is constant and, when graphed, is a straight line. First order processes are ones in which the rate of the process changes as a function of the plasma concentration of drug. For example, the rate of excretion would increase as Cp increases. When graphed, first order processes are a curve on regular paper. If graphed on semilog paper, these processes appear as a straight line.

Practice Problem 1
The graph below applies to a series of questions and conclusions that can be made.
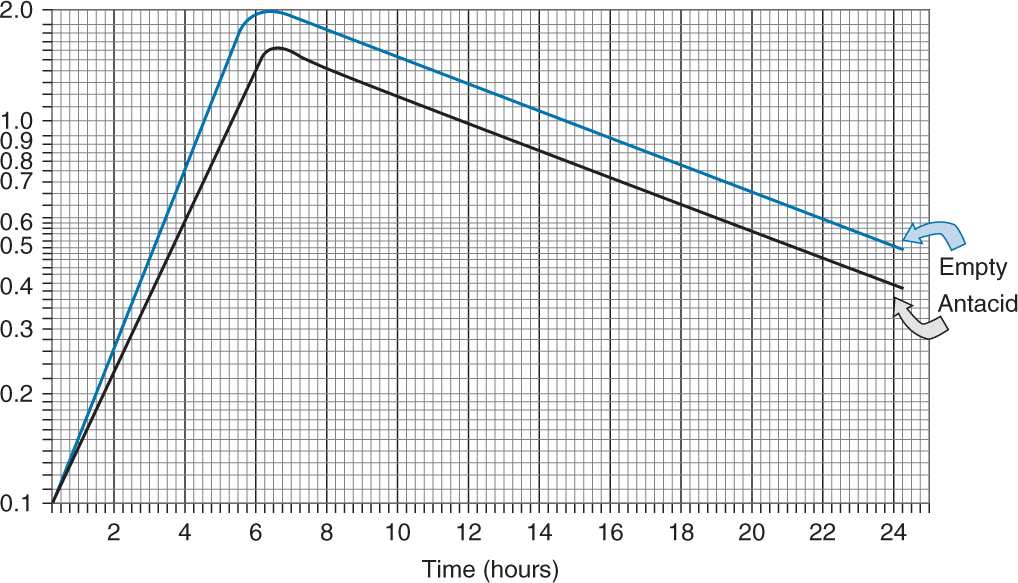
The pharmacist has been reviewing the literature regarding ketoconazole. The above graph depicts the effects of ketoconazole taken on an empty stomach (upper line) and taken with antacid (lower line).
Practice Problem 1 Part A
A. True or False… The excretion half-lives of the drug taken with antacid or on an empty stomach are not equal.
Answer Part A Practice Problem 1
False
 the slope of elimination is Ke and the portions of the lines depicting excretion are parallel to each other; therefore, their slopes are equal.
If the slopes are equal, then their excretion rates are the same.
So if Ke(empty stomach) = Ke(antacid), then Tl/2(empty stomach) = Tl/2(antacid)
Practice Problem 1 Part B
B. True or False… The time to reach Cmax is approximately the same for both regimens.
< div class='tao-gold-member'>


