Assessment of Nutrition Status and Nutrition Requirements
KEY CONCEPTS
![]() Malnutrition is a consequence of nutrient imbalance, overnutrition or undernutrition, and has a high prevalence in the United States.
Malnutrition is a consequence of nutrient imbalance, overnutrition or undernutrition, and has a high prevalence in the United States.
![]() Nutrition screening is distinct from assessment and should be designed to quickly and reliably identify those who are at risk of nutrition-related poor outcomes.
Nutrition screening is distinct from assessment and should be designed to quickly and reliably identify those who are at risk of nutrition-related poor outcomes.
![]() A comprehensive nutrition assessment is the first step in formulating a nutrition care plan for a patient who is found to be nutritionally at risk.
A comprehensive nutrition assessment is the first step in formulating a nutrition care plan for a patient who is found to be nutritionally at risk.
![]() A nutrition-focused medical, surgical, and dietary history and a nutrition-focused physical examination are key components of a comprehensive nutrition assessment.
A nutrition-focused medical, surgical, and dietary history and a nutrition-focused physical examination are key components of a comprehensive nutrition assessment.
![]() Appropriate evaluation of anthropometric measurements (e.g., weight, height) is essential in nutrition assessment and should be based on published standards.
Appropriate evaluation of anthropometric measurements (e.g., weight, height) is essential in nutrition assessment and should be based on published standards.
![]() Laboratory assessment of visceral proteins is essential for a comprehensive nutrition assessment and must be interpreted in the context of physical findings, medical and surgical history, and the patient’s clinical status.
Laboratory assessment of visceral proteins is essential for a comprehensive nutrition assessment and must be interpreted in the context of physical findings, medical and surgical history, and the patient’s clinical status.
![]() The presence of micronutrient or macronutrient deficiencies or risk factors for these deficiencies can be identified by a comprehensive nutrition assessment.
The presence of micronutrient or macronutrient deficiencies or risk factors for these deficiencies can be identified by a comprehensive nutrition assessment.
![]() Patient-specific goals should be established using evidence-based criteria considering the patient’s clinical condition and the need for maintenance or repletion in adults or continued growth and development in children.
Patient-specific goals should be established using evidence-based criteria considering the patient’s clinical condition and the need for maintenance or repletion in adults or continued growth and development in children.
![]() Indirect calorimetry is the most accurate method to determine energy requirements, but because of cost and availability, validated predictive equations are most often used to determine energy requirements.
Indirect calorimetry is the most accurate method to determine energy requirements, but because of cost and availability, validated predictive equations are most often used to determine energy requirements.
![]() Drug–nutrient interactions can affect nutrition status and the response to and adverse effects seen with drug therapy and must be considered when developing or assessing a patient’s nutrition care plan.
Drug–nutrient interactions can affect nutrition status and the response to and adverse effects seen with drug therapy and must be considered when developing or assessing a patient’s nutrition care plan.
INTRODUCTION
Nutrition is a vital component of quality patient care. No single clinical or laboratory parameter is an absolute indicator of nutrition status, so data from a number of areas must be analyzed. This chapter reviews the tools most commonly used for accurate, relevant, and cost-effective nutrition screening and assessment. The various methods used to determine patient-specific macro-and micronutrient requirements and potential drug–nutrient interactions are also discussed.
CLASSIFICATION OF NUTRITION DISEASE
![]() Malnutrition is a consequence of nutrient imbalance. In general, deficiency states can be categorized as those involving protein and calories or single nutrients such as individual vitamins or trace elements. Starvation-associated malnutrition, marasmus, results from prolonged inadequate intake, absorption, or utilization of protein and energy. It occurs in patients with an inadequate food supply, anorexia nervosa, major depression, and malabsorption syndromes. Somatic protein (skeletal muscle) and adipose tissue (subcutaneous fat) wasting occurs, but visceral protein (e.g., albumin [ALB] and transferrin [TFN]) production is usually preserved. Weight loss may exceed 10% of usual body weight (UBW; typical weight). With severe marasmus, cell-mediated immunity and muscle function are impaired. Patients with marasmus commonly have a prototypical starved, wasted appearance.1,2 Kwashiorkor is a specific form of starvation-associated malnutrition that develops when there is inadequate protein intake and usually develops in areas where there is famine, limited food supply, or low educational levels. Although rarely reported in the United States, children who are abused or neglected and elderly individuals can develop this condition. Often patients with kwashiorkor do not appear malnourished because of relative adipose tissue sparing, especially with mild undernutrition, but visceral (and to some degree somatic) protein stores are depleted, resulting in severe hypoalbuminemia and edema in more advanced cases. In patients with marasmus or kwashiorkor, enhancing nutritional intake or bypassing impaired absorption with specialized nutrition support can reverse the malnutrition.1,2
Malnutrition is a consequence of nutrient imbalance. In general, deficiency states can be categorized as those involving protein and calories or single nutrients such as individual vitamins or trace elements. Starvation-associated malnutrition, marasmus, results from prolonged inadequate intake, absorption, or utilization of protein and energy. It occurs in patients with an inadequate food supply, anorexia nervosa, major depression, and malabsorption syndromes. Somatic protein (skeletal muscle) and adipose tissue (subcutaneous fat) wasting occurs, but visceral protein (e.g., albumin [ALB] and transferrin [TFN]) production is usually preserved. Weight loss may exceed 10% of usual body weight (UBW; typical weight). With severe marasmus, cell-mediated immunity and muscle function are impaired. Patients with marasmus commonly have a prototypical starved, wasted appearance.1,2 Kwashiorkor is a specific form of starvation-associated malnutrition that develops when there is inadequate protein intake and usually develops in areas where there is famine, limited food supply, or low educational levels. Although rarely reported in the United States, children who are abused or neglected and elderly individuals can develop this condition. Often patients with kwashiorkor do not appear malnourished because of relative adipose tissue sparing, especially with mild undernutrition, but visceral (and to some degree somatic) protein stores are depleted, resulting in severe hypoalbuminemia and edema in more advanced cases. In patients with marasmus or kwashiorkor, enhancing nutritional intake or bypassing impaired absorption with specialized nutrition support can reverse the malnutrition.1,2
Malnutrition can also result from chronic mild-to-moderate inflammation when there is heightened cellular substrate demand or use, such as in patients with chronic inflammatory diseases, organ failure, or cancer. In patients with severe acute disease or injury (e.g., major infections, burns, trauma, traumatic brain injury), malnutrition can develop because of increased metabolic demands. Individuals with mild-to-moderate marasmus or kwashiorkor can develop marked malnutrition when severe injury or inflammation occurs. In patients with inflammation or injury-associated malnutrition, simply providing nutrients in usual or even increased amounts may not be sufficient to reverse the nutrient imbalance caused by hypermetabolism. Regardless of the cause, undernutrition can result in changes in subcellular, cellular, or organ function that increase the individual’s risks of morbidity and mortality.
Obesity (overnutrition) is a major healthcare concern worldwide. In 2009 to 2010, approximately 69% of American adults were overweight (defined as a body mass index [BMI] ≥25 kg/m2), and about 36% (78 million) were obese (BMI ≥30 kg/m2).3 In 2010, obesity prevalence ranged from 21% in Colorado to 34% in Mississippi.4 Additionally, 17% (12.5 million) of all U.S. children and adolescents (age 2–19 years) were obese (BMI ≥95th percentile for age on the gender-appropriate BMI-for-age Centers for Disease Control and Prevention’s [CDC’s] 2000 growth chart).5,6 Many more children (∼32%) were overweight (BMI ≥85th percentile for age).5 Although the Healthy People 2010 goals of 15% obesity in adults and 5% obesity in children7 were not met, there was no change in obesity prevalence among U.S. adults or children in 2009 to 2010 compared with 2003 to 20083 or 2007 to 2008,5 respectively. This leveling trend is encouraging after a steady increase in prevalence since 1999. Nutrition assessment allows identification of overweight and obese individuals and those at risk of becoming obese. The consequences of obesity are numerous and include type 2 diabetes mellitus, cardiovascular disease, and stroke.
Poor nutritional status is associated with higher morbidity and mortality in many settings. An effective nutrition screening program will identify patients at nutrition-related risk. Clinicians trained to perform a comprehensive nutrition assessment will accurately characterize the at-risk patient’s baseline nutrition status, allowing an appropriate estimate of an individual’s nutrition needs and development of a patient-specific nutrition care plan. Diligent monitoring of ongoing nutrition status will ensure that nutrition-related goals are being met and patient outcomes are improved.
NUTRITION SCREENING
![]() Nutrition screening is distinct from nutrition assessment.8,9 It is neither practical nor warranted to conduct a comprehensive nutrition assessment on every individual; thus, nutrition screening protocols are useful to provide a reliable, systematic method to identify persons for whom a detailed nutrition assessment is needed. A nutrition screen can be used to detect those who are overweight, obese, malnourished, or at risk for malnutrition; predict the probability of their outcome as a result of nutritional factors; and identify those who would benefit from nutritional treatment. Ideally, potential nutrition-related issues can be identified and addressed before complications develop.
Nutrition screening is distinct from nutrition assessment.8,9 It is neither practical nor warranted to conduct a comprehensive nutrition assessment on every individual; thus, nutrition screening protocols are useful to provide a reliable, systematic method to identify persons for whom a detailed nutrition assessment is needed. A nutrition screen can be used to detect those who are overweight, obese, malnourished, or at risk for malnutrition; predict the probability of their outcome as a result of nutritional factors; and identify those who would benefit from nutritional treatment. Ideally, potential nutrition-related issues can be identified and addressed before complications develop.
The ideal nutrition screen is quick, simple, and noninvasive and can be done by lay and healthcare providers in many settings, including homes, long-term care facilities, ambulatory care clinics, and hospitals. The Joint Commission includes nutrition screening and assessment in its performance standards for accredited healthcare institutions.10 Each entity must have a written process by which a nutrition screen is done and criteria that determine when a more in-depth assessment will be performed. In hospitals, a nutrition screen must be completed within 24 hours of admission. A comprehensive nutrition assessment, if needed, should be completed within 48 to 72 hours. For outpatients, nutrition screening should occur ideally at the first visit with a new provider and thereafter as warranted by the patient’s condition. Nutrition screening is a cost-effective way to decrease complications and length of hospital stay.
Appropriate screening is based on risk factor identification. Risk factors for undernutrition include recent weight loss, presence of chronic disease states, disease severity, complicating conditions, treatments, and socioeconomic factors that may result in a decreased nutrient intake or altered nutrient metabolism, utilization, or malabsorption. Risk factors for obesity include BMI, family history of obesity, certain medical diagnoses, poor dietary habits, lack of exercise, and some drug therapies. Various rating and classification systems have been proposed to screen for nutrition risk and guide subsequent interventions.8,11–14 Checklists are used to quantify a person’s food and alcohol consumption habits; ability to buy, prepare, and eat food; weight history; diagnoses; and medical and surgical procedures. Nutrition screens for children most often evaluate growth parameters against the CDC or World Health Organization (WHO) growth charts6,15 and medical conditions known to increase nutrition risk. Screening programs should also identify patients receiving specialized nutrition support (enteral or parenteral nutrition). In any setting, patients determined to be “at nutrition risk” should receive a timely comprehensive nutrition assessment by a trained nutrition professional to verify nutrition-related risk and to formulate a nutrition care plan.
ASSESSMENT OF NUTRITION STATUS
![]() A comprehensive nutrition assessment is the first step in formulating a patient-specific nutrition care plan. Nutrition assessment has four major goals: (a) identification of the presence of factors associated with an increased risk of developing malnutrition, including disorders resulting from macro- or micronutrient deficiencies (undernutrition), obesity (overnutrition), or impaired nutrient metabolism or utilization; (b) determination of the risk of malnutrition-associated complications; (c) estimation of nutrition needs; and (d) establishment of baseline nutrition status with parameters against which to measure nutrition therapy outcomes. Nutrition assessment should include a nutrition-focused medical, surgical, and dietary history; a nutrition-focused physical examination, including anthropometrics; and laboratory measurements. A comprehensive nutrition assessment provides a basis for determining the patient’s nutrition requirements and the optimal type and timing of nutrition intervention.
A comprehensive nutrition assessment is the first step in formulating a patient-specific nutrition care plan. Nutrition assessment has four major goals: (a) identification of the presence of factors associated with an increased risk of developing malnutrition, including disorders resulting from macro- or micronutrient deficiencies (undernutrition), obesity (overnutrition), or impaired nutrient metabolism or utilization; (b) determination of the risk of malnutrition-associated complications; (c) estimation of nutrition needs; and (d) establishment of baseline nutrition status with parameters against which to measure nutrition therapy outcomes. Nutrition assessment should include a nutrition-focused medical, surgical, and dietary history; a nutrition-focused physical examination, including anthropometrics; and laboratory measurements. A comprehensive nutrition assessment provides a basis for determining the patient’s nutrition requirements and the optimal type and timing of nutrition intervention.
Nutrition-Focused History and Physical Examination
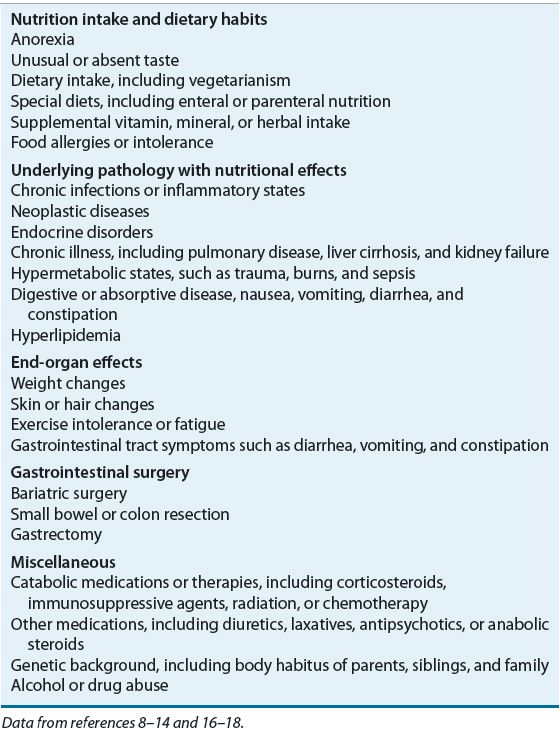
![]() The nutrition-focused medical, surgical, and dietary history provides information regarding factors that predispose to malnutrition (e.g., prematurity, chronic diseases, gastrointestinal [GI] dysfunction, alcohol abuse, acute or chronic inflammation, cancer, surgery, trauma), and overnutrition (e.g., poor dietary habits, limited exercise, chronic diseases, family history). The clinician should direct the interview to elicit any history of weight gain or loss, anorexia, vomiting, diarrhea, and decreased or unusual food intake (Table 118-1).
The nutrition-focused medical, surgical, and dietary history provides information regarding factors that predispose to malnutrition (e.g., prematurity, chronic diseases, gastrointestinal [GI] dysfunction, alcohol abuse, acute or chronic inflammation, cancer, surgery, trauma), and overnutrition (e.g., poor dietary habits, limited exercise, chronic diseases, family history). The clinician should direct the interview to elicit any history of weight gain or loss, anorexia, vomiting, diarrhea, and decreased or unusual food intake (Table 118-1).
TABLE 118-1 Pertinent Data from a Nutrition-Focused Medical, Surgical, and Dietary History
The nutrition-focused physical examination takes a systems approach to assess lean body mass (LBM) and findings of deficiencies or excesses of vitamins, trace elements, or essential fatty acids. The degree of muscle wasting, edema, or loss of subcutaneous fat, if present, should be documented. The presence of findings suggestive of malnutrition (e.g., dermatitis, glossitis, cheilosis, jaundice) should be noted. Additionally, nonspecific indicators of ongoing inflammation or stress (e.g., fever, tachycardia) should be noted because these are important findings (Table 118-2).
TABLE 118-2 Physical Examination Findings Suggestive of Malnutrition
The Subjective Global Assessment, a simple, reproducible, cost-effective, bedside approach to nutrition assessment, has been used in a variety of patient populations.2,12,16,17 Five aspects of the medical and dietary history comprise the Subjective Global Assessment: weight changes in the previous 6 months, dietary changes, GI symptoms, functional capacity, and the presence of disease states known to affect nutrition status. Weight loss of less than 5% of UBW is considered a “small” loss, 5% to 10% loss is “potentially significant,” and more than a 10% loss is “definitely significant.” Dietary intake is characterized as normal or abnormal, and the duration and degree of abnormal intake are noted. The presence of daily GI symptoms (e.g., anorexia, nausea, vomiting, diarrhea) for longer than 2 weeks is significant. Functional capacity assesses the patient’s energy level and whether the patient is active or bedridden. Finally, disease states are assessed as to their impact on metabolic demands (i.e., no, low, moderate, or high stress). Four physical examination findings are rated as normal, mild, moderate, or severe: loss of subcutaneous fat (triceps and chest), muscle wasting (quadriceps and deltoids), edema (ankle and sacral), and ascites. The patient’s nutrition status is then rated as adequately nourished, moderately malnourished or suspected of being malnourished, or severely malnourished. Critics of the Subjective Global Assessment find it time-consuming and complex.2 Another tool, the Mini Nutritional Assessment, has been used extensively in geriatric patients and found to be useful for elderly living in the community, subacute care facilities, and nursing homes.2,18
Anthropometric Measurements
![]() Anthropometric measurements, which are physical measurements of the size, weight, and proportions of the human body, are also used to assess nutrition status. Common measurements are weight, stature (standing height or recumbent length depending on age), head circumference (for children younger than 3 years of age), and waist circumference. Measurements of limb size, such as skinfold thickness, midarm muscle circumference, and wrist circumference, may be useful in selected individuals. Bioelectrical impedance analysis (BIA) is also an anthropometric assessment tool. An individual’s body measurements can be compared with normative population standards or repeated at various intervals to monitor response to a nutrition care plan. In adults, nutrition-related changes in anthropometric measurements occur slowly; several weeks or more are usually required before detectable changes are noted. In infants and young children, changes may occur more quickly. Acute changes in weight and skinfold thickness usually reflect changes in hydration, which must be considered when interpreting these parameters, particularly in hospitalized patients.
Anthropometric measurements, which are physical measurements of the size, weight, and proportions of the human body, are also used to assess nutrition status. Common measurements are weight, stature (standing height or recumbent length depending on age), head circumference (for children younger than 3 years of age), and waist circumference. Measurements of limb size, such as skinfold thickness, midarm muscle circumference, and wrist circumference, may be useful in selected individuals. Bioelectrical impedance analysis (BIA) is also an anthropometric assessment tool. An individual’s body measurements can be compared with normative population standards or repeated at various intervals to monitor response to a nutrition care plan. In adults, nutrition-related changes in anthropometric measurements occur slowly; several weeks or more are usually required before detectable changes are noted. In infants and young children, changes may occur more quickly. Acute changes in weight and skinfold thickness usually reflect changes in hydration, which must be considered when interpreting these parameters, particularly in hospitalized patients.
Weight, Stature, and Head Circumference
Body weight is a nonspecific measure of body cell mass, representing skeletal mass, body fat, and the energy-using component (i.e., LBM). Change in weight over time, particularly in the absence of edema, ascites, or voluntary losses, is an important indicator of altered LBM. Actual body weight (ABW) interpretation should include consideration of ideal weight for height, referred to as ideal body weight (IBW), UBW, fluid status, and age (Table 118-3). The UBW describes an individual’s typical weight. Dehydration will result in decreased ABW but not a loss in LBM. After the patient is rehydrated, rechecking the weight is important to establish a baseline to use for nutrition evaluation. Edema and ascites increase total body water (TBW), thereby increasing ABW. Thus, the ABW of patients with severe edema and ascites should not be used for nutrition assessment; practitioners often use a “dry weight” to account for this increase in TBW. Both acute and chronic changes in fluid status can affect the ABW; these changes often can be detected by monitoring the patient’s daily fluid intake and output. Accurate weight measurement can be difficult in critically ill patients because of their clinical condition and stress-related water retention.
TABLE 118-3 Evaluation of Body Weight

The IBW provides one population reference standard against which the ABW can be compared to detect both over- and undernutrition states. Numerous IBW-for-height reference tables have been generated. In clinical practice, mathematical equations based on gender and height (e.g., Hamwi method) are used commonly. IBW is calculated as 48 kg + (2.7 × [inches over 5 feet]) or 48 kg + (1.06 × [cm over 152 cm]) for adult men and for adult women as 45 kg + (2.3 × [inches over 5 feet]) or 45 kg + (0.906 × [cm over 152 cm]). For both equations, a range of ± 4.5 kg for large or small frame size is used for interpretation purposes. For obese adults, use of an adjusted ABW has been recommended for nutrition-related calculations, where adjusted ABW = ([ABW – IBW] × 0.25) + IBW. However, the use of this adjusted ABW is not evidence-based because most of the metabolic rate equations were developed with a mix of obese and nonobese individuals, and ABW was used to formulate the equations.19 The IBW of a child can be calculated as ([height in cm]2 × 1.65)/1,000. Alternatively, IBW for height can be determined by identifying the body weight corresponding to the same growth channel as the child’s measured stature on the appropriate CDC or WHO growth chart. Comparison with the 50th percentile weight-for-age has been suggested but can be misleading if the child’s height is not also at the 50th percentile.
Change in weight over time can be calculated as the percentage of UBW, where percent UBW = (ABW/UBW) × 100 (Table 118-3). Use of UBW as a reference point provides a more accurate reflection of clinically significant weight changes over time. However, determining UBW depends on patient or family recall, which may be inaccurate. The use of UBW avoids the problems associated with normative tables and documents comparative changes in body weight. Weight changes should be interpreted relative to time. Unintentional weight loss, especially rapid weight loss (i.e., 5% of UBW in 1 month or 10% of UBW in 6 months), increases the risk of poor clinical outcomes.12
Stature is determined by both genetics and nutrition. In infants, recumbent length is measured; in older children and adults, a standing height is preferred. If a standing height cannot be measured, the measurement of demispan can be used to estimate height. Demispan is determined in a seated patient by measuring the distance from the sternal notch to the web between the middle and ring fingers along a horizontally outstretched arm with the wrist in neutral rotation and zero extension or flexion. Demispan may more accurately assess stature in elderly adults, especially those with kyphosis or vertebral collapse. After the demispan is measured, height is estimated using the following equations: women: height (cm) = 1.35 × demispan (cm) + 60.1; men: height (cm) = 1.4 × demispan (cm) + 57.8.20 Knee height may also be used to estimate stature and is especially helpful in patients with limb contractures, such as patients with cerebral palsy.20–23 Knee height is measured from just under the heel to the anterior surface of the thigh just proximal to the patella. Using the average of two measurements rounded to the nearest 0.1 cm, height can be estimated using the following equations: women: height (cm) = 84.88 (0.24 × age [years]) + (1.83 × knee height [cm]); men: height (cm) = 64.19 (0.04 × age [years]) + (2.02 × knee height [cm]).23
The best indicator of adequate nutrition in a child is appropriate growth. At each medical encounter, weight, stature, head circumference (until 3 years), and BMI (after 2 years) should be plotted on the WHO (younger than 2 years) or CDC gender- and age-specific growth curves. Specialized charts are available for assessment of short- and long-term growth of premature infants,24,25 children with Down’s syndrome,26 and children with other specific conditions. For premature infants with corrected postnatal age of 40 weeks or more, the WHO growth charts can be used; however, weight-for-age and length-for-age should be plotted according to corrected postnatal age until 2 years and 3.5 years of age, respectively.
Recommended intervals between measurements in young children are weight, 7 days; length, 4 weeks; height, 8 weeks; and head circumference, 7 days in infants and 4 weeks in children until 3 years of age. Growth velocity can be used to assess growth at intervals too close to plot accurately on a growth chart (Table 118-4). In newborns, average weight gain is 10 to 20 g/kg/day (24–35 g/day in term infants and 10–25 g/day in preterm infants). The rate of weight gain declines considerably after 3 months of age. Head growth (measured by head circumference), usually 0.5 cm/week (0.2 inches/week) during the first year of life, can be compromised during periods of critical illness or malnutrition. Rapid head growth, especially at a rate faster than expected, suggests hydrocephalus and should be further evaluated.
TABLE 118-4 Expected Growth Velocities in Term Infants and Children
Failure to thrive (growth failure) is defined as weight-for-age or weight-for-height (or length) below the 5th percentile or a falloff of two or more major percentiles (major percentiles are defined as 97th, 95th, 90th, 75th, 50th, 25th, 10th, 5th, and 3rd). Weight-for-height evaluation is age independent and helps differentiate a stunted child (chronic malnutrition) from a wasted child (acute malnutrition). Short stature, which can be associated with chronic disease, is a manifestation of chronic undernutrition. Short stature in the absence of poor weight gain suggests another etiology, such as growth hormone deficiency or constitutional growth delay.
Body Mass Index
Body mass index can be calculated as either body weight in kilograms divided by the patient’s height in meters squared (kg/m2) or body weight in pounds multiplied by 703 divided by the patient’s height in inches squared (lb/in2). A BMI of 25 kg/m2 or higher is considered a risk factor for premature death and disability. Health risks increase as the BMI increases. Although BMI correlates strongly with total body fat, individual variation, especially in very muscular persons, may lead to erroneous classification of nutrition status. BMI should be interpreted based on characteristics such as gender, frame size, and age. For example, at the same BMI, a woman tends to have more body fat than a man, and an older adult would have more body fat than a younger one.
In general, a BMI between 18.5 and 24.9 kg/m2 is indicative of a healthy weight, between 25 kg/m2 and 29.9 kg/m2 signifies being overweight, and 30 kg/m2 or higher indicates obesity (Table 118-3).12,27 These BMI classifications may not be appropriate for older subjects, especially those older than 60 years, where a BMI between 27 kg/m2 and 30 kg/m2 has not been associated with the same increased nutrition-related risks seen in younger individuals.28 BMI has also been used to assess undernutrition (<18.5 kg/m2 indicates undernutrition), but this relationship is not as well established.12 Children 2 years of age and older are considered overweight if their BMI is at or above the 85th percentile on the age- and gender-specific CDC BMI chart and obese if the BMI is at or above the 95th percentile.6 Use of these charts at each medical encounter helps to heighten awareness of children whose BMI and family history put them at risk for adult obesity and its associated complications.
Clinical Controversy…
Skinfold Thickness and Mid-Arm Muscle Circumference
More than 50% of the body’s fat is subcutaneous; thus, changes in subcutaneous fat reflect changes in total body fat. Whereas skinfold thickness measurement provides an estimate of subcutaneous fat, mid-arm muscle circumference, which is calculated using the skinfold thickness and mid-arm circumference, estimates skeletal muscle mass. Although simple and noninvasive, these anthropometric measurements are not used commonly in clinical practice but can be used for both population analysis and long-term monitoring of individuals. Triceps skinfold thickness is used most commonly, but reference standards also exist for subscapular and iliac sites. Careful technique in the use of pressure-regulated calipers is essential for reproducibility and reliability in measuring triceps skinfold thickness. Results should be interpreted cautiously because standards do not account for variation in bone size, muscle mass, hydration, or skin compressibility, and they do not consider obesity, ethnicity, illness, and increased age. Furthermore, these parameters change slowly in adults, often requiring weeks before significant alterations from baseline can be detected.
Waist Circumference
Waist circumference is a simple measurement used to assess abdominal (visceral) fat. Excess abdominal fat, rather than excess peripheral (subcutaneous) fat, is an independent predictor of obesity-related complications, especially diabetes mellitus and cardiovascular disease.29,30 Waist circumference is determined by measuring the distance around the smallest area below the rib cage and the top of the iliac crest. Men are at increased risk (beyond the BMI-related risk) if the waist circumference is greater than 40 inches (102 cm); women are at increased risk if the waist circumference is greater than 35 inches (89 cm); and children are at risk if the waist circumference is at the 75th percentile or greater (16–17-year-old girls) or 90th percentile (all others) according to age- and gender-specific standards.31
Waist-to-Hip and Waist-to-Height Ratios
Extra weight around the waist confers a greater health risk than extra weight around the hips and thighs. The waist-to-hip ratio is determined by dividing the waist circumference by the hip circumference (maximal posterior extension of the buttocks). In adults, a waist-to-hip ratio of greater than 0.9 in men and 0.85 in women is considered an independent risk factor for adverse health consequences.29 Waist-to-height ratio (both measured in centimeters) has been used to evaluate children at risk for the metabolic syndrome because, unlike waist circumference, it is independent of age and gender. A child with a waist-to-height ratio of more than 0.5 is at risk for developing the metabolic syndrome.32
Bioelectrical Impedance
Bioelectrical impedance is a simple, noninvasive, portable, and relatively inexpensive technique used to measure body composition.33,34 The technology is based on the fact that lean tissue has a higher electrical conductivity (less resistance) than fat, which is a poor current conductor because of its lower water and electrolyte content. When a small electric current is applied to two appendages (wrist and ankle or both feet), impedance (resistance) to flow is measured. Assessment of LBM, TBW, and water distribution can be determined with BIA. Increased TBW decreases impedance; thus, it is important to evaluate hydration along with BIA. Other potential limitations of BIA include variability with electrolyte imbalance and interference by large fat masses, environment, ethnicity, menstrual cycle phase, and underlying medical conditions. Although BIA equations have high validity when used in the population in which they were developed (mostly young healthy adults), BIA calculations are subject to considerable errors if applied to other populations. Although BIA measures body fat accurately in controlled trials, accuracy in clinical practice is inconsistent. The lack of reference standards that reflect variations in individual body size and clinical condition also limits BIA use in clinical practice. BIA is not superior to BMI as a predictor of overall adiposity in the general population and is currently used primarily as a research tool.
OTHER NUTRITION ASSESSMENT TOOLS
Diminished skeletal muscle function can be a useful indicator of malnutrition because muscle function is an end-organ response. Muscle function also recovers more rapidly in response to initiation of nutrition support than anthropometric measurements. Hand-grip strength (forearm muscle dynamometry), respiratory muscle strength, and muscle response to electrical stimulation have been used. Measuring hand-grip strength is a relatively simple, noninvasive, and inexpensive procedure that correlates with patient outcome.35–37 Normative standards supplied by the manufacturer of the measuring device can be used to establish the presence of a deficiency state. Ulnar nerve stimulation causes measurable muscle contraction and is used in most intensive care units to monitor neuromuscular blockade. In malnourished patients, increased fatigue and a slowed muscle relaxation rate are noted; these indices return to normal with refeeding.
A number of methods have been used to determine body composition in the research setting, including bioimpedance spectroscopy, dual energy x-ray absorptiometry (DXA), quantitative CT, air displacement plethysmography, three-dimensional photonic scanning, MRI, quantitative MRI, and positron emission tomography.38,39 These methods are generally complex and require expensive technology. DXA, best known for its use in measuring bone density in patients with osteoporosis, is one of the most promising methods for routine clinical practice. It can be used to quantify the mineral, fat, and LBM compartments of the body and is available in most hospitals and many outpatient facilities. Equipment for a central DXA scan requires a fair amount of space, and the cost depends on the complexity of the scanner. Portable (or peripheral) DXA devices that use ultrasound and infrared interactance can be used to measure bone density in peripheral bones, such as the wrist, fingers, or heel, and have also been used to assess subcutaneous fat. These portable DXA scanners are much less expensive and can be used in community screenings in malls, health fairs, and pharmacies. Further research is needed to determine if DXA will be useful clinically in nutrition assessment. MRI and CT can measure subcutaneous, intraabdominal, and regional fat distribution and thus have the potential to be useful clinical tools.
Laboratory Assessment
![]() Biochemically, LBM can be assessed by measuring the serum visceral proteins, albumin (ALB), transferrin (TFN), and prealbumin (also known as transthyretin). C-reactive protein (CRP) is useful as a marker of inflammation. Creatinine-height index has historically been calculated to assess LBM but is seldom done today because of the lack of evidence to support its usefulness.
Biochemically, LBM can be assessed by measuring the serum visceral proteins, albumin (ALB), transferrin (TFN), and prealbumin (also known as transthyretin). C-reactive protein (CRP) is useful as a marker of inflammation. Creatinine-height index has historically been calculated to assess LBM but is seldom done today because of the lack of evidence to support its usefulness.
Visceral Proteins
Measurement of serum proteins synthesized by the liver can be used to assess the visceral protein compartment. It is assumed that in undernutrition states, a low serum protein concentration reflects diminished hepatic protein synthetic mass and indirectly reflects the functional protein mass of other organs (heart, lung, kidney, intestines). Visceral proteins with the greatest relevance for nutrition assessment are serum ALB, TFN, and prealbumin. Many factors other than nutrition affect the serum concentration of these proteins, including age, abnormal kidney (nephrotic syndrome), GI tract (protein-losing enteropathy) or skin (burns) losses, hydration (dehydration results in hemoconcentration, overhydration in hemodilution), liver function (the synthetic site), and metabolic stress and inflammation (e.g., sepsis, trauma, surgery, infection). Assessing visceral proteins is of greatest value in the presence of uncomplicated semi-starvation and recovery. Thus, visceral protein concentrations must be interpreted relative to the individual’s overall clinical condition (Table 118-5). During severe acute stress (trauma, burns, sepsis), these proteins are relatively poor markers of nutrition status because of increased vascular permeability with dramatic fluid shifts and reprioritizing of liver protein synthesis increasing the production of acute-phase reactants such as CRP, ferritin, fibrinogen, and haptoglobin.40 CRP can be used in these cases to assess the degree of inflammation present: if CRP is elevated and ALB and prealbumin are decreased, then inflammation is a likely contributing factor. Assessing trends is most useful in these cases.
TABLE 118-5 Visceral Proteins Used for Assessment of Lean Body Mass
Albumin is the most abundant plasma protein and is involved in maintenance of colloid oncotic pressure and binding and transport of numerous hormones, anions, drugs, and fatty acids. It is widely used as a marker of chronic malnutrition. It is, however, a relatively insensitive index of early protein malnutrition because there is a large amount normally in the body (4–5 g/kg of body weight), it is extensively distributed in the extravascular compartment (60%), and it has a long half-life (18–20 days). However, chronic protein deficiency in the setting of adequate nonprotein calorie intake leads to marked hypoalbuminemia because of a net ALB loss from the intravascular and extravascular compartments. Serum ALB concentrations also are affected by moderate-to-severe calorie deficiency and liver, kidney, and GI disease. ALB is an acute-phase reactant, and serum concentrations decrease with inflammation, infection, trauma, stress, and burns. Decreased serum ALB concentrations are associated with poorer clinical outcomes in most of the above-mentioned settings. Additionally, serum ALB concentrations less than 2.5 g/dL (25 g/L) can be expected to exacerbate ascites and peripheral, pulmonary, and GI mucosal edema as a result of decreased colloid oncotic pressure. Hypoalbuminemia will also affect the interpretation of serum calcium concentrations as well as serum concentrations of highly protein bound drugs (e.g., phenytoin, valproic acid).
Transferrin is a glycoprotein that binds and transports ferric iron to the liver and reticuloendothelial system for storage. Because it has a shorter half-life (8–9 days) and there is less of it in the body (<100 mg/kg of body weight), TFN will decrease in response to protein and energy depletion before the serum ALB concentration decreases. Serum TFN concentrations are commonly measured directly. In rare situations when a direct measure is not available, TFN concentration can be estimated indirectly from measurement of total iron-binding capacity (in mcg/dL), where TFN (in mg/dL) = (total iron-binding capacity × 0.8) – 43. TFN is also an acute-phase reactant, and its concentration is increased in the presence of critical illness. Iron stores also affect serum TFN concentrations: in iron deficiency, hepatic TFN synthesis is increased, resulting in increased serum TFN concentrations irrespective of the patient’s nutrition status.
Prealbumin (transthyretin) is the transport protein for thyroxine and a carrier for retinol-binding protein. Prealbumin stores are low (10 mg/kg of body weight), and it has a very short half-life (2–3 days). The serum prealbumin concentration may be reduced after only a few days of a significant reduction in calorie and protein intake or in patients with severe metabolic stress (e.g., trauma, burns). It is most useful in monitoring the short-term, acute effects of nutrition support or deficits, as it responds very quickly in both situations. As with ALB and TFN, prealbumin synthesis is decreased in liver disease. Increased prealbumin concentrations may be seen in patients with kidney disease because of impaired excretion.
Immune Function Tests
Nutrition status affects immune function either directly, via actions on the lymphoid system, or indirectly by altering cellular metabolism or organs that are involved with immune system regulation. Immune function tests most often used in nutrition assessment are the total lymphocyte count and delayed cutaneous hypersensitivity (DCH) reactions. Both tests are simple, readily available, and inexpensive.
Total lymphocyte count reflects the number of circulating T and B lymphocytes. Tissues that generate T cells are very sensitive to malnutrition, undergoing involution resulting in decreased T-cell production and eventually lymphocytopenia. A total lymphocyte count less than 1,500 cells/mm3 (<1.5 × 10⁹ cells/L) has been associated with nutrition depletion.2 DCH is commonly assessed using recall antigens to which the patient was likely previously sensitized, such as mumps and Candida albicans. Anergy is associated with severe malnutrition, and response is restored with nutrition repletion. Other immune function tests used in nutrition-related research include lymphocyte surface antigens (CD4, CD8, and the CD4:CD8 ratio), T-lymphocyte responsiveness, and various serum interleukin concentrations.
Total lymphocyte count is reduced in the presence of infection (e.g., human immunodeficiency virus [HIV], other viruses, tuberculosis), immunosuppressive drugs (e.g., corticosteroids, cyclosporine, tacrolimus, sirolimus, chemotherapy, antilymphocyte globulin), leukemia, and lymphoma. A number of factors affect DCH, including fever, viral illness, recent live virus vaccination, critical illness, irradiation, immunosuppressive drugs, diabetes mellitus, HIV, cancer, and surgery. Thus, a lack of specificity limits the usefulness of these tests as nutrition status markers. Nutrients such as arginine, omega-3 fatty acids, and nucleic acids given in pharmacologic doses may improve immune function. Monitoring efficacy of a nutrition care plan that includes these potentially immune-modulating nutrients may include immune function assessment with these or other immune function indicators.41,42
Specific Nutrient Deficiencies and Toxicities
![]() A comprehensive nutrition assessment should include an evaluation for possible trace element, vitamin, and essential fatty acid deficiencies. Because of their key role in metabolic processes (as coenzymes and cofactors), a deficiency of any of these nutrients may result in altered metabolism and cell dysfunction. An accurate history to identify symptoms and risk factors for a specific nutrient deficiency is critical. A nutrition-focused physical examination for signs of deficiencies and biochemical assessment to confirm a suspected deficiency should be done in all at-risk patients. Ideally, biochemical assessment would be based on the nutrient’s function (e.g., metalloenzyme activity) rather than simply measuring the serum concentration. Unfortunately, few practical methods to assess micronutrient function are available; thus, the nutrient’s serum concentration is most often measured.
A comprehensive nutrition assessment should include an evaluation for possible trace element, vitamin, and essential fatty acid deficiencies. Because of their key role in metabolic processes (as coenzymes and cofactors), a deficiency of any of these nutrients may result in altered metabolism and cell dysfunction. An accurate history to identify symptoms and risk factors for a specific nutrient deficiency is critical. A nutrition-focused physical examination for signs of deficiencies and biochemical assessment to confirm a suspected deficiency should be done in all at-risk patients. Ideally, biochemical assessment would be based on the nutrient’s function (e.g., metalloenzyme activity) rather than simply measuring the serum concentration. Unfortunately, few practical methods to assess micronutrient function are available; thus, the nutrient’s serum concentration is most often measured.
Trace Elements
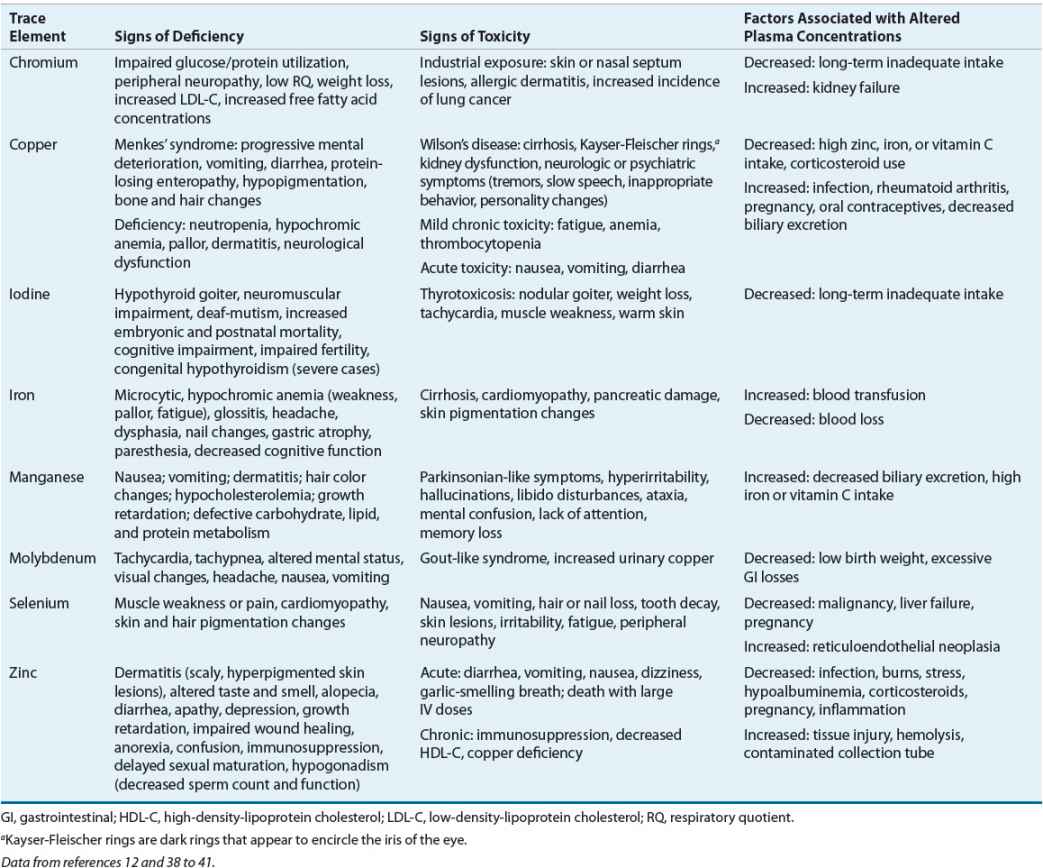
Clinical syndromes are associated with a deficiency of the essential trace elements zinc, copper, manganese, selenium, chromium, iodine, fluoride, molybdenum, and iron in children and adults.43–46 A deficiency state has not been recognized for tin, nickel, vanadium, cobalt, gallium, aluminum, arsenic, boron, bromine, cadmium, germanium, or silicon. Each trace element is involved in a variety of biologic functions and is necessary for normal metabolism, serving as a coenzyme or playing a role in hormonal metabolism or erythropoiesis. Toxicities can occur with excess intake of some trace elements. With the current public interest in complementary medicine, clinicians must ask patients about their use of dietary supplements and assess for signs and symptoms of toxicities as well as deficiencies (Table 118-6).
TABLE 118-6 Assessment of Trace Element Status