Natural history of disease and levels of prevention
Traditionally, epidemiology was mainly concerned with epidemics of communicable disease. Nowadays contemporary epidemiology has been extended to include non-communicable and chronic diseases, injuries, maternal and child health, environmental and occupational health, mental health and even a broad range of factors including social, economic, cultural, genetic, behavioural or lifestyle factors which contribute to the health and wellbeing of a population. Most importantly, epidemiology acknowledges the multi-causal nature of disease/health issues and the fact that a disease is due to a complex interactive effect among the above-mentioned factors. A health promotion or prevention program (primary prevention; see Figure 10.1) addressing these ‘upstream’ factors is considered to be cost-effective to protect an individual from developing diseases (Webb & Bain, 2011).
Descriptive and analytic studies
‘The distribution and determinants of health-related status or events’ in the definition of epidemiology refers to descriptive and analytic studies in epidemiology (Porta, 2008, p. 65). The details of these two broad categories of epidemiological study are discussed in later sections of this chapter. In descriptive epidemiology, researchers are interested in frequency and patterns of health events in a specified population. The frequency of health-related events involves a series of measures, including prevalence and incidence, to quantify the risk or rate of a health event in a population. These measures are introduced in the next section. The aim of descriptive epidemiology is to describe the differences in disease occurrence in relation to time, place and personal characteristics, which indicate the patterns of disease or health-related events. Variations in disease patterns can be used to formulate hypotheses and the hypotheses will be further tested in analytic investigations in order to identify possible causes of disease or health-related events. More specifically, analytic studies attempt to establish the associations between a disease or health outcome and the ‘determinants’ (or risk factors) of the health outcome in order to control and prevent the disease.
As shown in Figure 10.1, the model of natural history of disease and the three levels of disease prevention can be applied to all kinds of disease. Understanding the natural course of a disease is essential to applying epidemiological principles for disease prevention.
What are the primary, secondary and tertiary prevention options in relation to different phases of disease development for the following diseases?
1 Breast cancer in women aged 40 and over
2 Seasonal influenza in primary school children in Australia.
Frequency of disease occurrence
Measures of disease occurrence form the basis of quantitative analysis in epidemiology. Measuring disease frequencies allows epidemiologists or health practitioners to make meaningful comparisons between different populations or different geographic locations. In epidemiology, a ‘proportion’ or a ‘rate’ is preferred for the measure of disease frequency. A simple count or the number of cases without a population reference is less useful than a proportion or a rate. A proportion describes the probability or the relative frequency of an event in a specified population, while a rate incorporates a time unit in the denominator. The most commonly used measures of disease frequency are prevalence and incidence. As they are the basic measures in descriptive epidemiology but very different in many ways, it is important to understand the definitions and purposes of these two measures.
Prevalence
The prevalence of a disease or health event expresses the number of existing cases in a population at a particular point in time. There are two common types of prevalence measures: period prevalence and point prevalence. Period prevalence measures the total number of cases during a particular period of time divided by the total population at the mid-interval of the observation period. As students often confuse period prevalence with incidence, this chapter deals only with point prevalence. The formula for (point) prevalence calculation is:

The prevalence of a disease or a health event can be assessed in many ways, such as the baseline of a longitudinal study, disease screening or surveillance at a specific point in time (for example, a cross-sectional survey). Data can also be collected from medical records, death registrations, routinely collected administrative data, disease surveillance (disease notification systems) and screening programs. Prevalence is a proportion, not a rate. It has no measurement unit but can be expressed in terms of a population unit multiplier, such as per 100 people (which can also be presented as a percentage, %), per 1000 people (103 people) or per 100000 people (105 people) in relation to the size of the reference population (the population multiplier is denoted as 10n). It does not involve a period of follow-up but changes from time to time, depending on a constant inflow of new cases and outflow of old cases (for example, recoveries and deaths). Prevalence is a basic measure used to assess the burden of a disease in a population or community.
Incidence
Incidence measures the probability of developing a disease (or a health condition) over a given period of time. It takes into account the total new cases and the time of follow-up. There are two types of incidence, each represented as a proportion or rate. The choice of incidence measure depends on the data available and the purpose of calculation. In different forms of incidence, the numerator is always measuring the new events (for example, total new cases over a specified time period) in different incidence measures.
Cumulative incidence (CI) is defined as the proportion of people in a population who develop a disease or a health-related event within a specific interval. It can be expressed as the following formula:

The denominator for CI is the total ‘population at risk’ (Webb & Bain, 2011, pp. 36–7) of developing the disease or health-related event at the beginning of the study. In other words, the candidate population should be composed of disease-free subjects at the starting point of the study (given a specific interval of observation). It assumes that all members in the population are followed up for the same period. It can be used to calculate the lifetime risk of an event.
In epidemiological practice, especially when the study involves a long period of observation, it is unrealistic to assume that all members in the population are followed up or stay in the study for the same amount of time. Participants leave a study for various reasons such as health conditions, deaths, losing contact or simply losing interest. To take into account the potential dropouts in a follow-up study as well as various lengths of observation, another form of incidence measure, incidence density (ID), is often used. Incidence density is defined as the number of new cases divided by the total person-time at risk in the study population. The formula is:

The numerator in an incidence density calculation is total new cases in a specified period, which is the same as that in CI calculation. The denominator is the total person-time, which is the sum of each individual’s time at risk. Person-time needs to be specified as person-days, months or years, depending on the unit of time measured in the observation. ID is a rate as it includes a time unit in the denominator.
Differences between prevalence and incidence
Table 10.1 summarises the differences between prevalence and incidence considering the different elements in the formula of each measure, such as numerator, denominator, time and their epidemiological meanings. ‘Incidence’ refers to the risk of developing a disease. It can also be applied to measure the development of death or mortality. As population changes with time, in public health practice mid-interval population is often used for population estimates. Other public health measures such as maternal mortality rate and infant mortality rate are common indicators used to compare the levels of public health status in different communities, countries or populations. They are two key indicators in the Millennium Development Goals. In addition, attack rate (the percentage of people at risk from an infectious agent who become sick, which is the most commonly used incidence measure for infectious disease) and the case-fatality rate (the proportion of people with a specific disease who die from the disease in a given period of time, measuring the severity of a disease) used in disease epidemic investigations are also extensive measures of incidence.
| Prevalence | Incidence |
|---|---|
| • Proportion | • Proportion (CI) or rate (ID) |
| • Measuring at one point in time | • Measuring a period of time |
| • Follow-up not required | • Follow-up required for individuals in the population |
| • Numerator: existing cases | • Numerator: total new cases during a specified period of time |
| • Denominator: total population at a specified point in time | • Denominator: total population at beginning of follow-up (CI) or total person-time (follow-ups) of the study population (ID) |
| • Assessing the burden of a disease in a population | • Measuring the risk of developing a disease |
The following example (Figure 10.2) is a hypothetical follow-up study to measure the risk of disease X. It is assumed that the total observation period was eight years. Of all 10 participants, some were followed up all the way through (for eight years, participants 1, 6 and 9) but some left the study or developed the disease before the study ended.
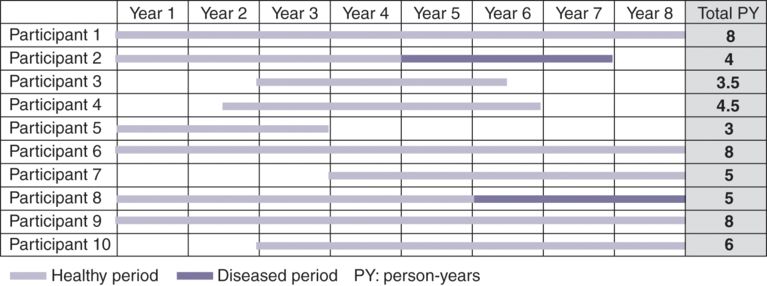
Example of an eight-year long follow-up study: ID calculation
Descriptive epidemiology: time, personal and place characteristics
With regard to patterns of health events in a population or populations, epidemiologists make comparisons of time, personal and place characteristics in order to find out the underlying causes of the events. Time characteristics are useful for assessing changes in the risks (such as prevalence and incidence) of disease or health-related events over time and identifying possible epidemics. For example, seasonal patterns have been noted in some disease occurrences, such as seasonal influenza (more prevalent in cool winter) and food poisoning (common in hot summer). Long-term monitoring of disease (disease surveillance) is crucial to identifying any unusual patterns or increase of disease rate, and thus helps public health authorities and practitioners to take timely action to control the disease and prevent large outbreaks. Figure 10.3 shows influenza notifications from 2007 to 2011 in Australia (National Notifiable Diseases Surveillance System, Department of Health, Australia, 2013). There was a periodic (seasonal) pattern of influenza rate, peaking in cooler seasons (June to September). The pandemic influenza H1N1 (swine flu) in 2009 had been deemed as contributing largely to the dramatic increase of the influenza rate in Australia that year.
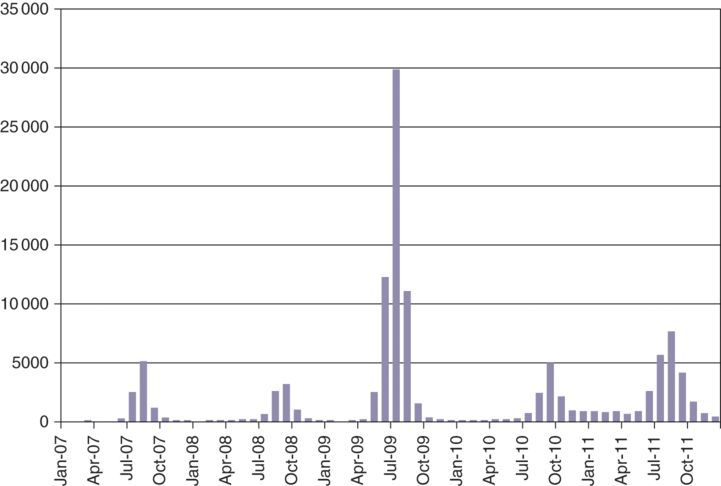
Monthly influenza notifications in Australia from 2005 to 2011
Descriptive comparisons regarding ‘personal’ characteristics include socio-demographic characteristics such as sex, age, race/ethnicity, marital status, education, employment status, socio-economic status and behavioural risk factors. Data from the Australian Institute of Health and Welfare (2014) in Figure 10.4 shows that age-specific mortality rates appear to rise sharply in older age groups (for example, those 50 years and older) for both males and females. Males seem to have higher mortality rates than females across different age groups. In addition, the figure also reveals an issue involving a sub-population, Aboriginal and Torres Strait Islander peoples in Australia. It is clear that the age-specific mortality rates in all age groups are double or even higher in Indigenous populations compared with the general population, except the oldest group (75+). The figures can be used to address the issues of health inequality (see also chapters 1 and 5 in this volume).
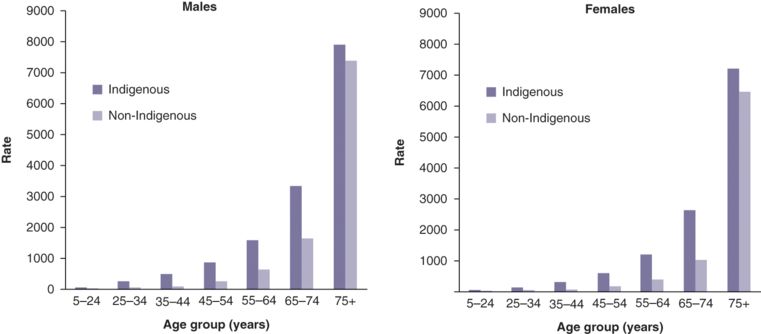
Age-specific mortality rates, by sex and indigenous status, NSW, Qld, WA, SA and NT combined, 2008–12 (mortality: deaths per 100000 population)
The characteristics of ‘place’ consider geographic variation, urban–rural differences, and locations of workplaces where the health issue or event occurs. During the H1N1 (swine flu) pandemic, the World Health Organization released the surveillance data on new cases, accumulated cases and deaths due to H1N1 infection, and recommended control measures regularly. Figure 10.5 shows the confirmed numbers of cases and deaths reported to World Health Organization in September 2009. Since the Director-General of World Health Organization announced the start of pandemic H1N1 on 11 June 2009, the disease had spread across almost all continents, including Australia. Scientists apply the Geographic Information System to visualise geographic patterns of disease epidemics, so the comparison of the pandemic H1N1 map at different points in time allowed epidemiologists to monitor how quickly the disease spread across countries and how severely the disease affected different regions or countries (for example, comparing the number of deaths).
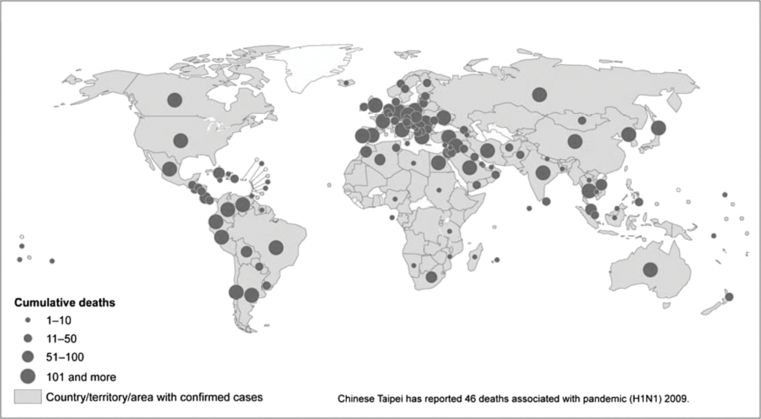
Pandemic (H1N1) in 2009: countries, territories and areas with laboratory-confirmed cases and the number of deaths as reported to the World Health Organization (World Health Organization, 2011, p. 62)
As mentioned in the section on incidence measures, mortality is a basic public health measure used to compare the levels of public health status in different communities or populations. Figure 10.6 presents the gender-specific mortality rates between New South Wales and Northern Territory from 2003 to 2013.
How do the mortality rates vary in terms of time, personal and place characteristics between the populations in New South Wales and the Northern Territory? (See Figure 10.6.)
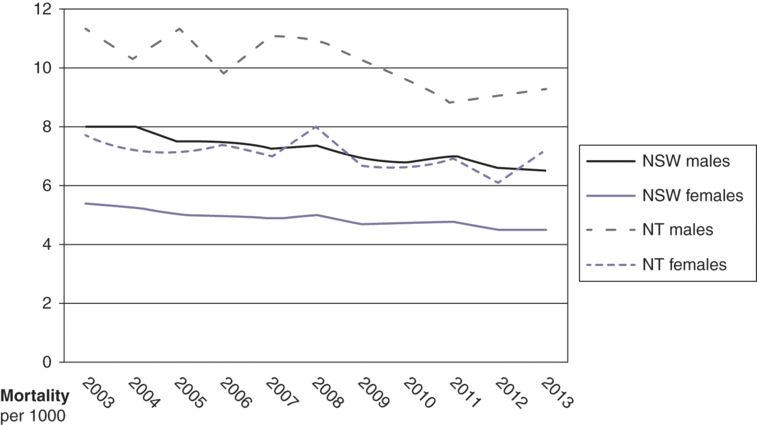
Standardised mortality rates between New South Wales and the Northern Territory, 2003–13 (Australian Bureau of Statistics, 2014)
Epidemiological study designs
As discussed in the previous sections, epidemiological studies can be classified under two large categories: descriptive and analytic approaches. Figure 10.7 illustrates the commonly used epidemiological study designs and the strength of evidence for association between a risk factor (an exposure) and a health outcome in relation to different study designs. Descriptive studies cannot be used to establish causal relationships, whereas an analytic approach (which includes observational and experimental/intervention studies) looks for associations between potential causes (exposures) and disease occurrence (outcomes). Experimental or intervention design providing the strongest evidence for association is considered to be on the top level of the hierarchy of all epidemiological study designs, while observational designs (including cross-sectional, case-control and cohort studies) remain important in providing a significant amount of evidence regarding causal inferences in epidemiology.
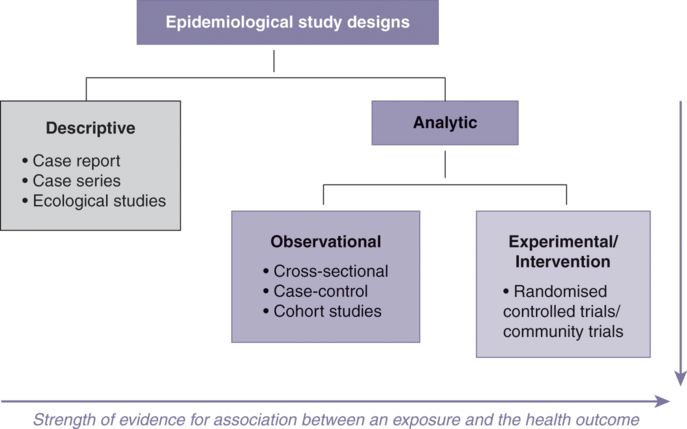
Epidemiological study designs and the strength of evidence for association between a risk factor (an exposure) and a health outcome
Descriptive studies
Epidemiological data can be obtained from a broad range of sources and routinely collected data, including death registrations, disease surveillance, vital statistics, census data, hospital records and population surveys. This data can be used to describe the burden of disease in a community and inform disease patterns and the changes in disease trend by investigating the ‘what, who, when and where’ of the health-related events in ‘descriptive studies’. They can also be used to identify the possible causes of a specified health event or outcome in ‘analytic studies’. For example, migrant studies compare the differences in disease rates in migrant populations over generations and between countries to find out if the differences are due to genetic or environmental reasons (for example, changes in lifestyles). The other common forms of descriptive studies include case reports and case series of unusual medical occurrences or adverse events. Case series are collections of individual case reports. Data is collected by physicians and documented if the disease has not been seen before or has been observed in an unusual form among the reported cases. It is crucial to identifying a new disease or a potential epidemic.
In ecological studies researchers make use of routinely collected data such as disease incidence, prevalence and mortality data to investigate the relationship between the disease rate and the prevalence of a specific factor over time or in different geographic areas. These studies describe the disease patterns and attempt to establish an association between disease and exposure. A shortcoming of these studies is that they do not relate exposure and outcome in individuals. There are likely to be many factors other than the exposure being studied, and these also contribute to the occurrence of the disease. Instead, ecological studies compare disease rate and the prevalence of exposure (for example, unemployment rate) at the population level. This is known as the ‘ecological fallacy’. Ecological fallacies may occur when an association observed between exposure and outcome at an aggregate level (population level) does not necessarily represent the association existing at an individual level (Büttner & Muller, 2011).
Analytic studies
The analytic approach in epidemiology attempts to answer the ‘why’ and ‘how’ of the variations in health outcomes observed in different groups, communities and populations. The different outcomes can be attributed to varying demographic characteristics, socio-economic status, genetic factors, immunological status, environmental exposures, and other behavioural risk factors which are potentially underlying causes of a disease. Data for analytic studies can be collected in various ways as detailed in ‘Descriptive studies’. A general term ‘exposure’ is used to represent ‘potential causes’ of a health outcome. The ‘exposure’ may be a risk factor, a protective factor or a treatment/intervention depending on the nature of the exposure factor and the study design. Analytic studies (including observational and experimental/intervention studies) are concerned with the association between exposure status and a health event; comparing two groups allows the study hypothesis to test whether a relationship exists. For example, we might ask ‘are smokers more likely to develop coronary heart disease than non-smokers?’ in an analytic study. In observational studies (including cross-sectional, case-control and cohort studies) researchers observe the study subjects and measure the exposure and outcome variables without providing treatments/interventions to the subjects. On the other hand, experimental/intervention studies allow researchers to control the ‘exposure’ factor and replace it with ‘a treatment/an intervention’ to see its effect on the outcome variable (see Figure 10.7).
Stay updated, free articles. Join our Telegram channel

Full access? Get Clinical Tree


