Fig. 1
4Pi setup. (a) Scheme of the commercially available 4Pi setup (TCS 4Pi microscope, type A, Leica Microsystems, Mannheim, Germany). O1 and O2: objective lenses; S: sample; BS: beamsplitter; PC: phase control; PZ: piezo-element; SU: scan unit; PH: pinhole; APD: avalanche photodiode; TiSa: Ti:sapphire laser. (b) 4Pi PSF profiles along the optical axis for glycerol immersion lenses (100×, NA = 1.35, circles) and water immersion lenses (63×, NA = 1.2, triangles) in a two-photon 4Pi microscope type A determined at immobilized beads of subresolution size
The two interferometer arms can be independently blocked by shutters. Thus, the microscope can be used in the confocal mode with the upright or inverted beam path and single- or two-photon excitation or as a two-photon excitation 4Pi microscope. Unlike in a classical type A setup, where detection of the emission light is blocked in one interferometer arm, emission light is collected through both objectives and detected in a noncoherent fashion. For two-photon excitation, a mode-locked Ti:sapphire laser (MaiTai, Spectra Physics, Mountain View, USA) with a pulse length stretched to >1 ps is employed. Its wavelength can be tuned in the range of 710–990 nm. Fluorescence originating from the sample is imaged onto the confocal pinhole of the SP2 system, then passed a filter cube (SP700, BS560, BP500–550, and BP607–683; Chroma Technology Corporation, Bellow Falls, USA), and fluorescence intensity was measured by photon-counting avalanche photodiodes (PerkinElmer, Foster City, USA).
2.2 Objectives
As mentioned above, in 4Pi microscopy constructive interference of two opposing wave fronts yields a main diffraction maximum that is 3–7 times narrower than that of a single lens. But the drawback of this optical configuration is the appearance of elevated side lobes along the optical axis. To obtain the highest possible image resolution, the height of the side lobes has to be <50 % of that of the main maximum [25]. Otherwise spatial information is partially lost, as indicated by a frequency gap in the corresponding optical transfer function (OTF). The relative height of the side lobes sharply decreases with increasing semi-aperture angle α of the objectives, and hence, the best performance is reached with the highest possible α. Oil immersion lenses such as the HCX PL APO CS 100/1.46 Oil (Leica Microsystems, Mannheim) provide a semi-aperture angle of α = 74° and, in combination with a high refractive index embedding medium (97 % thiodiethanol, TDE [26]), yield a resolution along the optical axis of ~100 nm [27]. In addition, it has been reported that these lenses enable 4Pi confocal fluorescence microscopy of type C and even type A employing one-photon excitation [9, 28]. However, the application of oil immersion lenses requires embedding media with a refractive index close to 1.52.
Glycerol immersion lenses such as the HCX PL APO 100/1.35 Gly Corr (Leica Microsystems, Mannheim) provide a semi-aperture angle of 68.5° [29]. Calculations suggested that at α > 68° 4Pi microscopy of type A should be feasible employing one-photon excitation, but experiments showed insufficient side lobe suppression [28]. Hence, two-photon excitation has to be employed. Typically, a FWHM of ~110 nm for the main peak can be achieved accompanied by side lobes of ~30 % relative height. Although this resolution is slightly smaller than that achieved with oil immersion lenses and that two-photon excitation is required, glycerol immersion objectives appear advantageous for imaging fixed specimens. The correction collar of these objectives tolerates refractive indices ranging from ~1.44 to ~1.46, corresponding to glycerol concentrations between 72 and 88 %. In combination with quartz coverslips, an isotropic refractive index of 1.46 throughout the optical path is generated, and proper interference of the opposing beams can be optimized. In our hands glycerol immersion yielded the most reliable 4Pi measurements and was least sensitive to sample preparation.
For live cell imaging or analysis of cellular preparations under physiological conditions, water immersion objectives are required (e.g., HCX PL APO 63/1.2W Corr, Leica Microsystems, Mannheim). The reduced NA of 1.2 results in a decreased FWHM of 150–180 nm for the main maximum [30, 31], and due to the discontinuity of the refractive index at the glass/water interface, this configuration is highly sensitive to any inaccuracy along the optical path like poorly adjusted correction collars with respect to coverslip thickness or even slight tilting of the probe. 4Pi PSF profiles along the optical axis for glycerol immersion lenses (100×, NA = 1.35) and water immersion lenses (63×, NA = 1.2) are shown in Fig. 1b (for a specialized configuration see Note 1 ).
3 Methods
3.1 General Aspects
3.1.1 Sample Preparation
For 4Pi microscopy, the sample is sandwiched between two coverslips. This configuration permits focusing the coaxial but antiparallel laser beams into a common point within the sample. Because the working distance of high NA objectives is very small, the layer thickness between the two coverslips should not exceed 30 μm. Furthermore, great care has to be taken to avoid a deformation of the 4Pi point spread function (PSF), which can be induced by any refractive index mismatch. It is therefore essential to use the highest-quality coverslips of well-defined thickness (see Note 2 ) and to adjust the correction collar of the objectives properly (see Note 3 ). Additionally, the sample has to contain a reference which can be used to align the focus and phase of the counter-propagating waves. This reference can consist of either fluorescently labeled endogenous point- or rodlike structures of sub-diffraction dimensions or of artificial immobilized fluorescent beads (see Note 4 ). To prepare such samples use the following protocol:
1.
Chose coverslips (30 mm in diameter) depending on the objective configuration of the 4Pi microscope (quartz coverslips for glycerol immersion lenses, BK7 coverslips for water immersion lenses, see Note 2 ).
2.
Coat a coverslip with poly-(L)-lysine (0.01 %) by distributing a drop of solution on the coverslip surface. Wait for 10 min, wash with ddH2O, and let dry.
3.
Add 10 μl of bead solution (see Note 4 ). After evaporation of ddH2O most of the beads are immobilized on the glass surface.
4.
Glue the coverslip (intended to be at the bottom of the chamber) carefully to a sample holder (available from Leica Microsystems, Mannheim). Try to avoid any tilting.
5.
Put a thin layer of mounting medium (15–25 μl) on top of the coverslip. The choice of mounting medium depends on the objectives used in the 4Pi experiment (see below).
6.
Mount the second coverslip with the specimen upside down in the sample holder.
7.
Finally seal the samples with a special two-component kneading silicone, and check the thickness of the complete sample holder. The thickness of the layer between the two coverslips should not exceed 30 μm.
For oil immersion lenses in combination with 97 %, TDE as embedding medium (see Note 5 ), the best results have been reported by a stepwise increase of TDE concentration during several washing steps of the fixed specimen [26].
With glycerol immersion lenses, all components between the two opposing objective lenses have to be adjusted to a refractive index close to 1.46. This can be achieved by using quartz coverslips and immersing cells in 87 % PBS-buffered glycerol (see Note 6 ). Of course, quartz coverslips are much more costly than standard BK7 glass coverslips.
With water immersion lenses, samples can be mounted in aqueous buffer (n = 1.33–1.34), but special care has to be taken to avoid even the slight tilting of the coverslips.
3.1.2 Deconvolution of Raw Data
To obtain full image resolution, 4Pi data have to be post-processed to remove ghost images. Various methods have been described for this purpose ranging from three- or five-point linear filters [32] to nonlinear mathematical image restoration algorithms [8]. Like in any imaging system, the image can be described by a convolution of the unknown object function with the PSF of the microscope. In a first approximation, the 4Pi PSF can be separated into independent radial and axial contributions allowing for fast deconvolution algorithms. Here, the axial profile is approximated by a convolution of a peak intensity function describing a single maximum and a lobe function representing relative position and height of the three maxima. Side lobes can be then removed by convolution of the image function with the inverse of the lobe function. This so-called three- or five-point linear deconvolution is fast and robust and does not require highly accurate PSF measurements. But two requirements have to be fulfilled to make this approach feasible. First, the relative height of the side lobes must be constant with respect to a lateral offset from the optical axis. Second, the PSF has to be spatially invariant in the image. When these requirements are met, linear point deconvolution enables easy side lobe removal without highly accurate PSF measurements, but at the expense of a decreased effective signal-to-noise ratio and no further enhancement of resolution.
In contrast, resolution can be further enhanced by direct linear deconvolution, i.e., inverse filtering of the complete image with the 4Pi PSF. This works well for noise-free images and a spatially invariant and perfectly known PSF. In reality, however, an additional filter (like, e.g., Wiener filter) has to be implemented to account for noise. Though an additional resolution enhancement up to 50 % can be achieved using linear deconvolution, a limited signal-to-noise ratio and improper description of the 4Pi PSF make this approach unfeasible in many cases.
Nonlinear image restoration methods, e.g., based on Richardson-Lucy deconvolution, use a maximum-likelihood algorithm to iteratively minimize the deviation between the measured image and estimated object. These algorithms offer the advantage of noise reduction and resolution enhancement but are slow and susceptible to poor PSF measurements.
One prerequisite for all deconvolution methods described here is a spatial invariant PSF in the image. In practice, this is not always the case, i.e., the PSF depends on the position in the sample most often manifested in a phase shift of the interference pattern along the optical axis. Methods for deconvolution with a variable PSF have been described to account for this problem [33].
3.1.3 Localization of Single Epitopes
The position of single point-like objects, although imaged as diffraction limited spots, can be determined with a precision that is one order of magnitude higher than the optical resolution by fitting the measured photon distribution to an ideal Gaussian [34]. In 4Pi microscopy, the main peak of the PSF has an FWHM of 100 nm in the direction of the optical axis at optimal conditions and thus is 6–7-fold smaller than that of a confocal PSF. The localization precision of diffraction-limited signals scales with ~FWHM/√n, with n being the number of photons detected, meaning that improved optical resolution, at least in principle, provides higher accuracy. Additionally, two opposing lenses are capable of detecting more photons than a single lens which leads to a further increase of localization accuracy. As the 4Pi PSF is intrinsically elliptical, a true 2D fitting routine is essential for proper centroid localization (see Note 7 ). Taking these parameters into account, a localization accuracy of only a few nm has been demonstrated for 4Pi microscopy [35, 36].
3.2 4Pi Microscopy of the Nuclear Pore Complex
3.2.1 Imaging of Single Nuclear Pores in Fixed Specimens
Labeling of mammalian cell nuclei with fluorescent NPC-specific antibodies typically results in a punctate staining of the nuclear periphery. The dots of the punctate pattern usually have a density of ~5/μm2 and a corresponding nearest neighbor distance of ≤0.4 μm. By confocal scanning microscopy it has been shown that the dots predominantly represent single NPCs, while NPCs which occur as part of a cluster cannot be resolved [37, 38]. The central axis of the NPC is perpendicular to the plane of the nuclear envelope, and therefore the central axis of NPCs in the upper and lower nuclear membrane co-aligns with the optical axis of the microscope. All these parameters—size, density, and orientation—make the NPC an ideal object for 4Pi studies. We started 4Pi analysis of the NPC by using a primary antibody against Nup358, the major component of the cytoplasmic filaments of the NPC.
1.
Grow HeLa cells on quartz coverslips (220 μm thickness) to 70 % confluency.
2.
Fix cells in 4 % paraformaldehyde for 20 min at room temperature, wash three times with phosphate-buffered saline (PBS, 138 mM NaCl, 2.7 mM KCl, 10 mM Na2HPO4, 2 mM KH2PO4, pH 7.4), and permeabilize in 0.25 % Triton X-100.
3.
Wash three times with PBS, block unspecific binding with 0.5 % fish skin gelatin for 30 min at room temperature, and incubate with a primary antibody directed against Nup358 (1:2,000, kind gift from Dr. E. Coutavas) for 1 h at room temperature. Wash for 20 min in PBS, and incubate with secondary antibody (goat-α-rabbit, Alexa488 conjugated, 1:1,000, Invitrogen) for 1 h at room temperature. Wash cells for 20 min in PBS.
4.
Prepare the coverslip intended to be at the bottom of the sample, and glue it in a sample holder as described above. Apply 15 μl of PBS-buffered glycerol (87 % w/w) onto the coverslip.
5.
Mount the second coverslip with attached cells upside down. Seal the sample with two-component silicone.
6.
Transfer the sample to the 4Pi microscope equipped with glycerol immersion lenses using glycerol (87 % w/w) as immersion medium. Set the excitation wavelength of the Ti:sapphire laser to 820 nm, the beam expander to 6, and the confocal pinhole size to 0.8 Airy units to further reduce relative side lobe height [35].
7.
Align focus and phase of the counter-propagating beams using immobilized beads as a reference. When focus and phase are properly adjusted, the FWHM of the main peak of the PSF should be 110–115 nm with relative side lobe height of 30 %.
8.
Switch the focal plane to the upper coverslip with attached cells and record xz scans of cell nuclei.
A comparison of confocal and 4Pi axial sections is shown in Fig. 2. In confocal images NPCs appear as diffraction limited spots which are blurred in xz-direction (Fig. 2a, d). In contrast, 4Pi images of NPCs consist of a narrow main maximum (FWHM ~ 110 nm) accompanied by two ghost images of ~30 % relative intensity (Fig. 2c, e). These ghost images could be removed by using simple 3-point linear deconvolution (see Note 8 ) resulting in a true resolution of 110 nm along the optical axis (Fig. 2f). Since the density of NPCs is relatively large in HeLa cells, the increase in resolution simplifies discrimination of single NPCs in 4Pi images. However, a close inspection of the representative optical section through a complete HeLa cell nucleus reveals that even using an almost isotropic refractive index throughout the optical path, the 4Pi PSF still depends on optical path length in the specimen (Fig. 2e). While in the lower nuclear membrane, the 4Pi raw images of the NPC consist of strong main peaks and weak side lobes, one of the side lobes is almost as strong as the main peak at the upper nuclear membrane, making the PSF asymmetric. Therefore, the applied deconvolution scheme is quite successful on the lower, but not on the upper nuclear envelope. An improvement in such cases could be achieved by active external phase compensation or more sophisticated deconvolution algorithms.
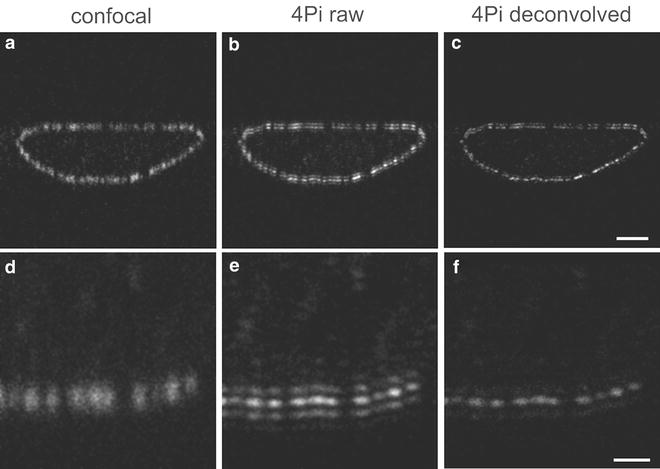
Fig. 2


Imaging of single NPCs by 4Pi microscopy. HeLa cells were labeled by secondary immune fluorescence techniques using a primary antibody against the NPC protein Nup358 and an Alexa488-labeled secondary antibody. Images show an axial section of a HeLa cell nucleus imaged in confocal (a) and 4Pi mode, the latter as raw data in (b) and after removal of side lobes by deconvolution in (c). A detailed view from the same nucleus acquired at a higher zoom factor is shown for the confocal mode in (d), corresponding 4Pi raw and deconvolved images are shown in (e) and (f). Scale bars: 2 μm and 0.5 μm, respectively (adapted by permission from Elsevier Ltd: Biophysical Journal, copyright 2008 [35])
Stay updated, free articles. Join our Telegram channel
Full access? Get Clinical Tree
