FIGURE 4.1 QI for a given process. QI seeks to eliminate inefficiencies in a process through reduction of variation and waste. The current process exhibits high variation and waste, and QC measures do not adequately manage the process. After a period of QI, the desired process shows much smaller variation and waste and tighter control of the process using the new QC measures. Lean Six Sigma methodology seeks to identify, measure, and eliminate the large gaps of inefficiency in a process. Examples from the laboratory include data accuracy, turnaround times, and reagent inventory.
ADOPTION AND IMPLEMENTATION OF LEAN SIX SIGMA
Effective adoption of Lean Six Sigma for process improvement requires an organization-wide dedication and support for a continuous process improvement culture. A pioneer in this field, Dr. J. M. Juran taught that continuous improvement does not make an organization distinctive or “excellent.” Instead, it is the rate of improvement that distinguishes an organization.1 Effecting change will not occur without support from senior members within the organization. These leaders select and assign QI projects to teams within the organization.
The most common team roles are the project coaches/leaders (black belts), project team members (green belts and yellow belts), and project sponsors or champions that may or may not have much experience with LSS but are critical to the success of implementing change within an organization. The colored belt designations are given to different levels and types of training in either Lean or Six Sigma, with some overlap (e.g., the highest levels are Black Belts in both Lean and Six Sigma). Their application to health care and mixing of the complementary methodologies has led to the use of varied designations, which we here discuss in general terms only. Black belt–trained coaches dedicate as much as 100% of their time to QI projects, proactively addressing process and quality opportunities for improvement. Black belt training includes training at all levels (e.g., yellow, green) in addition to significant additional training in statistical analysis, coaching, and facilitation. Black belt certification additionally involves the successful completion of multiple projects and written test. Green belt training focuses on understanding and applying the five phases of the Six Sigma process, including completion of a project for certification. Green Belt trainees contribute approximately 20% of their time to improvement projects while delivering their normal job functions. Yellow belt training includes a full day basic Lean Six Sigma training, including interactive and didactic training program, as a perquisite for all participation in projects. Sponsors or Champions attend a 1-day training class and are usually mid- to senior-level leaders who review the project, remove organizational barriers, and encourage the team members. In the laboratory, a team may consist of technologists with subject matter expertise (and trained as yellow or green belts in our organization), supervisors, directors, and a black belt or an expert consultant who will coach the team (Boxes 4.1, 4.2, 4.3, 4.4).
 BOX 4.1
Each phase of a Six Sigma project is data driven. Examples of projects included in our laboratory organization have included (1) Reducing Billing Errors in the Laboratory, which provided a significant monetary savings to the organization and (2) Reducing Blood Wastage in the Blood Bank, which modified processes to ensure there were continued sufficient blood product supply for our patients and also provided monetary savings to the organization. These usually target quality or time-related problems expressed as numbers, percentages, or dollars with unknown causes. Remember these are very data driven.
 BOX 4.2
Lean improvement projects are typically headed by black belts using staff trained in Lean principles. This is usually a 3- to 5-day project to reduce waste, such as turnaround times, wait times, flow or cycle times, and causes that can be seen by observation. The team actually does a “Gemba Walk” by going to the area and personally observing the “thing” going through the process. A Lean project is fast and is done in conjunction with the staff. It is very helpful to share some of the Lean basics so that all staff are knowledgeable and included in the process prior to the actual event. Planning is intense for several weeks prior to the event; however, the actual event is a 3- to 5-day project called a Kaizen event. Laboratories lend themselves well to Lean projects to create better workflow and reduce walking or motion time and to produce a more value-added system and reduce waste. Some of the common Lean tools used include process mapping, value stream analysis, spaghetti charts, visual management, 6S (5S plus safety), impact effort grids, Kanban cards, and the identification of the eight Wastes of Lean or Muda (transportation, inventory, movement, waiting, overproduction, overprocessing, defects, underutilization of resources). Other Lean opportunities include shifting from push to pull, single piece flow, work leveling, and the focus of “doing it right, the first time.” Lean allows for rapid improvement projects. Staff are dedicated to the project for the entire Kaizen event. Effective planning makes the Kaizen more productive and more fun for the team and develops ownership.
 BOX 4.3
Most of our Lean improvement projects start with organizing the areas using 5S (Set, Sort, Shine, Standardize, Sustain, and Safety has been added to make it 6S). One project involving 6S ultimately resulted in enough workbench space cleared in conjunction with some renovations that another workstation was able to be added. This was a significant improvement as we needed another workstation to keep up with the workload due to the opening of our new cancer center. Also with the changes, we were to ensure that each product had a dedicated space, which improved patient safety for the processing of these products. Other projects in addition to 6S have improved ergonomics for staff, a significant reduction in motion and transportation, added recycling of plastics collecting 96 gallons per week that have tripled since implementation, and Kanban systems to help with supply ordering have been implemented to prevent laboratories from “running out” of supplies and reagents as well as prevent overstocking. Other changes that have occurred due to our Kaizens are one-piece flow, development of a “cell” workflow, visual aids using color designations that have helped staff, use of value stream mapping to determine the most efficient workflow to redesign an area, and time savings on locating supplies by reorganizing and use of visual aids. To document our Kaizen events, we utilize A3 worksheets that consist of nine boxes (Reason for Action, Current State, Target State, Gap analysis, Solution approach, Experiments, Completion plan, Confirmed State and Insights).
 BOX 4.4
Two other project types are Express Workouts and Process Design. If there is a well-understood focused problem for which the cause is known, then an Express Workout concept is utilized by working with a team over 6 weeks to improve the process and ultimately addressing process control. We utilized this technique in our lab for Serum Protein Electrophoresis testing and Interpretation. We knew there were duplication and overlapping of efforts by the technologists and the attending physicians. By mapping out each part of the process by groups and then bringing all participants back together, we were able to streamline the total process by eliminating 16 steps and a time saving of 1.5 to 2 hours per day. Note that savings are not used to eliminate staff but allows for other responsibilities to be performed. Process design is utilized in the planning for a new facility or laboratory. A team of black belts and senior level executives work together over a 6- to 12-month period.
PROCESS IMPROVEMENT
All work is a dynamic process, and every process has variation, overlap, and waste. Variation results in unpredictable and undesirable outcomes. Waste results in increased cost and delays and thereby limiting efficiency. Lean Six Sigma uses a problem–cause–solution methodology to improve any process through waste elimination and variation reduction. The DMAIC (Define, Measure, Analyze, Improve, Control) methodology is the QI team’s project management road map (Fig. 4.2). The five phases allow for the identification of the root cause for error and waste through establishment of the following:
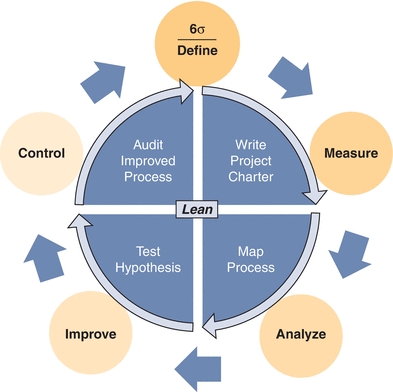
FIGURE 4.2 Integration of Six Sigma and Lean principles. The methodologies of Six Sigma manufacturing and Lean process optimization are combined to an iterative cycle of QI. Applications of Lean Six Sigma are now being applied to all aspects of the laboratory and the health care system as a whole.
1. A universally accepted framework for QI
2. Common language throughout the organization
3. A checklist to guide the process
4. Control measures to sustain improvements and offer long-term monitoring
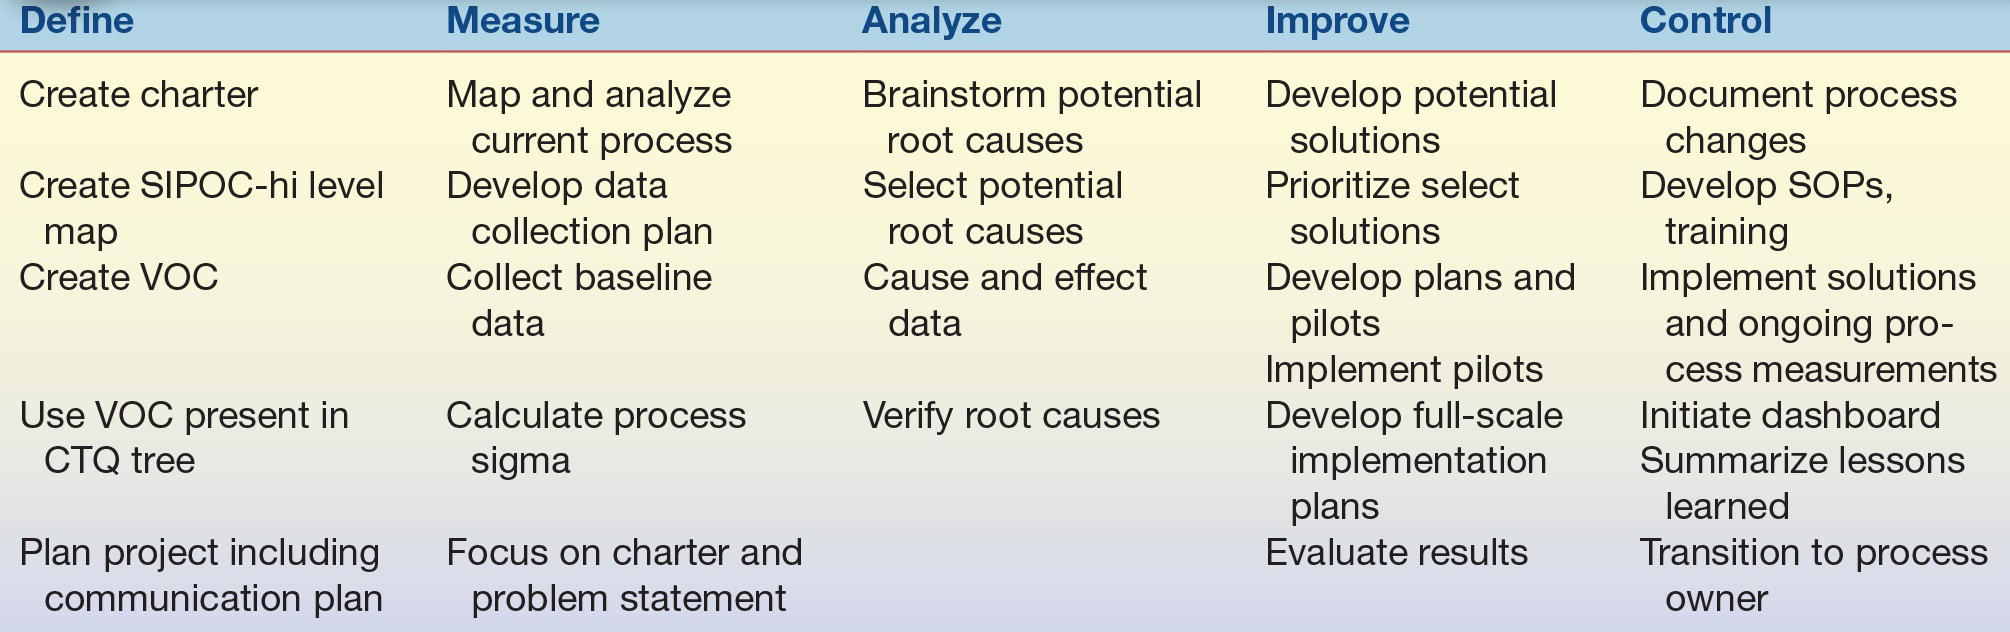
The Define phase validates the problem(s) and explicitly describes the QI issues starting with a project charter. In constructing the charter, establish a problem statement, the importance of the project, the scope of the project and the measures, and the project schedule and resources. This should be modified by the team as the project progresses. In the Measure phase, the team collects data to measure the process and establish a baseline. The Analyze phase verifies the root causes. In the Improve phase, the team pilots process changes and evaluates and fine-tunes the new process. The Control phase maintains process gains. See Table 4.1 for the detailed listing of the general steps of process improvement. At the end of each phase, a tollgate review is set up with the entire team and their sponsor. All information in that phase is then shared, and questions and discussion follow, including testing staff as well as the team involved in the process assessment. If the work has been performed as indicated in the project plan and the objectives achieved, the team is allowed by the sponsor to proceed to the next phase.
TABLE 4.1 General Steps Within Each Phase of Process Improvement: DMAIC
Let’s apply the DMAIC methodology. The following generic example will not include all of the Six Sigma tools; however, it will provide a representation of a real Green Belt project and how the tools were used.
The project begins in the Define phase by setting a goal to reduce variation. The project charter states the overall purpose and potential impact, the scope of the project (what is included and what is not), resources (e.g., who is on the team and what resources are available to implement changes), and expectations—what will be delivered and the total project timetable. A high-level map is also created, called a SIPOC (Supply–Input–Process–Output–Customer). This encourages system thinking by focusing the team to see the process through the customer’s eyes. Team members listen and gather the voice of the customer (VOC) to identify key drivers of customer satisfaction and expand this further into a Critical to Quality (CTQ) tree to provide clarity around the aspects of the VOC and establish a specific “measurable” characteristic. The charter is a modifiable document intended to keep everyone involved and focused on the defined problem and improve the outcomes throughout the project. By the end of the Define phase, both the project team and the management team have validated the “project charter.”
The Measure phase maps, measures, and assesses the current process. This would include mapping the entire process, collecting data, and graphing, which could include histograms, box plots, dot plots, run charts (time series charts), control charts (p, np, u, or c charts depending on the type of data), and frequency charts (Pareto charts) as well as descriptive statistics. Black Belts “crunch” the data and share with the Green Belts. The collection and plotting of real data will lead the team to review the current situation in detail. Then the Process Sigma is calculated. The higher the process sigma, the less variation in the process and the better the outcome. The Process Sigma metric focuses on defects and customer expectation. The goal is to achieve Six Sigma; however, in health care, it is often in the 3 to 4 sigma range leaving many opportunities for improvement.
In the Analyze phase, the team drills down to identify the root causes of the problem using some of the following techniques: (1) brainstorming, which can be used to consider a range of root causes; (2) applying a process called the 5 Whys (to continue to drill down what the root causes of identified problems are); (3) creating Fishbone Diagrams to facilitate brainstorming and recognizing relationships; (4) creating and applying Affinity Diagrams to finding commonalities in processes; and (5) using a Failure Mode and Effect Analysis (FMEA) tool to analyze risk and highlight aspects of a process that should be targeted for improvement. Using all of the data collected, a hypothesis is created and tested and statistically analyzed. This is used by the Black Belts and Green Belts to determine if there is a difference or relationship in the data.
The team next develops strategies that address each of these specific problems and pilots the changes in the Improve phase. The team brainstorms to develop possible solutions and then prioritizes them. They develop plans and implement pilots of the possible solutions. These are then fine-tuned as needed and developed into full-scale plans. Data are collected to compare the before and after of the pilot(s) to ensure that the process has indeed improved.
The Control phase ensures that the gains made by implemented improvements are maintained by QA mechanisms. Any changes in the process are documented in procedures, and training of staff and competencies are put in place to ensure the gains are sustained. Dashboards are initiated to share the improvements, and visuals are posted to help maintain those gains. The group summarizes Lessons Learned, which can be shared with other teams to provide insight to improve future projects. Often there are subsequent projects that spin off from completed ones. Additional items arise during the project that may need solutions but are not within the scope of this project. These are noted and are called “parking lot” items, so that these items are not forgotten. These need to be reviewed to see if future projects are needed to address these or shared with the appropriate staff as needed. The DMAIC methodology (Fig. 4.2) applies to problems in the laboratory of unknown causes and allows the team to quantitatively measure the error of the process, identify the root cause(s) of the problem, develop improvement strategies, and monitor the changes in a defined manner.
MEASUREMENTS OF SUCCESS USING LEAN AND SIX SIGMA
Originally, Lean and Six Sigma were separate ideas designed to improve two related metrics: time and error. Lean was designed to eliminate non–value-adding steps or waste, and Six Sigma, which is data driven, aims to reduce variation. The metrics for measuring QI with Lean Six Sigma still reflects those original principles. The combination of these two ideas provides a positive synergistic impact on process and QI.
The Lean approach seeks to streamline the process by eliminating duplication, excess, and barriers for a more optimized flow. The major measurement for Lean is generally time, but it can also include things such as cost, inventory, distance, time, and distribution. A common method of Lean improvement is the concept of a Kaizen event. The Kaizen event is 3 to 5 days of QI by a cross-functional team that analyzes the current steps associated with a particular process and makes real-time changes to improve its efficiency. With detailed study, most teams find unnecessary complexity in their work process. This complexity often contributes to errors as well as delays. Teams typically find that only 5% of the activities in any process add value; this means that a vast majority of activities do not contribute to the process. Graphically, this might look like the redundant and nonlinear process shown in Figure 4.3. Note that for laboratories, certain steps that do not appear to add value will need to be maintained to satisfy accreditation standards. Lean Six Sigma measures the amount of non–value-adding steps in a process as part of its core metrics, by including Six Sigma methodology and Lean principles. The implemented solutions (based on charter goals) are represented by the final process in Figure 4.3 where inefficiency has been removed to illustrate a more streamlined, efficient process.
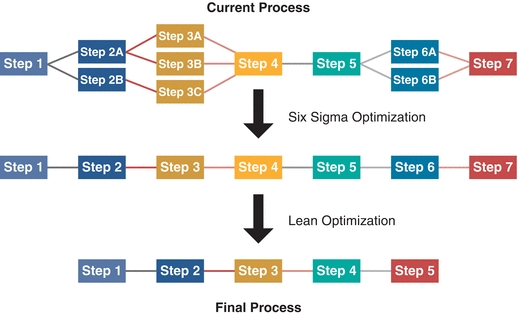
FIGURE 4.3 Application of Six Sigma and Lean methodologies toward process improvement. Steps in a process can have duplication, failure, and waste, all of which contribute to delay, increased cost, inefficiency, and longer turnaround times.
Six Sigma metrics seek to quantitatively measure the amount of error or variation that occurs within a system. A process sigma represents the capability of a process to meet (or exceed) its defined criteria for acceptability. In the laboratory, this could refer to staffing assignments, assay performance, turnaround times, number of rejected samples, specimen transport, or relay of critical values. The process sigma is usually represented as the number of defects (errors) per million opportunities (DPMO). The sigma (σ) value refers to the number of standard deviations (SDs) away from the mean a process can move before it is outside the acceptable limits (Fig. 4.4). For example, if a sodium test has Six Sigma performance, then the mean could shift by 6 SDs (6σ) and still meet the laboratory requirements for precision and accuracy for sodium measurement. If a test achieves Six Sigma (6σ), it has a narrow process SD (i.e., it is very precise) and produces only three errors for every million tests performed. A test that performs at a three sigma (3σ) has a much wider process SD and produces about 26,674 errors per million tests (Fig. 4.4).
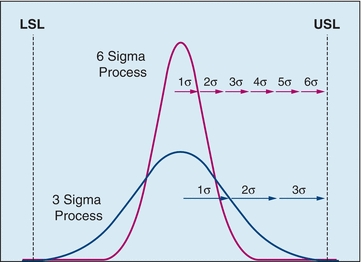
FIGURE 4.4 Comparison of Sigma performance for results distributed between the lower satisfactory limit (LSL) and the upper satisfactory limit (USL).
To calculate the sigma, defects must be clearly defined. In the laboratory, any test that does not meet its requirements (i.e., correctly quantified or delivered on time) is considered a defect. The most straightforward method uses the process yield—the percentage of times that a process is defect free. Another method to calculate the process sigma is to calculate the DPMO. For example, in the laboratory, this might be measured by the number of errors that occurs for every 1 million tests. The process sigma can be estimated from a Process Sigma table (Table 4.2) using either the process yield or the DPMO.
TABLE 4.2 Process Sigma Table
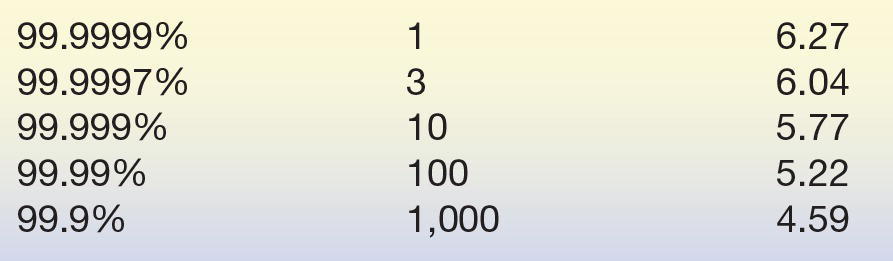
Definition of “Sigma” for a process with a given error rate.
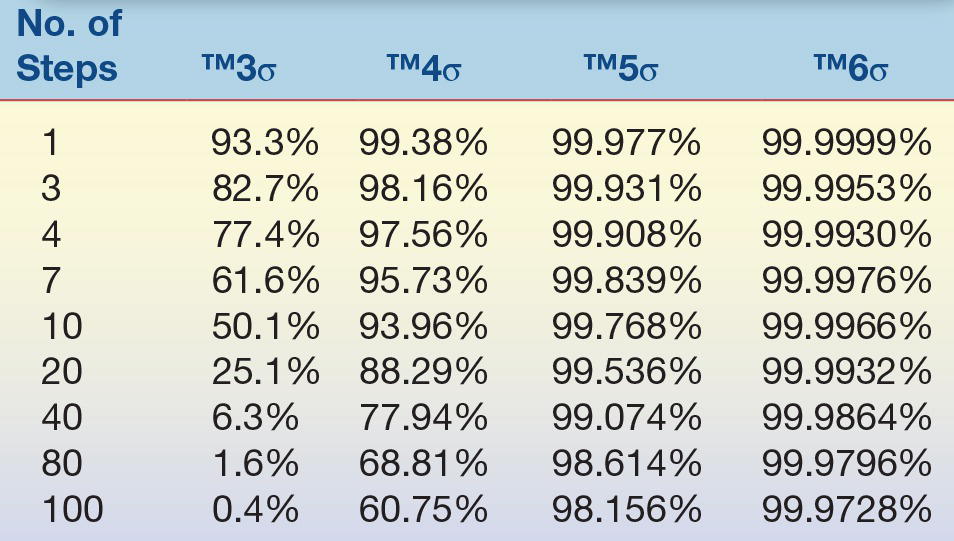
As stated earlier, eliminating non–value-adding steps and reducing variation have a synergistic positive impact on process performance (Table 4.3). Several examples illustrate this concept. Assume that there are four steps involved in testing a specimen and each step is performed at a 3σ level (each step is 93.3% accurate and timely). With this performance, approximately three out of four test results will be accurate and delivered on time (75.8%)! Now imagine that a team improves the quality of the process so that each step is performed correctly and timely at a 4σ level (99.38% accurate and timely). The new level of performance produces 97.5% of the results accurately and delivered on time. Alternatively, if a test has 10 steps, each of which operates at a 3σ level (93.3% accurate and timely) the increase in the number of slightly inaccurate steps, 50% of the tests will be inaccurate and late. Simply by eliminating unnecessary steps and maintaining a high level of performance, the team can drastically reduce the number of total errors. If the improvement team can both eliminate six steps and increase the quality of each step to a 4σ level, the process will improve so that 97.5% of the tests are accurate and on time (Table 4.3). These improvement strategies are designed to be continuous. Once changes have been realized, the improvement process should start again to make the system even better with each cycle. Eliminating non–value-added steps in any process reduces the possibility of error defects.
TABLE 4.3 Example of Yield at Given Performance (R): % of Data Reported Correctly
LEAN SIX SIGMA APPLICATIONS IN THE LABORATORY AND THE GREATER HEALTH CARE SYSTEM
The popularity of the combination of Lean and Six Sigma principles as an approach to quality management in health care has grown in the last 12 years. In 2004, there were two articles published describing specifically the application of Lean Six Sigma, according to a PubMed search utilizing the phrase “Lean Six Sigma.” This number has significantly risen since introduction of Lean and Six Sigma. Since 1997, there have been more than 300 publications on Six Sigma QI strategies alone in the health care field. Application of Lean and Six Sigma methodology at the Virginia Mason Medical Center showed numerous improvements to patient care.2 Table 4.4 highlights the major improvements achieved in Lean Six Sigma Quality Management. Prior to the adoption of Lean Six Sigma strategies, no laboratory result was reported (the time the result was available until mailing) within less than 3 days, and every physician had an average of 1,800 results waiting to be reported. After application of Lean methodology, 89% of the test results were reported in less than 3 days. Patient waiting time was significantly reduced for chemotherapy infusion time, clinic waiting time decreased by 50%, and discharge time decreased from 2.5 to 1.5 hours. All of these aspects for organizational improvement represent tangible metrics that can be measured and quantified by Lean Six Sigma tools. The results of the improvement process provide superior patient care, improve customer service, and positively impact patient satisfaction, which all contribute toward enhanced customer retention by the individual health care organization.
TABLE 4.4 Major Improvements Achieved from Lean Six Sigma Quality Management
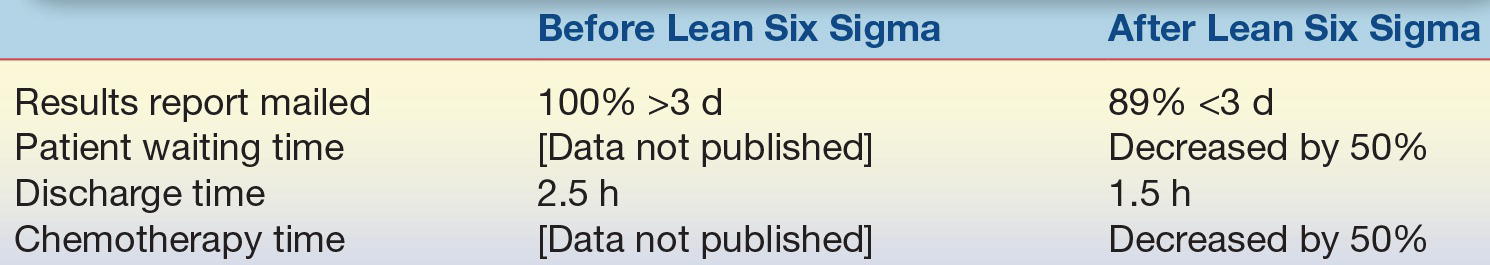
Source: Bush RW. Reducing waste in US health care systems. JAMA. 2007;297(8):871–874.
Stay updated, free articles. Join our Telegram channel

Full access? Get Clinical Tree


