(Eq. 8-1)
The binding between an Hp and the Ab obeys the law of mass action and is expressed mathematically in Equation 8-2:
 (Eq. 8-2)
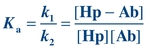
 Ka is the affinity or equilibrium constant and represents the reciprocal of the concentration of free Hp when 50% of the binding sites are occupied. The greater the affinity of the Hp for the Ab, the smaller is the concentration of Hp needed to saturate 50% of the binding sites of the Ab. For example, if the affinity constant of a monoclonal antibody (MAb) is 3 × 10¹¹ L/mol, it means that an Hp concentration of 3 × 10⁻¹¹ mol/L is needed to occupy half of the binding sites. Typically, the affinity constant of Abs used in immunoassay procedures ranges from 109 to 1011 L/mol, whereas the affinity constant for transport proteins ranges from 107 to 108 L/mol and the affinity for receptors ranges from 108 to 1011 L/mol.
As with all chemical (molecular) reactions, the initial concentrations of the reactants and the products affect the extent of complex binding. In immunoassays, the reaction moves forward (to the right) (Eq. 8-1) when the concentration of reactants (Ag and Ab) exceeds the concentration of the product (Ag–Ab complex) and when there is a favorable affinity constant.
The forces that bring an antigenic determinant and an Ab together are noncovalent, reversible bonds that result from the cumulative effects of hydrophobic, hydrophilic, and hydrogen bonding and van der Waals forces. The most important factor that affects the cumulative strength of bonding is the goodness (or closeness) of fit between the Ab and the Ag. The strength of most of these interactive forces is inversely related to the distance between the interactive sites. The closer the Ab and Ag can physically approach one another, the greater are the attractive forces.
After the Ag–Ab complex is formed, the likelihood of separation (which is inversely related to the tightness of bonding) is referred to as avidity. The avidity represents a value-added phenomenon in which the strength of binding of all Ab–epitope pairs exceeds the sum of single Ab–epitope binding. In general, the stronger the affinity and avidity, the greater is the possibility of cross-reactivity.
The specificity of an Ab is most often described by the Ag that induced the Ab production, the homologous Ag. Ideally, this Ab would react only with that Ag. However, an Ab can react with an Ag that is structurally similar to the homologous Ag; this is referred to as cross-reactivity. Considering that an antigenic determinant can be five or six amino acids or one immunodominant sugar, it is not surprising that Ag similarity is common. The greater the similarity between the cross-reacting Ag and the homologous Ag, the stronger is the bond with the Ab.2 Reagent Ab production is achieved by polyclonal or monoclonal techniques. In polyclonal Ab production, the stimulating Ag is injected in an animal responsive to the Ag; the animal detects this foreign Ag and mounts an immune response to eliminate the Ag. If part of this immune response includes strong Ab production, then blood is collected and Ab is harvested, characterized, and purified to yield the commercial antiserum reagent. This polyclonal Ab reagent is a mixture of Ab specificities. Some Abs react with the stimulating epitopes and some are endogenous to the host. Multiple Abs directed against the multiple epitopes on the Ag are present and can cross-link the multivalent Ag. Polyclonal Abs are often used as “capture” Abs in sandwich or indirect immunoassays.
In contrast, an immortal cell line produces monoclonal Abs; each line produces one specific Ab. This method developed as an extension of the hybridoma work published by Kohler and Milstein in 1975.3 The process begins by selecting cells with the qualities that will allow the synthesis of a homogeneous Ab. First, a host (commonly, a mouse) is immunized with an Ag (the one to which an Ab is desired); later, the sensitized lymphocytes of the spleen are harvested. Second, an immortal cell line (usually a nonsecretory mouse myeloma cell line that is hypoxanthine guanine phosphoribosyltransferase deficient) is required to ensure that continuous propagation in vitro is viable. These cells are then mixed in the presence of a fusion agent, such as polyethylene glycol, which promotes the fusion of two cells to form a hybridoma. In a selective growth medium, only the hybrid cells will survive. B cells have a limited natural life span in vitro and cannot survive, and the unfused myeloma cells cannot survive due to their enzyme deficiency. If the viable fused cells synthesize Ab, then the specificity and isotype of the Ab are evaluated. MAb reagent is commercially produced by growing the hybridoma in tissue culture or in compatible animals. An important feature of MAb reagent is that the Ab is homogeneous (a single Ab, not a mixture of Abs). Therefore, it recognizes only one epitope on a multivalent Ag and cannot cross-link a multivalent Ag.
Unlabeled Immunoassays
Immune Precipitation in Gel
In one of the simplest unlabeled immunoassays introduced into the clinical laboratory, unlabeled Ab was layered on top of unlabeled Ag (both in the fluid phase); during the incubation period, the Ab and Ag diffused and the presence of precipitation was recorded. The precipitation occurred because each Ab recognized an epitope and the multivalent Ags were cross-linked by multiple Abs. When the Ag–Ab complex is of sufficient size, the interaction with water is limited so that the complex becomes insoluble and precipitates.
It has been observed that if the concentration of Ag is increased while the concentration of Ab remains constant, the amount of precipitate formed is related to the ratio of Ab to Ag. As shown in Figure 8.1, there is an optimal ratio of the concentration of Ab to the concentration of Ag that results in the maximal precipitation; this is the zone of equivalence. If the amount of Ag exceeds the amount of Abs supplied by the test kit, cross-linking is decreased (Fig. 8.2), no precipitation is formed, and the assay is in prozone. Although originally described with precipitation reactions, this concept applies in particular to immunonephelometry for the measurement of specific proteins, in which the ratio of Ab to Ag is critical. For these types of calibration curves, a single signal from the reaction can be produced by two different Ag concentrations (see arrows of Fig. 8.1). Therefore, accurate results require dilution of the sample to move the result out of the prozone area and into the area of assay linearity.
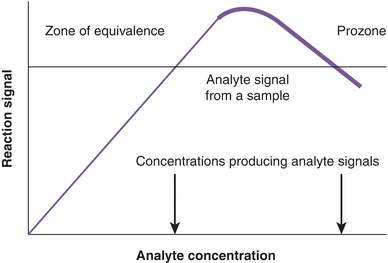
FIGURE 8.1 Precipitin curve showing the amount of precipitate versus antigen concentration. The concentration of the antibody (from the assay kit) is constant. Note that one signal can be produced by two different analyte concentrations (arrows). A similar curve is observed for the hook effect seen in two-site sandwich immunoassays.
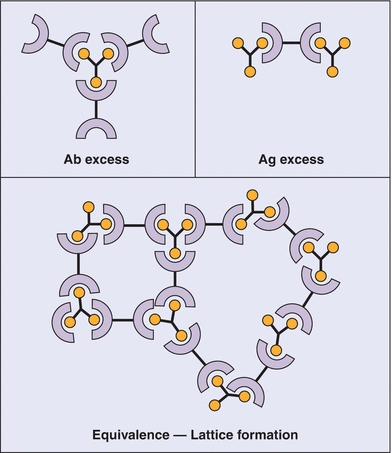
FIGURE 8.2 Antibody (Ab)–antigen (Ag) reactions. Top left: Ab excess condition. Top right: Ag excess condition. Both of these conditions lead to the formation of soluble complexes. Bottom: Bioequivalence leading to the formation of an insoluble “lattice” complex, detectable by immunonephelometry. (Used with permission from Immunology, Chapter 7, Immunoglobulins-antigen-Antibody Reactions. Microbiology and Immunology On-Line, University of South Carolina School of Medicine.)
Precipitation reactions in gel are not as commonly performed in the clinical laboratory today. Gel is dilute agarose (typically <1%) dissolved in an aqueous buffer. This provides a semisolid medium through which soluble Ag and Ab can easily pass. Precipitated immune complexes are easier to discern in gel versus a liquid suspension. Immune precipitation methods in gel can be classified as passive methods or those using electrophoresis and are summarized in Table 8.1. The simplest and least sensitive method is double diffusion (the Ouchterlony technique).4 Agarose is placed on a solid surface and allowed to solidify. Wells are cut into the agarose. A common template is six Ab wells, surrounding a single Ag well in the center. Soluble Ag and soluble Ab are added to separate wells and diffusion occurs. The intensity and pattern of the precipitation band are interpreted. As shown in Figure 8.3, the precipitin band of an unknown sample is compared with the precipitin band of a sample known to contain the Ab. A pattern of identity confirms the presence of the Ab in the unknown sample. Patterns of partial identity and nonidentity are ambiguous. This technique can be used to detect Abs associated with autoimmune diseases, such as Sm and ribonucleoprotein detected in systemic lupus erythematosus, SSA and SSB in Sjögren’s syndrome, and Scl-70 in progressive systemic sclerosis. However, most of these Abs are also detected using enzyme-linked immunoassays or multiplex bead array systems (e.g., Luminex Corp).
TABLE 8.1 Immune Precipitation Methods
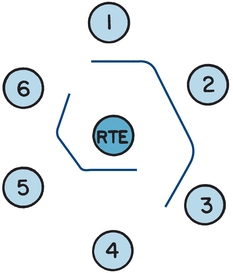
FIGURE 8.3 A schematic demonstrating the pattern of identity. The center well contains the antigen, rabbit thymus extract (RTE). Well 1 is filled with a serum known to contain Sm antibody. Test sera are in wells 2 and 3; the pattern of identity, the smooth continuous line between the three wells, confirms the presence of Sm antibody in the test sera. Well 4 is filled with a serum known to contain U1-ribonucleoprotein (RNP) antibody. Test sera in wells 5 and 6 also contain U1-RNP antibody, confirmed by the pattern of identity between the known serum and the test sera.
The single-diffusion technique, radial immunodiffusion (RID), is an immune precipitation method used to quantitate protein (the Ag). In this method, monospecific antiserum is added to the liquefied agarose; then, the agarose is poured into a plate and cooled. Wells are cut into the solidified agarose. Multiple standards, one or more quality control samples, and patient samples are added to the wells. The Ag diffuses from the well in all directions, binds to the soluble Ab in the agarose, and forms a complex seen as a concentric precipitin ring. The diameter of the ring is related to the concentration of the Ag that diffused from the well. A standard curve is constructed to determine the concentration in the quality control and patient samples. The usable analytic range is between the lowest and highest standards. If the ring is greater than the highest standard, the sample should be diluted and retested. If the ring is less than the lowest standard, the sample should be run on a low-level plate. Two variations exist: the endpoint (Mancini) method5 and the kinetic (Fahey-McKelvey) method.6 The endpoint method requires that all Ag diffuse from the well and the concentration of the Ag is related to the square of the diameter of the precipitin ring; the standard curve is plotted and a line of the best fit is computed. To ensure that all of the Ag has diffused, the incubation time is 48 to 72 hours, depending on the molecular weight of the Ag; for example, IgG quantitation requires 48 hours, and IgM requires 72 hours. In contrast, the kinetic method requires that all rings be measured at a fixed time of 18 hours; a sample with a greater concentration will diffuse at a faster rate and will be larger at a fixed time. The diameter of the precipitin ring is plotted against the Ag concentration on a logarithmic scale. For those performing RID, the endpoint method is favored because of its stability and indifference to temperature variations; however, turnaround time is longer compared with the kinetic method.
Counterimmunoelectrophoresis is an immune precipitation method that uses an electrical field to cause the Ag and Ab to migrate toward each other. Two parallel lines of wells are cut into agarose; Ab is placed in one line and Ag is placed in the other. Ab will migrate to the cathode and the Ag to the anode; a precipitin line forms where they meet. This qualitative test is useful to detect bacterial Ags in cerebrospinal fluid and other fluids when a rapid laboratory response is needed.
Immunoelectrophoresis (IEP) and immunofixation electrophoresis (IFE) are two methods used in the clinical laboratory to characterize monoclonal proteins in serum and urine. In 1964, Grabar and Burtin7 published methods for examining serum proteins using electrophoresis coupled with immunochemical reactions in agarose. Serum proteins are electrophoretically separated, and then, reagent Ab is placed in a trough running parallel to the separated proteins. The Ab reagent and separated serum proteins diffuse; when the reagent Ab recognizes the serum protein and the reaction is in the zone of equivalence, a precipitin arc is seen. The agarose plate is stained (typically, with a protein stain such as Amido black 10), destained, and dried to enhance the readability of precipitin arcs, especially weak arcs. The size, shape, density, and location of the arcs aid in the interpretation of the protein. All interpretation is made by comparing the arcs of the patient sample with the arcs of the quality control sample, a normal human serum. Because IEP is used to evaluate a monoclonal gammopathy, the heavy chain class and light chain type must be determined. To evaluate the most common monoclonal proteins, the following antisera are used: antihuman whole serum (which contains a mixture of Abs against the major serum proteins), antihuman IgG (γ-chain specific), antihuman IgM (μ-chain specific), antihuman IgA (α-chain specific), antihuman λ (λ-chain specific), and antihuman k (k-chain specific). The test turnaround time and the subtlety in interpretation have discouraged the use of IEP as the primary method to evaluate MAbs.
IFE has replaced IEP in essentially all clinical laboratories.8 A serum, urine, or cerebrospinal fluid sample is placed in all six lanes of an agarose gel and electrophoresed to separate the proteins. Cellulose acetate (or some other porous material) is saturated with Ab reagent and then applied to one lane of the separated protein. If the Ab reagent recognizes the protein, an insoluble complex is formed. After staining and drying of the agarose film, interpretation is based on the migration and appearance of bands. As shown in Figure 8.4, the monoclonal protein will appear as a discrete band (with both a heavy and a light chain monospecific antiserum occurring at the same position). Polyclonal proteins will appear as a diffuse band. The concentration of patient sample may need adjustment to ensure the reaction is in the zone of equivalence.
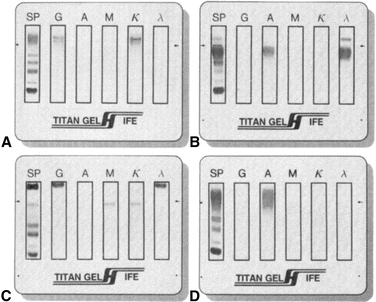
FIGURE 8.4 Immunofixation electrophoresis. (A) IgG k monoclonal immunoglobulin. (B) IgA λ monoclonal immunoglobulin with free λ light chains. (C) IgG λ and IgM k biclonal immunoglobulins. (D) Diffuse IgA heavy chain band without a corresponding light chain.
The rocket technique (Laurell technique, or electroimmunoassay) is also an immune precipitation method.9,10 In this quantitative technique, reagent Ab is mixed with agarose; Ag is placed in the well and electrophoresed. As the Ag moves through the agarose, it reacts with the reagent Ab and forms a “rocket,” with stronger precipitation along the edges. The height of the rocket is proportional to the concentration of Ag present; the concentration is determined based on a calibration curve. The narrow range of linearity may require dilution or concentration of the unknown sample.
Detection of Fluid-Phase Ag–Ab Complexes
A different strategy to quantitate Ag–Ab complexes is to use an instrument to detect the soluble Ag–Ab complexes as they interact with light. When Ag and Ab combine, complexes are formed that act as particles in suspension and thus can scatter light. The size of the particles determines the type of scatter that will dominate when the solution interacts with nearly monochromatic light.11 When the particle, such as albumin or IgG, is relatively small compared with the wavelength of incident light, the particle will scatter light symmetrically, both forward and backward. A minimum of scattered light is detectable at 90° from the incident light. Larger molecules and Ag–Ab complexes have diameters that approach the wavelength of incident light and scatter light with a greater intensity in the forward direction. The wavelength of light is selected based on its ability to be scattered in a forward direction and the ability of the Ag–Ab complexes to absorb the wavelength of light.
Turbidimetry measures the light transmitted and nephelometry measures the light scattered. Turbidimeters (spectrophotometers or colorimeters) are designed to measure the light passing through a solution so the photodetector is placed at an angle of 180° from the incident light. If light scattering is insignificant, turbidity can be expressed as “optical density,” which is directly related to the concentration of suspended particles and path length. Nephelometers measure light at an angle other than 180° from the incident light; most measure forward light scattered at less than 90° because the sensitivity is increased (see Chapter 5). The relative concentration of the Ab reagent and Ag is critical to ensure that the size of the complex generated is best detected by the nephelometer or turbidimeter and that the immune reaction is not in the prozone region. Therefore, it may be important to test more than one dilution of the patient sample, to monitor the presence of excess Ab, or to add additional antiserum and monitor the peak rate. Specific protein analyzers that use immunonephelometry as the detection scheme have automated sample dilution protocols in order to find an optimum Ag concentration to produce measurable precipitants.
For both turbidimetry and nephelometry, all reagents and sera must be free of particles that could scatter the light. Pretreatment of serum with polyethylene glycol, a nonionic, hydrophilic polymer, enhances the Ag–Ab interaction. Because the polymer is more hydrophilic than the Ag or Ab, water is attracted from the Ag and Ab to the polyethylene glycol. This results in a faster rate and greater quantity of Ag–Ab complex formation.
Both methods can be performed in an endpoint or a kinetic mode. In the endpoint mode, a measurement is taken at the beginning of the reaction (the background signal) and one is taken at a set time later in the reaction (plateau or endpoint signal); the concentration is determined using a calibration curve. In the kinetic mode, the rate of complex formation is continuously monitored and the peak rate is determined. The peak rate is directly related to the concentration of the Ag, although this is not necessarily linear. Thus, a calibration curve is required to determine concentration in unknown samples.
In general, turbidimetry is less sensitive of an analytical technique than nephelometry. In the former case, the decrease in the amount of light due to scattering is measured relative to the intensity of the reference blank, that is, no sample, equivalent to 100% transmittance. If the sample concentration of the analyte is high, a large precipitate is formed resulting in a significant decrease in the amount of light that can easily be measured by turbidimetry. If, however, the amount of precipitate is small due to a low sample concentration, the amount of light decreased is minimal and the instrument must measure the difference between two high-intensity light signals. Because in turbidimetry the amount of light is measured at an angle of 90°, the reference blank produces no signal (no light scattering). When a microprecipitate is formed, the light-scattered signal is more analytically discernible when measured against a dark reference baseline.
Labeled Immunoassays
General Considerations
In all labeled immunoassays, a reagent (Ag or Ab) is usually labeled by attaching a particle or molecule that will better detect lower concentrations of Ag–Ab complexes. Therefore, the label improves analytic sensitivity. All assays have a binding reagent, which can bind to the Ag or ligand. If the binding reagent is an Ab, the assay is an immunoassay. If the binding agent is a receptor (e.g., estrogen or progesterone receptor), the assay is a receptor assay. If the binding reagent is a transport protein (e.g., thyroxine-binding globulin or transcortin), the assay may be called competitive protein-binding assay. Immunoassays are used today almost exclusively, with two notable exceptions: estrogen and progesterone receptor assays and the thyroid hormone–binding ratio, which uses thyroxine-binding globulin.
Immunoassays may be described based on the label—which reactant is labeled, the relative concentration and source of the Ab, the method used to separate free from bound labeled reagents, the signal that is measured, and the method used to assign the concentration of the analyte in the sample. Immunoassay design, therefore, has many variables to consider, leading to diverse assays.
Labels
The simplest way to identify an assay is by the label used. Table 8.2 lists the commonly used labels and the methods used to detect the label.
TABLE 8.2 Labels and Detection Methods
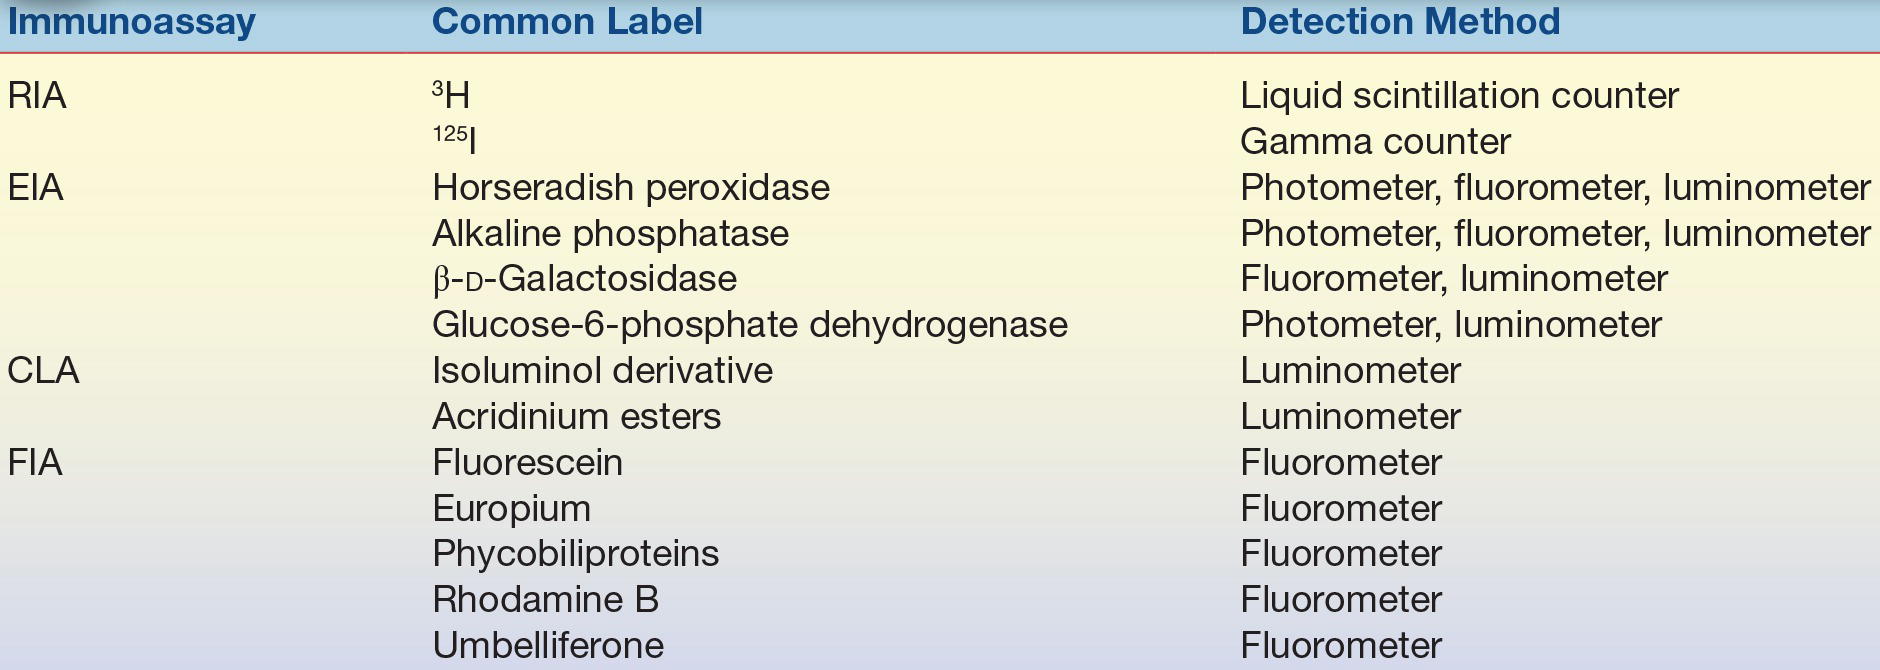
CLA, chemiluminescent assay; EIA, enzyme immunoassay; FIA, fluorescent immunoassay; RIA, radioimmunoassay.
Radioactive Labels
The original immunoassays made use of radionuclides, and atoms with unstable nuclei that spontaneously emit radiation are radioactive and referred to as radionuclides. These have largely been replaced by nonisotopic labels. Therefore, the discussion of radiolabels has been omitted in this edition of Clinical Chemistry. The reader is referred to previous version of this text for historic information of radioactive labels.
Enzyme Labels
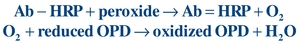
Enzymes are commonly used to label the Ag/Hp or Ab.12,13 Horseradish peroxidase (HRP), alkaline phosphatase (ALP), and glucose-7-phosphate dehydrogenase are used most often. Enzymes are biologic catalysts that increase the rate of conversion of substrate to product and are not consumed by the reaction. As such, an enzyme can catalyze many substrate molecules, amplifying the amount of product generated. The enzyme activity may be monitored directly by measuring the product formed or by measuring the effect of the product on a coupled reaction. Depending on the substrate used, the product can be photometric, fluorometric, or chemiluminescent. For example, a typical photometric reaction using HRP-labeled Ab (Ab-HRP) and the substrate (a peroxide) generates the product (oxygen). The oxygen can then oxidize a reduced chromogen (reduced orthophenylenediamine [OPD]) to produce a colored compound (oxidized OPD), which is measured using a photometer:
 (Eq. 8-3)
 Fluorescent Labels
Fluorescent labels (fluorochromes or fluorophores) are compounds that absorb radiant energy of one wavelength and emit radiant energy of a longer wavelength in less than 10−4 seconds. Generally, the emitted light is detected at an angle of 90° from the path of excitation light using a fluorometer or a modified spectrophotometer. The difference between the excitation wavelength and emission wavelength (Stokes shift) usually ranges between 20 and 80 nm for most fluorochromes. Some fluorescence immunoassays simply substitute a fluorescent label (such as fluorescein) for an enzyme label and quantitate the fluorescence.14 Another approach, time-resolved fluorescence immunoassay, uses a highly efficient fluorescent label, such as europium chelate,15 which fluoresces approximately 1,000 times slower than the natural background fluorescence and has a wide Stokes shift. The delay allows the fluorescent label to be detected with minimal interference from background fluorescence. The long Stokes shift facilitates measurement of emission radiation while excluding the excitation radiation. The resulting assay is highly sensitive and time resolved, with minimized background fluorescence.
Luminescent Labels
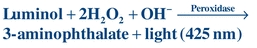
Luminescent labels emit a photon of light as the result of an electrical, biochemical, or chemical reaction.16,17 Some organic compounds become excited when oxidized and emit light as they revert to the ground state. Oxidants include hydrogen peroxide, hypochlorite, or oxygen. Sometimes, a catalyst is needed, such as peroxidase, ALP, or metal ions.
Luminol, the first chemiluminescent label used in immunoassays, is a cyclic diacylhydrazide that emits light energy under alkaline conditions in the presence of peroxide and peroxidase. Because peroxidase can serve as the catalyst, assays may use this enzyme as the label; the chemiluminogenic substrate, luminol, will produce light that is directly proportional to the amount of peroxidase present (Eq. 8-4):
 (Eq. 8-4)
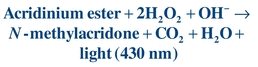
 A popular chemiluminescent label, acridinium esters, is a triple-ringed organic molecule linked by an ester bond to an organic chain. In the presence of hydrogen peroxide and under alkaline conditions, the ester bond is broken and an unstable molecule (N-methylacridone) remains. Light is emitted as the unstable molecule reverts to its more stable ground state:
 (Eq. 8-5)
 ALP commonly conjugated to an Ab has been used in automated immunoassay analyzers to produce some of the most sensitive chemiluminescent assays. ALP catalyzes adamantyl 1,2-dioxetane aryl phosphate substrates to release light at 477 nm. The detection limit approaches 1 zmol, or approximately 602 enzyme molecules.18,19
Assay Design
Competitive Immunoassays
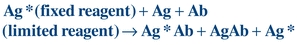
The earliest immunoassay was a competitive immunoassay in which the radiolabeled Ag (A*; also called the tracer) competed with unlabeled Ag for a limited number of binding sites (Ab) (Fig. 8.5). The proportion of Ag and Ag* binding with the Ab is related to the Ag and Ag* concentration and requires limited Ab in the reaction. In the competitive assay, the Ag* concentration is constant and limited. As the concentration of Ag increases, more binds to the Ab, resulting in less binding of Ag*. These limited reagent assays were very sensitive because low concentrations of unlabeled Ag yielded a large measurable signal from the bound labeled Ag. If the competitive assay is designed to reach equilibrium, the incubation times are often long.
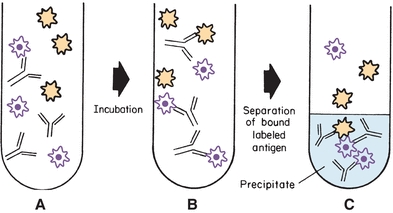
FIGURE 8.5 Competitive labeled immunoassay. During simultaneous incubation, labeled antigen and unlabeled antigen compete for the antibody-binding sites. The bound label in the precipitate is frequently measured.
The Ag–Ab reaction can be accomplished in one step when labeled antigen (Ag*), unlabeled antigen (Ag), and reagent antibody (Ab) are simultaneously incubated together to yield bound labeled antigen (Ag*Ab), bound unlabeled antigen (AgAb), and free label (Ag*), as shown in Figure 8.5 and Equation 8-6:
 (Eq. 8-6)
 A generic, heterogeneous, competitive simultaneous assay begins by pipetting the test sample (quality control, calibrator, or patient) into test tubes. Next, labeled Ag and Ab reagents are added. After incubation and separation of free labeled (unbound) Ag, the bound labeled Ag is measured.
Alternatively, the competitive assay may be accomplished in sequential steps. First, labeled Ag is incubated with the reagent Ab and then labeled Ag is added. After a longer incubation time and a separation step, the bound labeled Ag is measured. This approach increases the analytic sensitivity of the assay.
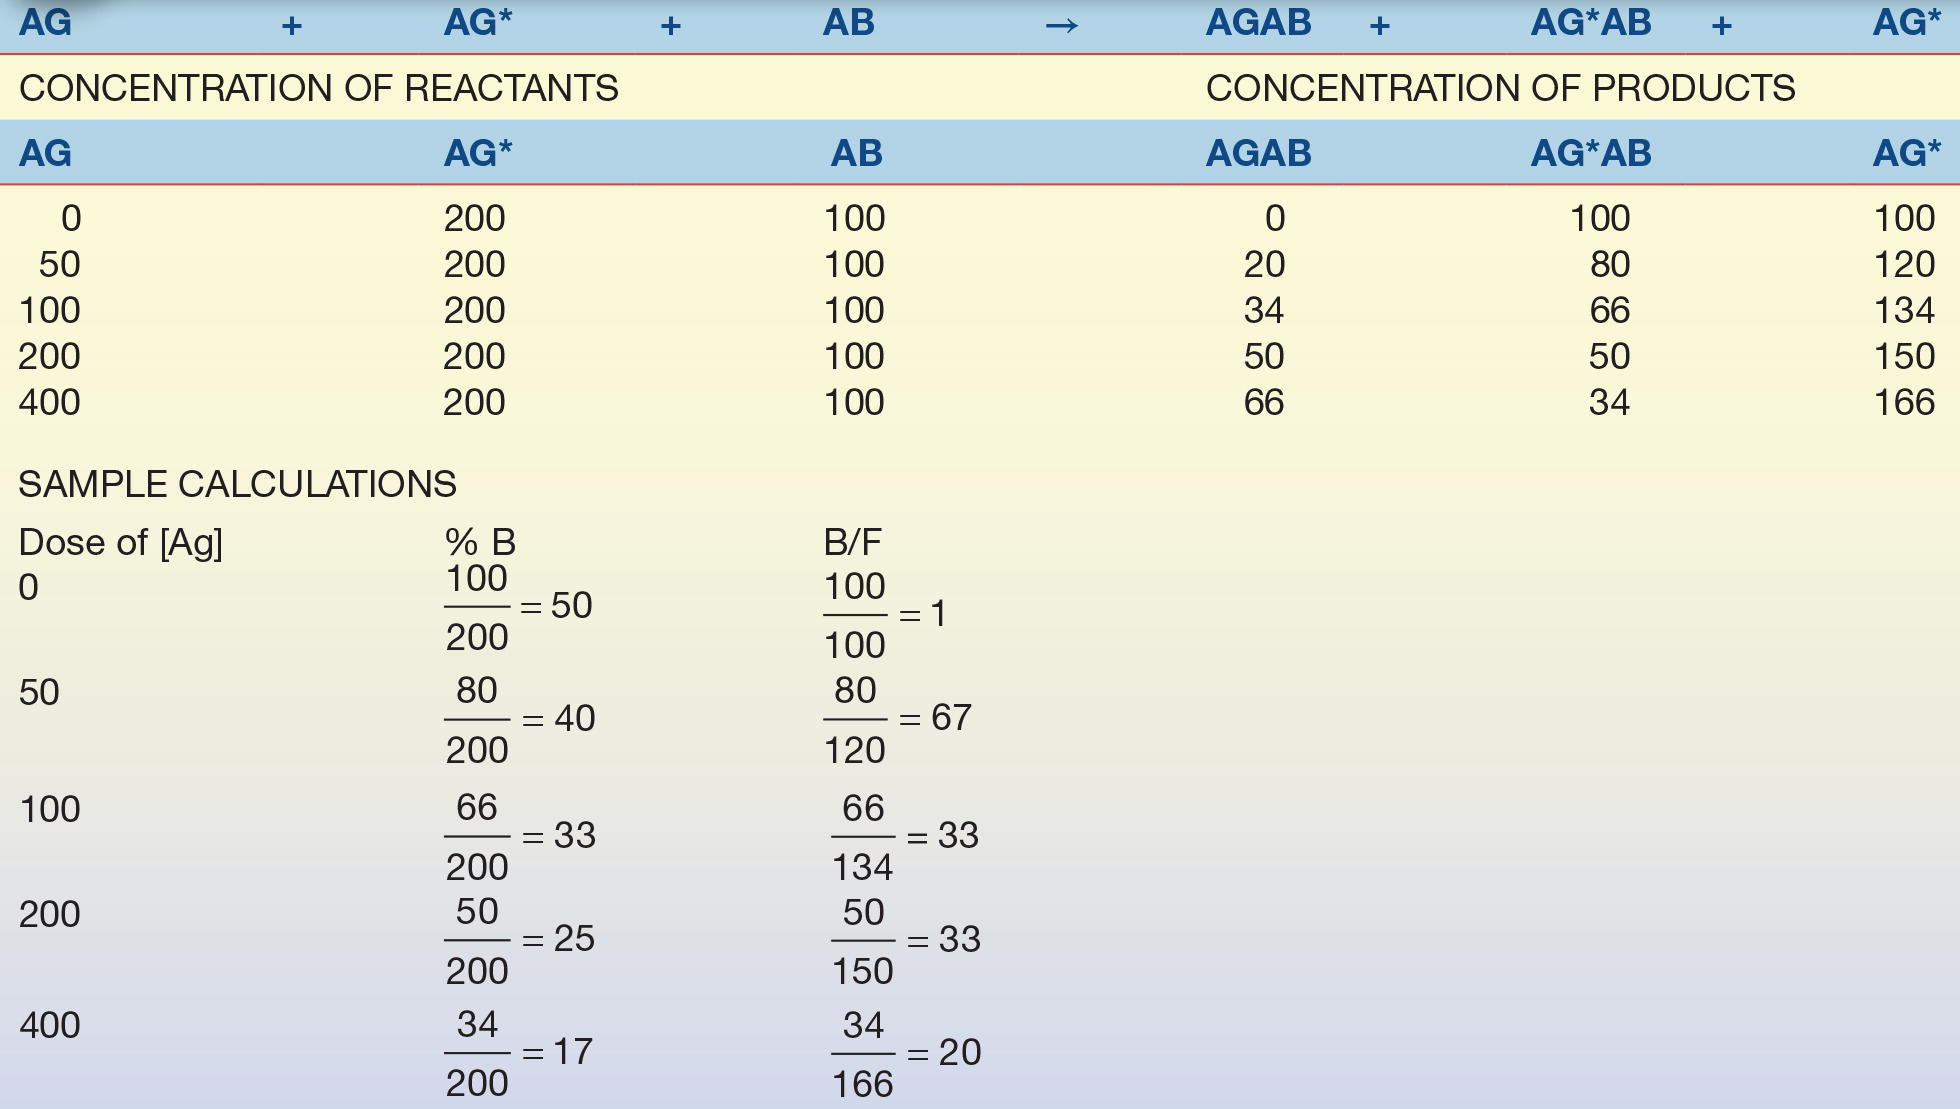
Consider the example in Table 8.3. A relatively small, yet constant, number of Ab combining sites is available to combine with a relatively large, constant amount of Ag* (tracer) and calibrators with known Ag concentrations. Because the amount of tracer and Ab is constant, the only variable in the test system is the amount of unlabeled Ag. As the concentration of unlabeled Ag increases, the concentration (or percentage) of free tracer increases.
TABLE 8.3 Competitive Binding Assay Example
Stay updated, free articles. Join our Telegram channel

Full access? Get Clinical Tree


