(Eq. 5-1)
where h is a constant (6.62 × 10⁻²⁷ erg sec), known as Planck constant, and v is frequency. Because the frequency of a wave is inversely proportional to the wavelength, it follows that the energy of electromagnetic radiation is inversely proportional to wavelength. Figure 5.1A shows this relationship. Electromagnetic radiation includes a spectrum of energy from short-wavelength, highly energetic gamma rays and x-rays on the left in Figure 5.1B to long-wavelength radiofrequencies on the right. Visible light falls in between, with the color violet at 400 nm and red at 700 nm wavelengths being the approximate limits of the visible spectrum.
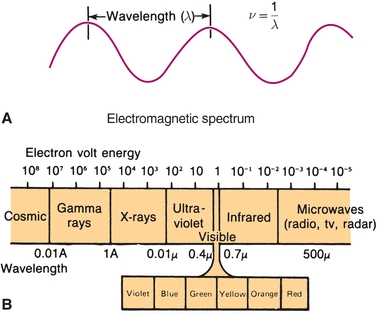
FIGURE 5.1 Electromagnetic radiation—relationship of energy and wavelength.
The instruments discussed in this section measure either absorption or emission of radiant energy to determine the concentration of atoms or molecules. The two phenomena, absorption and emission, are closely related. For a ray of electromagnetic radiation to be absorbed, it must have the same frequency as a rotational or vibrational frequency in the atom or molecule that it strikes. Levels of energy that are absorbed move in discrete steps, and any particular type of molecule or atom will absorb only certain energies and not others. When energy is absorbed, valence electrons move to an orbital with a higher energy level. Following energy absorption, the excited electron will fall back to the ground state by emitting a discrete amount of energy in the form of a characteristic wavelength of radiant energy.
Absorption or emission of energy by atoms results in a line spectrum. Because of the relative complexity of molecules, they absorb or emit a bank of energy over a large region. Light emitted by incandescent solids (tungsten or deuterium) is in a continuum. The three types of spectra are shown in Figure 5.2.1, 2, 3
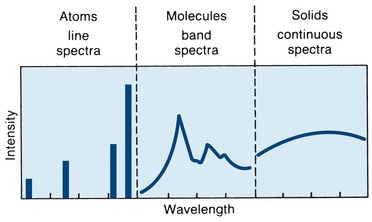
FIGURE 5.2 Characteristic absorption or emission spectra. (Adapted from Coiner D. Basic Concepts in Laboratory Instrumentation. Bethesda, MD: ASMT Education and Research Fund; 1975-1979.)
Beer Law
The relationship between absorption of light by a solution and the concentration of that solution has been described by Beer and others. Beer law states that the concentration of a substance is directly proportional to the amount of light absorbed or inversely proportional to the logarithm of the transmitted light. Percent transmittance (%T) and absorbance (A) are related photometric terms that are explained in this section.
Figure 5.3A shows a beam of monochromatic light entering a solution. Some of the light is absorbed. The remainder passes through, strikes a light detector, and is converted to an electric signal. Percent transmittance is the ratio of the radiant energy transmitted (T) divided by the radiant energy incident on the sample (I). All light absorbed or blocked results in 0% T. A level of 100% T is obtained if no light is absorbed. In practice, the solvent without the constituent of interest is placed in the light path, as in Figure 5.3B. Most of the light is transmitted, but a small amount is absorbed by the solvent and cuvette or is reflected away from the detector. The electrical readout of the instrument is set arbitrarily at 100% T, while the light is passing through a “blank” or reference. The sample containing absorbing molecules to be measured is placed in the light path. The difference in amount of light transmitted by the blank and that transmitted by the sample is due only to the presence of the compound being measured. The %T measured by commercial spectrophotometers is the ratio of the sample transmitted beam divided by the blank transmitted beam.
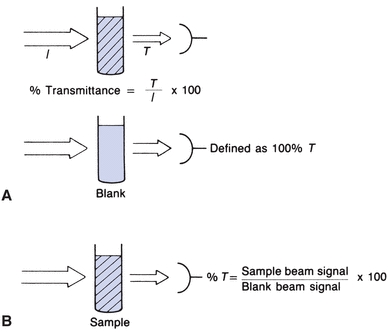
FIGURE 5.3 Percent transmittance (%T) defined.
Equal thicknesses of an absorbing material will absorb a constant fraction of the energy incident upon the layers. For example, in a tube containing layers of solution (Fig. 5.4A), the first layer transmits 70% of the light incident upon it. The second layer will, in turn, transmit 70% of the light incident upon it. Thus, 70% of 70% (49%) is transmitted by the second layer. The third layer transmits 70% of 49%, or 34% of the original light. Continuing on, successive layers transmit 24% and 17%, respectively. The %T values, when plotted on linear graph paper, yield the curve shown in Figure 5.4B. Considering each equal layer as many monomolecular layers, we can translate layers of material to concentration. If semilog graph paper is used to plot the same figures, a straight line is obtained (Fig. 5.4C), indicating that, as concentration increases, %T decreases in a logarithmic manner.
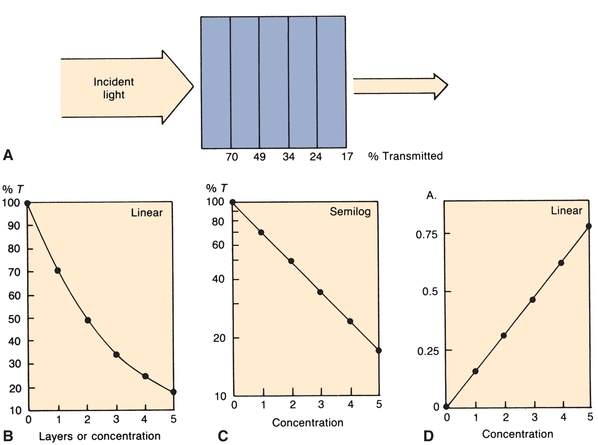
FIGURE 5.4 (A) Percent of original incident light transmitted by equal layers of light-absorbing solution. (B) Percent T versus concentration on linear graph paper. (C) Percent T versus concentration on semilog graph paper. (D)A versus concentration on linear graph paper.
Absorbance A is the amount of light absorbed. It cannot be measured directly by a spectrophotometer but rather is mathematically derived from %T as follows:
 (Eq. 5-2)
 where I0 is the incident light and I is the transmitted light.
Absorbance is defined as follows:
 (Eq. 5-3)
 According to Beer law, absorbance is directly proportional to concentration (Fig. 5.4D):
 (Eq. 5-4)
 where ε = molar absorptivity, the fraction of a specific wavelength of light absorbed by a given type of molecule; b is the length of light path through the solution; and c is the concentration of absorbing molecules.
Absorptivity depends on the molecular structure and the way in which the absorbing molecules react with different energies. For any particular molecular type, absorptivity changes as wavelength of radiation changes. The amount of light absorbed at a particular wavelength depends on the molecular and ion types present and may vary with concentration, pH, or temperature.
Because the path length and molar absorptivity are constant for a given wavelength,
 (Eq. 5-5)
 Unknown concentrations are determined from a calibration curve that plots absorbance at a specific wavelength versus concentration for standards of known concentration. For calibration curves that are linear and have a zero y-intercept, unknown concentrations can be determined from a single calibrator. Not all calibration curves result in straight lines. Deviations from linearity are typically observed at high absorbances. The stray light within an instrument will ultimately limit the maximum absorbance that a spectrophotometer can achieve, typically 2.0 absorbance units.
Spectrophotometric Instruments
A spectrophotometer is used to measure the light transmitted by a solution to determine the concentration of the light-absorbing substance in the solution. Figure 5.5 illustrates the basic components of a single-beam spectrophotometer, which are described in subsequent sections.
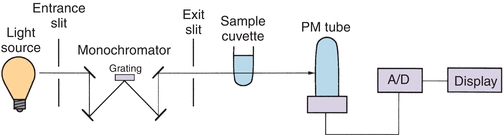
FIGURE 5.5 Single-beam spectrophotometer.
Components of a Spectrophotometer
Light Source
The most common source of light for work in the visible and near-infrared regions is the incandescent tungsten or tungsten-iodide lamp. Only about 15% of radiant energy emitted falls in the visible region, with most emitted as near-infrared.1, 2, 3 Often, a heat-absorbing filter is inserted between the lamp and the sample to absorb the infrared radiation.
The lamps most commonly used for ultraviolet (UV) work are the deuterium discharge lamp and the mercury arc lamp. Deuterium provides continuous emission down to 165 nm. Low-pressure mercury lamps emit a sharp line spectrum, with both UV and visible lines. Medium and high-pressure mercury lamps emit a continuum from UV to the mid-visible region. The most important factors for a light source are range, spectral distribution within the range, the source of radiant production, stability of the radiant energy, and temperature.
Monochromators
Isolation of individual wavelengths of light is an important and necessary function of a monochromator. The degree of wavelength isolation is a function of the type of device used and the width of entrance and exit slits. The bandpass of a monochromator defines the range of wavelengths transmitted and is calculated as width at half the maximum transmittance.
Numerous devices are used for obtaining monochromatic light. The least expensive are colored glass filters. These filters usually pass a relatively wide band of radiant energy and have a low transmittance of the selected wavelength. Although not precise, they are simple and inexpensive.
Interference filters produce monochromatic light based on the principle of constructive interference of waves. Two pieces of glass, each mirrored on one side, are separated by a transparent spacer that is precisely one-half the desired wavelength. Light waves enter one side of the filter and are reflected at the second surface. Wavelengths that are twice the space between the two glass surfaces will reflect back and forth, reinforcing others of the same wavelengths and finally passing on through. Other wavelengths will cancel out because of phase differences (destructive interference). Because interference filters also transmit multiples of the desired wavelengths, they require accessory filters to eliminate these harmonic wavelengths. Interference filters can be constructed to pass a very narrow range of wavelengths with good efficiency.
The simple glass prism is another type of monochromator. A narrow beam of light focused on a prism is refracted as it enters the denser glass. Short wavelengths are refracted more than long wavelengths, resulting in dispersion of white light into a continuous spectrum. The prism can be rotated, allowing only the desired wavelength to pass through an exit slit.
Diffraction gratings are most commonly used as monochromators. A diffraction grating consists of many parallel grooves (15,000 or 30,000 per inch) etched onto a polished surface. Diffraction, the separation of light into component wavelengths, is based on the principle that wavelengths bend as they pass a sharp corner. The degree of bending depends on the wavelength. As the wavelengths move past the corners, wave fronts are formed. Those that are in phase reinforce one another, whereas those not in phase cancel out and disappear. This results in complete spectra. Gratings with very fine line rulings produce a widely dispersed spectrum. They produce linear spectra, called orders, in both directions from the entrance slit. Because the multiple spectra have a tendency to cause stray light problems, accessory filters are used.
Sample Cell
The next component of the basic spectrophotometer is the sample cell or cuvette, which typically has a flat surface. The light path must be kept constant to have absorbance proportional to concentration. This is easily checked by preparing a colored solution to read midscale when using the wavelength of maximum absorption. Each cuvette to be tested is filled, readings are taken, and results are compared against an acceptable tolerance (e.g., ±0.25% T). Cuvettes are sold in matched sets. Square cuvettes have plane-parallel optical surfaces and a constant light path. Cuvettes with scratched optical surfaces scatter light and should be discarded. Inexpensive glass cuvettes can be used for applications in the visible range, but they absorb light in the UV region. Quartz cuvettes enable transmission of light and are used when substances absorb in this region (e.g., NADH at 340 nm).
Photodetectors
The purpose of the detector is to convert the transmitted radiant energy into an equivalent amount of electrical energy. The least expensive of the devices is known as a barrier-layer cell, or photocell. The photocell is composed of a film of light-sensitive material, frequently selenium, on a plate of iron. Over the light-sensitive material is a thin, transparent layer of silver. When exposed to light, electrons in the light-sensitive material are excited and released to flow to the highly conductive silver. In comparison with the silver, a moderate resistance opposes the electron flow toward the iron, forming a hypothetical barrier to flow in that direction. Consequently, this cell generates its own electromotive force, which can be measured. The produced current is proportional to the incident radiation. Photocells require no external voltage source but rely on internal electron transfer to produce a current in an external circuit. Because of their low internal resistance, the output of electrical energy is not easily amplified. Consequently, this type of detector is used mainly in filter photometers with a wide bandpass, producing a fairly high level of illumination so that there is no need to amplify the signal. The photocell is inexpensive and durable; however, it is temperature sensitive and nonlinear at very low and very high levels of illumination.
A phototube (Fig. 5.6) is similar to a barrier-layer cell in that it has photosensitive material that gives off electrons when light energy strikes it. It differs in that an outside voltage is required for operation. Phototubes contain a negatively charged cathode and a positively charged anode enclosed in a glass case. The cathode is composed of a material (e.g., rubidium or lithium) that acts as a resistor in the dark but emits electrons when exposed to light. The emitted electrons jump over to the positively charged anode, where they are collected and return through an external, measurable circuit. The cathode usually has a large surface area. Varying the cathode material changes the wavelength at which the phototube gives its highest response. The photocurrent is linear, with the intensity of the light striking the cathode as long as the voltage between the cathode and the anode remains constant. A vacuum within the tubes avoids scattering of the photoelectrons by collision with gas molecules.
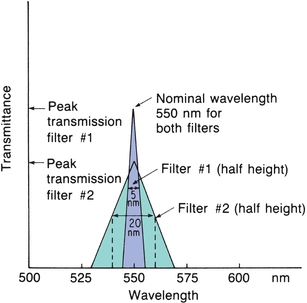
FIGURE 5.6 Phototube drawing and schematic.
The third major type of light detector is the photomultiplier (PM) tube, which detects and amplifies radiant energy. As shown in Figure 5.7, incident light strikes the coated cathode, emitting electrons. The electrons are attracted to a series of anodes, known as dynodes, each having a successively higher positive voltage. These dynodes are of a material that gives off many secondary electrons when hit by single electrons. Initial electron emission at the cathode triggers a multiple cascade of electrons within the PM tube itself. Because of this amplification, the PM tube is 200 times more sensitive than the phototube. PM tubes are used in instruments designed to be extremely sensitive to very low light levels and light flashes of very short duration. The accumulation of electrons striking the anode produces a current signal, measured in amperes, that is proportional to the initial intensity of the light. The analog signal is converted first to a voltage and then to a digital signal through the use of an analog-to-digital converter. Digital signals are processed electronically to produce absorbance readings.
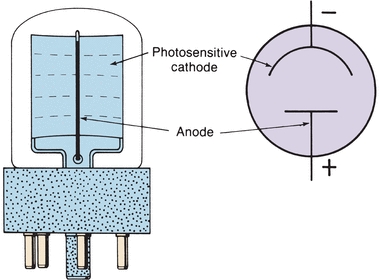
FIGURE 5.7 Dynode chain in a photomultiplier.
In a photodiode, absorption of radiant energy by a reverse-biased pn-junction diode (pn, positive–negative) produces a photocurrent that is proportional to the incident radiant power. Although photodiodes are not as sensitive as PM tubes because of the lack of internal amplification, their excellent linearity (six to seven decades of radiant power), speed, and small size make them useful in applications where light levels are adequate.4 Photodiode array (PDA) detectors are available in integrated circuits containing 256 to 2,048 photodiodes in a linear arrangement. A linear array is shown in Figure 5.8. Each photodiode responds to a specific wavelength, and as a result, a complete UV/visible spectrum can be obtained in less than 1 second. Resolution is 1 to 2 nm and depends on the number of discrete elements. In spectrophotometers using PDA detectors, the grating is positioned after the sample cuvette and disperses the transmitted radiation onto the PDA detector (Fig. 5.8).
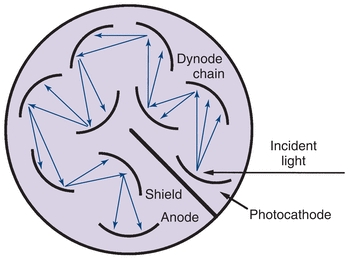
FIGURE 5.8 Photodiode array spectrophotometer illustrating the placement of the sample cuvette before the monochromator.
For single-beam spectrophotometers, the absorbance reading from the sample must be blanked using an appropriate reference solution that does not contain the compound of interest. Double-beam spectrophotometers permit automatic correction of sample and reference absorbance, as shown in Figure 5.9. Because the intensities of light sources vary as a function of wavelength, double-beam spectrophotometers are necessary when the absorption spectrum for a sample is to be obtained. Computerized, continuous zeroing, single-beam spectrophotometers have replaced most double-beam spectrophotometers.
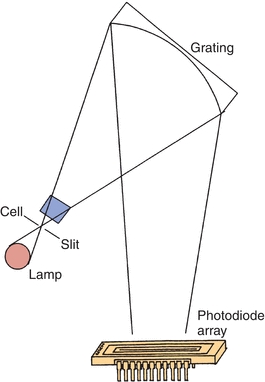
FIGURE 5.9 Double-beam spectrophotometer.
Spectrophotometer Quality Assurance
Performing at least the following checks should validate instrument function: wavelength accuracy, stray light, and linearity. Wavelength accuracy means that the wavelength indicated on the control dial is the actual wavelength of light passed by the monochromator. It is most commonly checked using standard absorbing solutions or filters with absorbance maxima of known wavelength. Didymium or holmium oxide in glass is stable and frequently used as filters. The filter is placed in the light path, and the wavelength control is set at the wavelength at which maximal absorbance is expected. The wavelength control is then rotated in either direction to locate the actual wavelength that has maximal absorbance. If these two wavelengths do not match, the optics must be adjusted to calibrate the monochromator correctly.
Some instruments with narrow bandpass use a mercury vapor lamp to verify wavelength accuracy. The mercury lamp is substituted for the usual light source, and the spectrum is scanned to locate mercury emission lines. The wavelength indicated on the control is compared with known mercury emission peaks to determine the accuracy of the wavelength indicator control.
Stray light refers to any wavelengths outside the band transmitted by the monochromator. Figure 5.10 shows the performance of a spectrophotometer to measure high absorbance in the presence of stray light. The most common causes of stray light are reflection of light from scratches on optical surfaces or from dust particles anywhere in the light path and higher order spectra produced by diffraction gratings. The major effect is absorbance error, especially in the high absorbance range. Stray light is detected by using cutoff filters, which eliminate all radiation at wavelengths beyond the one of interest. To check for stray light in the near-UV region, for example, a filter that does not transmit in the region of 200 to 400 nm is inserted. If the instrument reading is greater than 0% T, stray light is present. Certain liquids, such as NiSO4, NaNO2, and acetone, absorb strongly at short wavelengths and can be used to detect stray light in the UV range.
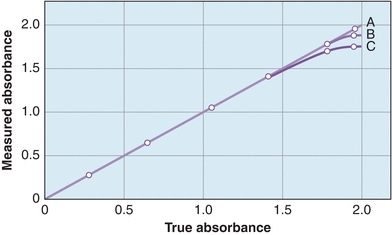
FIGURE 5.10 Spectrophotometer’s ability to measure high absorbance with stray light. (A) No stray light, with no deviation from the actual absorbance. (B) Some stray light within the instrument showing deviations from the actual at high absorbance. (C)A higher degree of stray light showing further deviation from the actual absorbance.
Linearity is demonstrated when a change in concentration results in a straight line calibration curve, as discussed under Beer law. Colored solutions may be carefully diluted and used to check linearity, using the wavelength of maximal absorbance for that color. Sealed sets of different colors and concentrations are available commercially. They should be labeled with expected absorbance for a given bandpass instrument. Less than expected absorbance is an indication of stray light or of a bandpass that is wider than specified. Sets of neutral-density filters to check linearity over a range of wavelengths are also commercially available.
Atomic Absorption Spectrophotometer
The atomic absorption spectrophotometer is used to measure concentration by detecting the absorption of electromagnetic radiation by atoms rather than by molecules. The basic components are shown in Figure 5.11. The usual light source, known as a hollow-cathode lamp, consists of an evacuated gas-tight chamber containing an anode, a cylindrical cathode, and an inert gas, such as helium or argon. When voltage is applied, the filler gas is ionized. Ions attracted to the cathode collide with the metal, knock atoms off, and cause the metal atoms to be excited. When they return to the ground state, light energy is emitted that is characteristic of the metal in the cathode. Generally, a separate lamp is required for each metal (e.g., a copper hollow-cathode lamp is used to measure this metal).
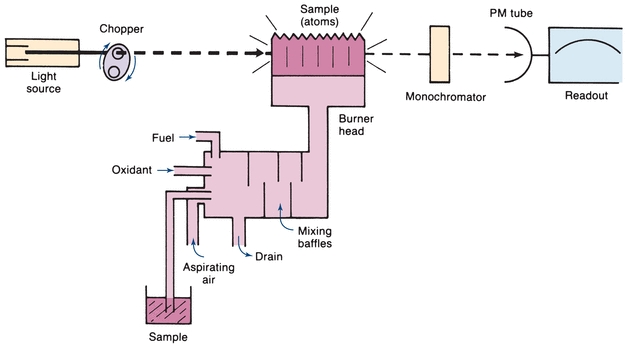
FIGURE 5.11 Single-beam atomic absorption spectrophotometer—basic components.
Electrodeless discharge lamps are a relatively new light source for atomic absorption spectrophotometers. A bulb is filled with argon and the element to be tested. A radiofrequency generator around the bulb supplies the energy to excite the element, causing a characteristic emission spectrum of the element.
The analyzed sample must contain the reduced metal in the atomic vaporized state. Commonly, this is done by using the heat of a flame to break the chemical bonds and form free, unexcited atoms. The flame is the sample cell in this instrument, rather than a cuvette. There are various designs; however, the most common burner is the premix long-path burner. The sample, in solution, is aspirated as a spray into a chamber, where it is mixed with air and fuel. This mixture passes through baffles, where large drops fall and are drained off. Only fine droplets reach the flame. The burner is a long, narrow slit, to permit a longer path length for absorption of incident radiation. Light from the hollow-cathode lamp passes through the sample of ground state atoms in the flame. The amount of light absorbed is proportional to the concentration. When a ground state atom absorbs light energy, an excited atom is produced. The excited atom then returns to the ground state, emitting light of the same energy as it absorbed. The flame sample thus contains a dynamic population of ground state and excited atoms, both absorbing and emitting radiant energy. The emitted energy from the flame will go in all directions, and it will be a steady emission. Because the purpose of the instrument is to measure the amount of light absorbed, the light detector must be able to distinguish between the light beam emitted by the hollow-cathode lamp and that emitted by excited atoms in the flame. To do this, the hollow-cathode light beam is modulated by inserting a mechanical rotating chopper between the light and the flame or by pulsing the electric supply to the lamp. Because the light beam being absorbed enters the sample in pulses, the transmitted light will also be in pulses. There will be less light in the transmitted pulses because part of it will be absorbed. There are, therefore, two light signals from the flame—an alternating signal from the hollow-cathode lamp and a direct signal from the flame emission. The measuring circuit is tuned to the modulated frequency. Interference from the constant flame emission is electronically eliminated by accepting only the pulsed signal from the hollow cathode.
The monochromator is used to isolate the desired emission line from other lamp emission lines. In addition, it serves to protect the photodetector from excessive light emanating from flame emissions. A PM tube is the usual light detector.
Flameless atomic absorption requires an instrument modification that uses an electric furnace to break chemical bonds (electrothermal atomization). A tiny graphite cylinder holds the sample, either liquid or solid. An electric current passes through the cylinder walls, evaporates the solvent, ashes the sample, and, finally, heats the unit to incandescence to atomize the sample. This instrument, like the spectrophotometer, is used to determine the amount of light absorbed. Again, Beer law is used for calculating concentration. A major problem is that background correction is considerably more necessary and critical for electrothermal techniques than for flame-based atomic absorption methods. Currently, the most common approach uses a deuterium lamp as a secondary source and measures the difference between the two absorbance signals. However, there has also been extensive development of background correction techniques based on the Zeeman effect.1 The presence of an intense static magnetic field will cause the wavelength of the emitted radiation to split into several components. This shift in wavelength is the Zeeman effect.
Atomic absorption spectrophotometry is sensitive and precise. It is routinely used to measure concentration of trace metals that are not easily excited. It is generally more sensitive than flame emission because the vast majority of atoms produced in the usual propane or air-acetylene flame remain in the ground state available for light absorption. It is accurate, precise, and specific. One disadvantage, however, is the inability of the flame to dissociate samples into free atoms. For example, phosphate may interfere with calcium analysis by formation of calcium phosphate. This may be overcome by adding cations that compete with calcium for phosphate. Routinely, lanthanum or strontium is added to samples to form stable complexes with phosphate. Another possible problem is the ionization of atoms following dissociation by the flame, which can be decreased by reducing the flame temperature. Matrix interference, due to the enhancement of light absorption by atoms in organic solvents or formation of solid droplets as the solvent evaporates in the flame, can be another source of error. This interference may be overcome by pretreatment of the sample by extraction.5
Recently, inductively coupled plasma (ICP) has been used to increase sensitivity for atomic emission. The torch, an argon plasma maintained by the interaction of a radiofrequency field and an ionized argon gas, is reported to have used temperatures between 5,500 and 8,000 K. Complete atomization of elements is thought to occur at these temperatures. Use of ICP as a source is recommended for determinations involving refractory elements such as uranium, zirconium, and boron. ICP with MS detection is the most sensitive and specific assay technique for all elements on the periodic chart. Atomic absorption spectrophotometry is used less frequently because of this newer technology.
Flame Photometry
The flame emission photometer, which measures light emitted by excited atoms, was widely used to determine concentration of Na+, K+, or Li+. With the development of ion-selective electrodes for these analytes, flame photometers are no longer routinely used in clinical chemistry laboratories. The reader should refer to previous editions of this book for discussion of this technique.
Fluorometry
As seen with the spectrophotometer, light entering a solution may pass mainly through or may be absorbed partly or entirely, depending on the concentration and the wavelength entering that particular solution. Whenever absorption occurs, there is a transfer of energy to the medium. Each molecular type possesses a series of electronic energy levels and can pass from a lower energy level to a higher energy level only by absorbing an integral unit (quantum) of light that is equal in energy to the difference between the two energy states. There are additional energy levels owing to rotation or vibration of molecular parts. The excited state lasts about 10−5 seconds before the electron loses energy and returns to the ground state. Energy is lost by collision, heat loss, transfer to other molecules, and emission of radiant energy. Because the molecules are excited by absorption of radiant energy and lose energy by multiple interactions, the radiant energy emitted is less than the absorbed energy. The difference between the maximum wavelengths, excitation, and emitted fluorescence is called Stokes shift. Both excitation (absorption) and fluorescence (emission) energies are characteristic for a given molecular type; for example, Figure 5.12 shows the absorption and fluorescence spectra of quinine in sulfuric acid. The dashed line on the left shows the short-wavelength excitation energy that is maximally absorbed, whereas the solid line on the right is the longer wavelength (less energy) fluorescent spectrum.
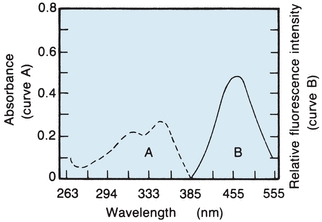
FIGURE 5.12 Absorption and fluorescence spectra of quinine in 0.1 N sulfuric acid. (Adapted from Coiner D. Basic Concepts in Laboratory Instrumentation. Bethesda, MD: ASMT Education and Research Fund; 1975-1979.)
Basic Instrumentation
Filter fluorometers measure the concentrations of solutions that contain fluorescing molecules. A basic instrument is shown in Figure 5.13. The source emits short-wavelength high-energy excitation light. A mechanical attenuator controls light intensity. The primary filter, placed between the radiation source and the sample, selects the wavelength that is best absorbed by the solution to be measured. The fluorescing sample in the cuvette emits radiant energy in all directions. The detector (placed at right angles to the sample cell) and a secondary filter that passes the longer wavelengths of fluorescent light prevent incident light from striking the photodetector. The electrical output of the photodetector is proportional to the intensity of fluorescent energy. In spectrofluorometers, the filters are replaced by a grating monochromator.
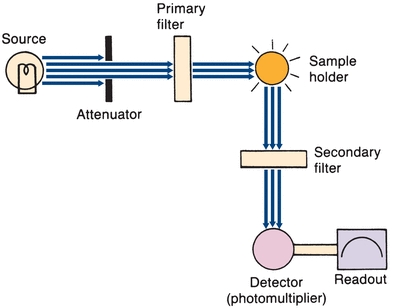
FIGURE 5.13 Basic filter fluorometer. (Adapted from Coiner D. Basic Concepts in Laboratory Instrumentation. Bethesda, MD: ASMT Education and Research Fund; 1975-1979.)
Gas discharge lamps (mercury and xenon arc) are the most frequently used sources of excitation radiant energy. Incandescent tungsten lamps are seldom used because they release little energy in the UV region. Mercury vapor lamps are commonly used in filter fluorometers. Mercury emits a characteristic line spectrum. Resonance lines at 365 to 366 nm are commonly used. Energy at wavelengths other than the resonance lines is provided by coating the inner surface of the lamp with a material that absorbs the 254-nm mercury radiation and emits a broad band of longer wavelengths. Most spectrofluorometers use a high-pressure xenon lamp. Xenon has a good continuum, which is necessary for determining the excitation spectra.
Monochromator fluorometers use gratings for isolation of incident radiation. Light detectors are almost exclusively PM tubes because of their higher sensitivity to low light intensities. Double-beam instruments are used to compensate for instability due to electric power fluctuation.
Fluorescence concentration measurements are related to molar absorptivity of the compound, intensity of the incident radiation, quantum efficiency of the energy emitted per quantum absorbed, and length of the light path. In dilute solutions with instrument parameters held constant, fluorescence is directly proportional to concentration. Generally, a linear response will be obtained until the concentration of the fluorescent species is so high that the sample begins to absorb significant amounts of excitation light. A curve demonstrating nonlinearity as concentration increases is shown in Figure 5.14. The solution must absorb less than 5% of the exciting radiation for a linear response to occur.6 As with all quantitative measurements, a standard curve must be prepared to demonstrate that the concentration used falls in a linear range.
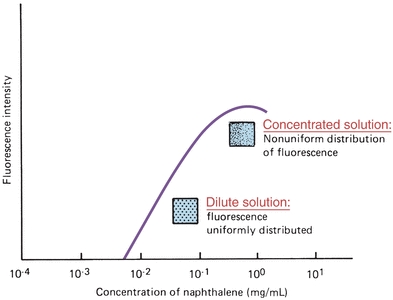
FIGURE 5.14 Dependence of fluorescence on the concentration of fluorophore. (Adapted from Guilbault GG. Practical Fluorescence, Theory, Methods and Techniques. New York, NY: Marcel Dekker; 1973.)
Stay updated, free articles. Join our Telegram channel

Full access? Get Clinical Tree


