and that reabsorbed more distally. Any factor affecting either passive filtration or epithelial cellular function may disturb this balance.
Table 2.1 Approximate contributions of solutes to plasma osmolality | |||||||||||||||||||||||||||||||
|---|---|---|---|---|---|---|---|---|---|---|---|---|---|---|---|---|---|---|---|---|---|---|---|---|---|---|---|---|---|---|---|
| |||||||||||||||||||||||||||||||
Table 2.2 The approximate volumes in different body compartments through which water is distributed in a 70-kg adult | ||||||||||||||||||||||||
|---|---|---|---|---|---|---|---|---|---|---|---|---|---|---|---|---|---|---|---|---|---|---|---|---|
| ||||||||||||||||||||||||
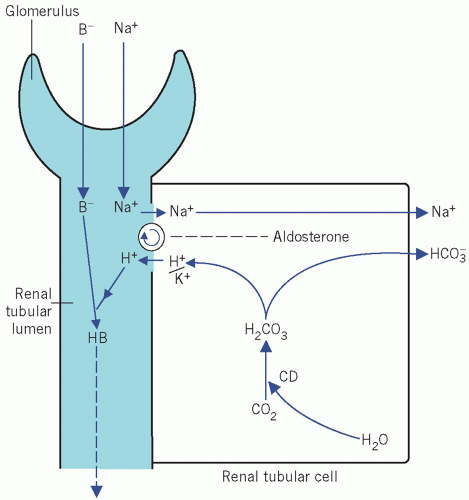 Figure 2.1 The action of aldosterone on the reabsorption of Na+ in exchange for either K+ or H+ from the distal renal tubules. See text for details. CD, carbonate dehydratase; B−, associated anion. |
It acts directly on capillary walls, causing vasoconstriction, and so probably helps to maintain blood pressure and alter the glomerular filtration rate (GFR). Vasoconstriction may raise the blood pressure before the circulating volume can be restored.
It stimulates the cells of the zona glomerulosa to synthesize and secrete aldosterone.
It stimulates the thirst centre and so promotes oral fluid intake.
intake and output; this is particularly pertinent for unconscious patients. ‘Insensible loss’ is usually assumed to be about 1 L/day, but there is endogenous water production of about 500 mL/day as a result of metabolic processes. Therefore the net daily ‘insensible loss’ is about 500 mL. The required daily intake may be calculated from the output during the previous day plus 500 mL to allow for ‘insensible loss’; this method is satisfactory if the patient is normally hydrated before day-to-day monitoring is started. Serial patient body weight determination can also be useful in the assessment of changes in fluid balance.
Haemodilution Increasing plasma volume with protein-free fluid leads to a fall in the concentrations of proteins and haemoglobin. However, these findings may be affected by pre-existing abnormalities of protein or red cell concentrations.
Table 2.3 Hypothetical cumulative fluid balance chart assuming an insensible daily loss of 500 mL
Measured intake (mL)
Measured output (mL)
Total output (minimum mL)
Daily balance (mL)
Cumulative balance (mL)
Day 1
2000
1900
2400
-400
-400
Day 2
2000
2000
2500
-500
-900
Day 3
2100
1900
2400
-300
-1200
Day 4
2200
2000
2500
-300
-1500
Haemoconcentration ECF is usually lost from the vascular compartment first and, unless the fluid is whole blood, depletion of water and small molecules results in a rise in the concentration of large molecules, such as proteins and blood cells, with a rise in blood haemoglobin concentration and haematocrit, raised plasma urea concentration and reduced urine sodium concentration.
intracellular, in which potassium is the predominant cation,
extracellular, in which sodium is the predominant cation, and which can be subdivided into:
interstitial space, with very low protein concentration, and
intravascular (plasma) space, with a relatively high protein concentration.
cells, and about the same proportion of potassium is intracellular. Cell-surface energy-dependent sodium/potassium adenosine triphosphatase pumps maintain these differential concentrations.
Table 2.4 Some electrolyte-containing fluids for intravenous infusion | ||||||||||||||||||||||||||||||||||||||||||||||||||||||||||||||||||||||||||||||||||||||||||||||||||||||||||||||||
|---|---|---|---|---|---|---|---|---|---|---|---|---|---|---|---|---|---|---|---|---|---|---|---|---|---|---|---|---|---|---|---|---|---|---|---|---|---|---|---|---|---|---|---|---|---|---|---|---|---|---|---|---|---|---|---|---|---|---|---|---|---|---|---|---|---|---|---|---|---|---|---|---|---|---|---|---|---|---|---|---|---|---|---|---|---|---|---|---|---|---|---|---|---|---|---|---|---|---|---|---|---|---|---|---|---|---|---|---|---|---|---|---|
| ||||||||||||||||||||||||||||||||||||||||||||||||||||||||||||||||||||||||||||||||||||||||||||||||||||||||||||||||
the osmolarity (in mmol/L) of solution,
the osmolality (in mmol/kg) of solvent.
greater than the volume of solvent only (water) in which the small molecules are dissolved. At a protein concentration of 70 g/L, the volume of water is about 6 per cent less than the total volume of the solution (that is, the molarity should theoretically be about 6 per cent less than the molality). Most methods for measuring individual ions assess them in molarity (mmol/L). If the concentration of proteins in plasma is markedly increased, the volume of solvent is significantly reduced but the volume of solution remains unchanged. Therefore the molarity (in mmol/L) of certain ions such as sodium will be reduced but the molality will be unaltered. This apparently low sodium concentration is known as pseudohyponatraemia.

no net movement of water into or out of cells. In some pathological states, rapid changes of extracellular solute concentration affect cell hydration; slower changes may allow time for the redistribution of solute and have little or no effect.
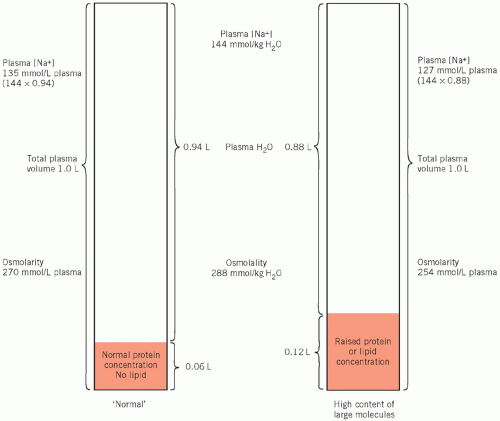 Figure 2.2 The consequence of gross hyperproteinaemia or hyperlipidaemia on the plasma water volume and its effect on the calculated plasma osmolarity and the true plasma osmolality. |
is so small that reduced levels of these solutes, unlike those of sodium, do not cause cellular overhydration.
secretion (SIADH) and may help to differentiate renal circulatory insufficiency (pre-renal) from intrinsic renal damage (see Chapter 3).
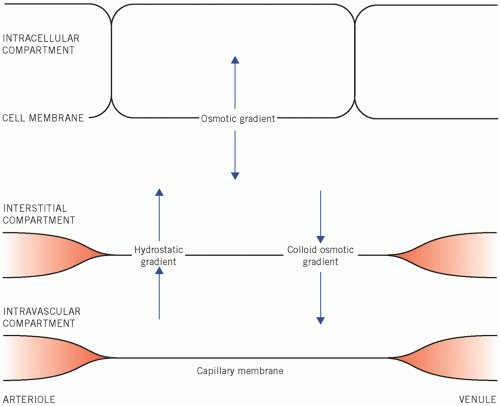 Figure 2.3 Osmotic factors that control the distribution of water between the fluid compartments of the body. |
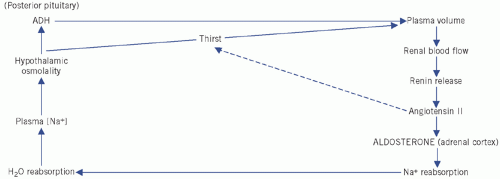 Figure 2.4 Control of water and sodium homeostasis. ADH, antidiuretic hormone. |

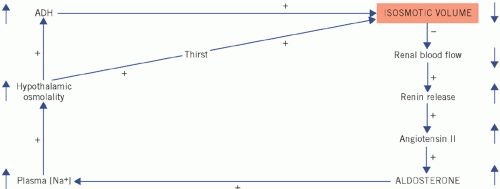 Figure 2.5 Homeostatic correction of isosmotic volume depletion. The reduced intravascular volume impairs renal blood flow and stimulates renin and therefore aldosterone secretion. There is selective sodium reabsorption from the distal tubules and a low urinary sodium concentration. (Shading indicates primary change.) ADH, antidiuretic hormone.
Stay updated, free articles. Join our Telegram channel
Full access? Get Clinical Tree
 Get Clinical Tree app for offline access

|