Individualization

Variability
OBJECTIVES
The reader will be able to:
- Define the terms: adherence to prescribed dosage regimen, bimodal frequency distribution, coefficient of variation, chronopharmacology, intraindividual variability, interindividual variability, persistence, population pharmacokinetics, population pharmacodynamics, unimodal frequency distribution.
- List six major sources of variability in drug response.
- Evaluate whether variability in drug response is caused primarily by variability in pharmacokinetics, pharmacodynamics, or both, given response and pharmacokinetic data.
- State why variability around the mean and shape of the frequency distribution histogram of a parameter are as important as the mean itself.
- Explain how variability in hepatic enzyme activity manifests itself in variability in both pharmacokinetic parameters and plateau plasma drug concentrations for drugs of high and low hepatic extraction ratios.
- Describe an approach to the design of the number of dose strengths of a drug needed to cover the target patient population when response is primarily determined by the pharmacokinetics of the drug, and response is directly correlated to the average exposure to drug at steady state.
 hus far, in the context of drug dosage, all patients have been assumed to be alike. Yet, we know that people differ in their responsiveness to drugs. Accordingly, there is often a need to tailor drug administration to the individual patient. A failure to do so can lead to ineffective therapy in some patients and undue harm in others.
This section of the book is devoted to treating the individual patient. A broad overview of the subject is presented in this chapter. In particular, evidence for and causes of variation in drug response are examined. Before proceeding, a distinction needs to be made between an individual and the population. Substantial differences in response to drugs commonly exist among patients. Such between or interindividual variability is often reflected by various marketed dose strengths of a drug. For example, diazepam, used in the management of some anxiety disorders, is marketed as 2-, 5-, and 10-mg tablets. Because variability in response within a subject from one occasion to another (intraindividual variability) is generally smaller than interindividual variability, there is usually little need to subsequently adjust an individual’s dosage regimen, once well-established, unless the condition or treatment of the patient changes. Clearly, if intraindividual variability were large and unpredictable, finding and maintaining dosage for an individual would be an extremely difficult task, particularly for a drug with a low therapeutic index.
Many patients stabilized on one medicine receive another for the treatment of the same or concurrent condition or disease. Sometimes, the second drug affects the response to the first. The change in response may be clinically insignificant for most of the patient population, with the recommendation that no adjustment in dosage be made. However, a few individuals may exhibit an exaggerated response, which could prove fatal unless the dosage of the first drug given to them is reduced. The lesson is clear: Average data are useful as a guide; but ultimately, information pertaining to the individual patient is all-important.
EXPRESSIONS OF INDIVIDUAL DIFFERENCES
Evidence for interindividual differences in drug response comes from several sources. Variability in the dosage required to produce a given response is illustrated in Fig. 12-1, which shows the wide range in the daily dose of warfarin needed to produce a similar degree of anticoagulant control, a consequence of variability in both pharmacokinetics and pharmacodynamics. Figure 12-2, which shows frequency distribution histograms of the plateau plasma concentration of the antidepressant drug nortriptyline to a defined daily dose, demonstrates interpatient variability in the input–exposure (pharmacokinetic) relationship. Variability in pharmacokinetics is also illustrated by the wide scatter in the plateau plasma concentration of phenytoin seen following any fixed daily dose of this drug (see Fig. 1-7, page 9). Because the pharmacokinetics of a drug reflects the body’s ability to handle drugs, it is not surprising that clearance values within the population associated with the oxidation of certain drugs strongly cosegregate. For example, a patient who is a poor metabolizer of midazolam is also a poor metabolizer of alfentanil; both drugs are eliminated predominantly by the same enzyme, in this case CYP3A4 (Fig. 12-3). Similarly, a rapid metabolizer of one of these drugs is a rapid metabolizer of the other. The data in Fig. 12-4, showing the plateau unbound plasma concentration of the more active S-warfarin enantiomer required to produce a similar degree of anticoagulant control following maintenance therapy with (racemic) warfarin, demonstrate substantial interpatient variability in exposure–response (pharmacodynamics) for this drug. Many drugs produce their effects by competing with endogenous agonists or antagonists, and in such cases part of the observed interindividual variability in pharmacodynamics, which can be substantial, is likely to arise from differences among patients in the concentrations of these endogenous compounds at the target site(s).
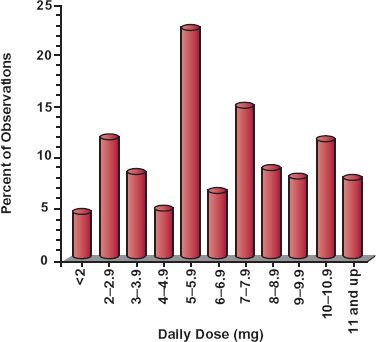
FIGURE 12-1. The daily dose of warfarin required to produce a similar degree of anticoagulation in 200 adult patients varies widely. (From: Koch-Weser J. The serum level approach to individualization of drug dosage. Eur J Clin Pharmacol 1975;9:1–8.)
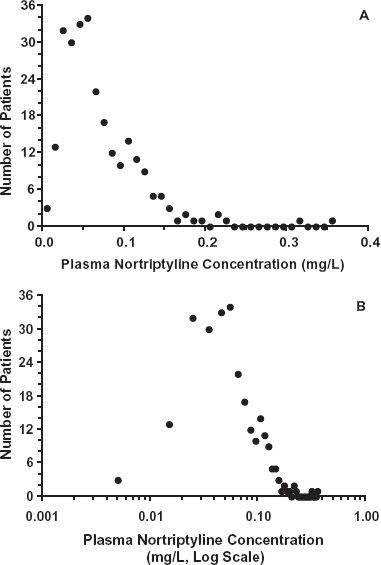
FIGURE 12-2. The plateau plasma concentration of nortriptyline varies widely in 263 patients receiving a regimen of 25 mg nortriptyline orally 3 times daily. A. Plot of the frequency against the plasma concentration shows a skewed distribution. B. The same data plotted against the logarithm of the concentration showing an essentially symmetrical distribution, indicating that the distribution is log-normal. (From: Sjoqvist F, Borga O, Orme MLE. Fundamentals of clinical pharmacology. In: Avery GS, ed. Drug Treatment. Edinburgh: Churchill Livingstone; 1976:1–42.)
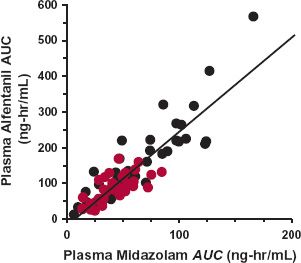
FIGURE 12-3. A high degree of cosegregation exists between midazolam and alfentanil exposure after intravenous ( ) and oral (
 ) administration of these drugs to 12 subjects. Both drugs are primarily eliminated by CYP3A4 catalyzed metabolism, and reflect variation in the functional activity of this enzyme within this group of subjects. (From: Kharasch ED, Walker A, Hoffer C, et al. Sensitivity of intravenous and oral alfentanil and papillary miosis as minimally invasive and noninvasive probes for hepatic and first-pass CYP3A4 activity. J Clin Pharmacol 2005;45:1187–1197.)
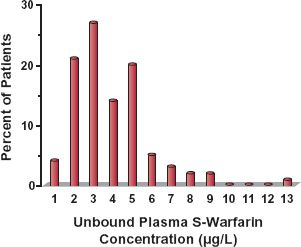
FIGURE 12-4. There is considerable interindividual pharmacodynamic variability in response to the oral anticoagulant warfarin as demonstrated by the substantial spread in the unbound concentration of the active S-isomer associated with a similar degree of anticoagulation in a group of 97 patients on maintenance therapy. (From: Scordo MG, Pengo V, Spina E, et al. Influence of CYP2C9 and CYP2C19 genetic polymorphisms of warfarin maintenance dose and metabolic clearance. Clin Pharmacol Ther 2002;72:702–710.)
Clearly, variability exists in both pharmacokinetics and pharmacodynamics, and measurement of drug in plasma is a prerequisite for separating the two. The characterization of pharmacokinetic and pharmacodynamic variabilities within the population is called population pharmacokinetics and population pharmacodynamics, respectively.
Some patients fail to respond to treatment even when systemic exposure to the drug is within the range associated with therapeutic response. The causes of such nonresponders are manifold, but all center around either misdiagnosis of the disease or because the individual lacks the therapeutic target or expresses one that fails to produce an adequate response (see Chapter 13, Genetics).
The examples of variability in drug response so far have been of the therapeutic effect of the drug, but the situation equally applies to adverse effects. For some relatively minor adverse effects, variability may be as great as, or even greater than, that for the therapeutic effect, particularly when they are associated with the inherent pharmacologic property of the drug (side effects), such as dryness of mouth experienced with some sympathomimetic nasal decongestants. Frequent side effects are also invariably experienced by patients undergoing chemotherapy during cancer treatment. However, in many other therapeutic settings, moderate to severe side effects are much less frequently experienced. Occasionally, the frequency of an adverse effect is so low that it is only detected with any significance when tens of thousands, if not millions, of patients have been treated with the drug. Even so, there is still some relationship between the likelihood and severity of an adverse effect and the exposure to the drug, although establishing it with any confidence may be difficult.
QUANTIFYING VARIABILITY
The magnitude and relative contribution of pharmacokinetics and pharmacodynamics to variability in response within a patient population vary with the drug. In clinical practice, an attempt to assign the relative contribution to pharmacokinetics and pharmacodynamics is often based on direct observations of plasma concentration and response. Such an assignment could be strongly influenced, however, by the timing of the observations and the magnitude of the response, as illustrated in Fig. 12-5 following a single dose. Here, a drug that displays little interpatient variability in Cmax, tmax, and in maximum effect, Emax, but large variability in half-life and concentration needed to produce 50% maximum response (C50), is given orally at two dose levels. The higher dose achieves close to maximal response in all patients, whereas the lower dose does not. At the higher dose, observations made at tmax would suggest little variability in either concentration or pharmacodynamics, with perhaps a greater assignment of variability to the former, as variation in plasma concentration produces relatively little change in response. At later times after this higher dose, substantial variability is observed in both concentration and response. In contrast, for the lower dose, at tmax there is still little interpatient variability in Cmax, but now there is considerable variability in response. This dependence on dose and time in the assignment of variability is minimized by expressing variability not in terms of observations but rather in terms of the parameter values defining pharmacokinetics and pharmacodynamics, that is, in F, ka, CL, and V for pharmacokinetics, and in Emax, C50, and the factor defining the steepness of the concentration–response relationship (γ) for pharmacodynamics (Chapter 2, Fundamental Concepts and Terminology). Once variability in these parameters is defined, the expected variability in concentration and response within the patient population at any time associated with a given dosage regimen can be calculated.
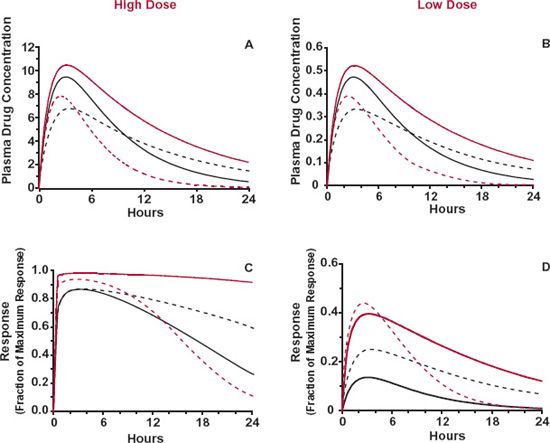
FIGURE 12-5. The interindividual variability in concentration and response varies with dose and time of observation. Shown are plasma concentrations (A and B) and responses (C and D) following large (left) and small (right) doses of a drug that displays little interpatient variability in Cmax, tmax, and maximum response, Emax. but large interpatient variability in half-life and concentration needed to produce 50% maximum response. High dose (top): at tmax, the maximum response in all patients is produced with little variability in either Cmax or response. Greater variability in concentration and response is seen at later times. Low dose (bottom): at tmax, variability in Cmax is still low, but that in response is now considerable. Each line corresponds to a different patient.
DESCRIBING VARIABILITY
Knowing how a particular parameter varies within the patient population is important in therapy. To illustrate this statement, consider the frequency distributions in, for example, clearance of the four hypothetical drugs shown in Fig. 12-6. The mean, or central tendency, for all four drugs is the same, but variability about the mean is very different. For Drugs A, B, and C, the distribution is unimodal and log normal; here, the mean represents the typical value of clearance expected in the population. As variability about the mean is much greater for Drugs B and C than for Drug A, one has much less confidence that the mean of Drug C, in particular, applies to an individual patient. For Drug D, distribution in clearance is bimodal, signifying that there are two major groups within the population: those with high and low clearances. Obviously, in this case, the mean is one of the most unlikely values to be found in this population.
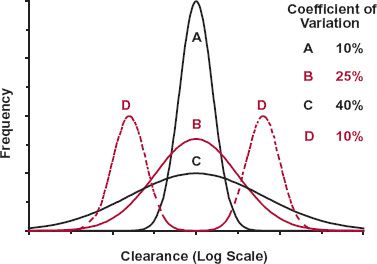
FIGURE 12-6. As the frequency distributions for the clearance of four hypothetical drugs (A, B, C, D) show, it is as important to define variability around the mean and the shape of the frequency distribution curve as it is to define the mean itself. Drugs A, B, and C exhibit unimodal log-normal distributions with coefficients of variation of 10%, 25%, and 40%, respectively. The distribution for Drug D is bimodal, with a low frequency of individuals in whom clearance is the mean value for the entire population.
A comment on the quantitation of variability is needed here. One measure of variability is variance; it is defined as the sum of the squares of the deviations of observations from their means. Although useful to convey variability within a particular set of observations, variance does not allow ready comparison of variability across sets of observations of different magnitude, or of different dimensions, such as those of clearance and volume of distribution. To illustrate this point, suppose the clearance of a drug within a population has a mean of 100 mL/min and a variance of 2500 (mL/min)2. If instead clearance had been quoted in L/min, numerically the mean value would be a 1000-fold smaller (i.e., 0.1 L/min), and variance would be a millionfold smaller (i.e., 0.0025 L2/min2). Coefficient of variation, the square root of variance (the standard deviation) normalized to the mean, overcomes this problem. In the example above, the coefficient of variation is 0.25 or 25%, independent of the units of clearance. Subsequently, the terms high and low variability refer to distributions that have high and low coefficients of variation, respectively. Typically, a coefficient of variation of a pharmacokinetic parameter of 10% or less is considered low, 25% is moderate, and above 40% is high. Although these values do not appear too dissimilar, examination of the three unimodal distributions in Fig. 12-5 with these respective coefficients of variations illustrates, however, just how variable a distribution with a coefficient of variation of 40% (Drug C) truly is.
A practical illustration of interindividual variability in a parameter among drugs is seen in Fig. 12-7, which shows that the coefficient of variation in oral bioavailability among subjects increases as bioavailability of a drug decreases, from about 10% when bioavailability is close to 100% to 50% as bioavailability tends toward zero. That is, there is an increasing tendency to be less confident in the application of the population mean bioavailability to an individual as bioavailability decreases. The low variability when bioavailability is 100% is as expected, because this is the upper limit of this parameter, but what is equally informative is how the magnitude of variability changes with decreasing bioavailability.
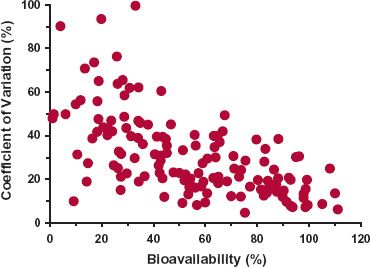
FIGURE 12-7. There is a trend for intersubject variability (expressed as percent CV) in oral bioavailability to increase as the bioavailability of a drug decreases. Data obtained from a total of 149 studies covering 100 drugs. There was no discernible difference between healthy volunteers and patients. (From: Hellriegel ET, Bjornsson TD, Hauck WW. Interpatient variability in bioavailability is related to the extent of absorption: Implications for bioavailability and bioequivalence studies. Clin Pharmacol Ther 1996;60: 601–607.)
A cautionary related note to variability is the danger of misinterpreting the results of averaging of data. Figure 12-8 contains three extreme scenarios aimed at illustrating this point. Shown are individual profiles together with the average profile obtained by taking the arithmetic mean of the individual observations (y-axis) for given values of the horizontal axis, concentration in Fig. 12-8A and time in Fig. 12-8B,C. As is clearly apparent, the mean line in each case gives a distorted view as what might be expected in an individual. In Fig. 12-8A, the value of the steepness factor, γ, of the concentration–response relationship is much smaller than observed in any individual. In Fig. 12-8B, although the decline in concentration with time is monoexponential in each subject, the mean line is polyexponential giving the illusion that distribution kinetics prevails, whereas in Fig. 12-8C, the mean profile gives the illusion that the plasma concentration is constant for up to 10 hr, whereas in any individual it is seen to be relatively constant for only about 2 hr. Clearly, to avoid such problems, whenever possible, it is better to obtain individual profiles and appropriately average the parameters while maintaining the same model for all individuals.
WHY PEOPLE DIFFER
The reasons why people differ in their responsiveness to a given dose of a drug are manifold and include genetics, disease, age, gender, body weight, drugs given concomitantly, and various behavioral and environmental factors. Age, body weight, disease, and concomitantly administered drugs are important because they are measurable sources of variability that can be taken into account. Gender-linked differences in hormonal balance, body composition, and activity of certain enzymes manifest themselves in differences in both pharmacokinetics and responsiveness, but overall, the effect of gender is small. Although inheritance accounts for a substantial part of the differences in response among individuals for many drugs, much of this variability is still largely unpredictable, particularly in regard to pharmacodynamics, although as discussed in Chapter 13, Genetics, our understanding of this source of variability is improving rapidly.
Stay updated, free articles. Join our Telegram channel

Full access? Get Clinical Tree


