(1)
Institute of Economic Growth, Delhi University, Delhi, India
Abstract
The preceding three chapters have lent considerable evidence to suggest that people in backward regions of UP and Rajasthan are severely pressured by OOP expenditure on health care. Almost a similar result was presented for the slum residents in Delhi as well. These results have also lent credence to the fact that a bulk of these households is marred by varying levels of catastrophe with possibilities of major curtailments in their living conditions. A probit regression analysis in Chap. 5 further indicates that the poor, economically less secured, lower caste, moderately educated, poor sanitation, lack of access to potable drinking water, low levels of living without proper lighting or cooking fuel and kutcha houses are among the factors making people susceptible to enhanced risks of health catastrophe. However, a question that needs to be examined in the context of these findings is: what happens to the public health facilities and despite high financial burden, why do people go to private practitioners? A related question may arise with regard to the utilisation of added services created in rural areas since the inception of the NRHM in April 2005. Do people even know about these facilities and their intended objectives to provide an added package of services including sanitation, potable drinking water, better childcare with timely vaccination and assistance to pregnant rural women with basic medicines and institutional deliveries? We will try to examine a few, if not all, of these issues in the rest of this chapter.
The preceding three chapters have lent considerable evidence to suggest that people in backward regions of UP and Rajasthan are severely pressured by OOP expenditure on health care. Almost a similar result was presented for the slum residents in Delhi as well. These results have also lent credence to the fact that a bulk of these households is marred by varying levels of catastrophe with possibilities of major curtailments in their living conditions. A probit regression analysis in Chap. 5 further indicates that the poor, economically less secured, lower caste, moderately educated, poor sanitation, lack of access to potable drinking water, low levels of living without proper lighting or cooking fuel and kutcha houses are among the factors making people susceptible to enhanced risks of health catastrophe. However, a question that needs to be examined in the context of these findings is: what happens to the public health facilities and despite high financial burden, why do people go to private practitioners? A related question may arise with regard to the utilisation of added services created in rural areas since the inception of the NRHM in April 2005. Do people even know about these facilities and their intended objectives to provide an added package of services including sanitation, potable drinking water, better childcare with timely vaccination and assistance to pregnant rural women with basic medicines and institutional deliveries? We will try to examine a few, if not all, of these issues in the rest of this chapter.
As was noted, two issues form the basic concern of this chapter. First is to examine the utilisation of public health-care facilities by households cross-classified according to: (i) rural–urban and slum–non-slum, (ii) consumption quintiles and (iii) catastrophe status. The second issue to be examined is as regards the reasons for non-utilisation or poor utilisation of the public facilities including primary health centres (PHC) or CHCs.1 The focus of discussion in this part of analysis concerns the non-availability of doctors, particularly in rural areas, which may inter alia be an indication of (a) deficient manpower planning in government-run medical facilities and (b) poor management and/or deployment of available human resources by authorities and health-care planners. In between, we will also discuss about the NRHM and if people access the services provided under this scheme to a considerable extent.
7.1 Utilisation of Public Sector Facilities by Rural–Urban and Socioreligious Groups: Hospitalisation and Outpatient Care
Like the share of expenditure on drugs and medicines as observed in the preceding chapter, another significant issue in the context of health-driven poverty relates to a very high dependence of households on private facilities despite creation of a vast publicly financed health-care infrastructure in most rural and urban areas. Alarmingly, this dependence holds for most rural and low-income areas covered in the study. Moreover, a considerable share of poor population from the lowest quintile also appears to have relied on private providers. Catastrophic households follow a similar pattern. Furthermore, even in hospitalised treatment where it has an edge, the public sector is losing its earlier sheen. Tables7.1a, 7.1b, 7.2a, 7.2b, 7.3a and 7.3b provide these details both for the hospitalised and outpatient treatments cross-classified by the sample areas and socioreligious groups. Major highlights of these tables are also represented graphically in figures drawn on the basis of the three tables mentioned above.
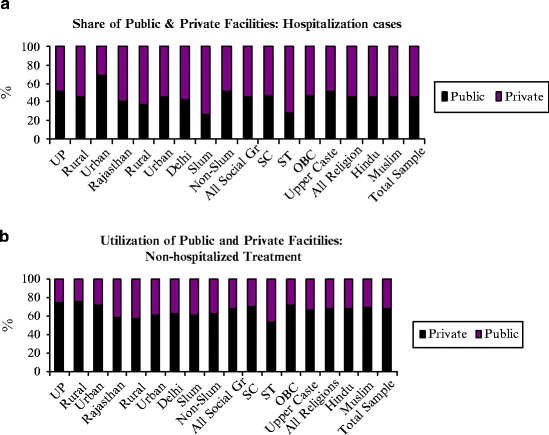
Tables 7.1a and 7.1b give the distribution of hospitalised (inpatient) and nonhospitalised (outpatient) cases treated in public or private facilities in rural and urban areas of the states under consideration. Two recall periods have been used—365 days for the former and 30 days for the latter (see also Fig. 7.1a, b). As has been noted, one of the most visible highlights of both the tables relates to the dominance of private facilities in the delivery of health services at all the places covered in the study. This pattern has been highlighted very sharply by Fig. 7.1b (and also Table 7.1b) with the help of a bivariate distribution of public–private shares in non-ambulatory (or outpatient) care across most of the survey areas and socioreligious groups. The share of private providers is particularly higher in UP where almost three-quarters of both rural and urban health-care seekers have relied on private practitioners for their routine outpatient care. Interestingly, this share has turned out to be relatively smaller in remaining states with the lowest in Rajasthan followed by Delhi (see the painted column in Table 7.1b). Nevertheless, at no place the share of private practitioners in outpatient care drops below 50 %. What does this lack of interest mean for the 11th Five-Year Plan (2007–2012) and its health objectives? The current Plan sets out to provide special attention to the health of marginalised groups like adolescent girls, women of all ages, children below the age of three, older persons, disabled and primitive tribal groups (Planning Commission 2008). However, a limited utilisation of health facilities, especially by the poor and low-income households, may bring an element of contradiction between the ground realities and Plan objectives. It would therefore be imperative for all the stakeholders, in particular the health administrators, to raise the level of health-care utilisation in the public sector.


Table 7.1a
Hospitalisation incidence and utilisation of public or private medical facilities: sample population (reference period: past 12 months)
States/socioreligious categories | Size of sample population (N) | Hospitalisation share (%) | Utilisation of facilities | Hospitalisation cases (number) | |
|---|---|---|---|---|---|
Private (%) | Publica (%) | ||||
UP | 5,603 | 2.6 | 52.1 | 48.0 | 146 |
Rural | 4,236 | 2.5 | 45.7 | 54.3 | 105 |
Urban | 1,367 | 3.0 | 68.3 | 31.7 | 41 |
Rajasthan | 3,523 | 3.4 | 40.2 | 59.8 | 117 |
Rural | 2,705 | 3.1 | 37.8 | 62.2 | 82 |
Urban | 818 | 4.2 | 45.7 | 54.3 | 35 |
Delhi | 1,937 | 3.5 | 41.8 | 58.2 | 67 |
Slum | 569 | 4.6 | 26.9 | 73.1 | 26 |
Non-slum | 1,368 | 3.0 | 51.2 | 48.8 | 41 |
All social group | 11,063 | 3.0 | 45.8 | 54.2 | 330 |
SC | 2,531 | 3.1 | 46.2 | 53.9 | 78 |
ST | 1,361 | 2.7 | 27.8 | 72.2 | 36 |
OBC | 4,367 | 3.0 | 46.6 | 53.4 | 131 |
Upper caste | 2,804 | 3.0 | 51.8 | 48.2 | 85 |
All religions | 11,063 | 3.0 | 45.8 | 54.2 | 330 |
Hindu | 9,795 | 3.0 | 45.6 | 54.4 | 294 |
Muslim | 1,112 | 2.8 | 45.2 | 54.8 | 31 |
Total sample | 11,063 | 3.0 | 45.8 | 54.2 | 330 |
Table 7.1b
Outpatient treatment and utilisation of public or private medical facilities: sample population (reference period: past 30 days)
States/socioreligious categories | Number of persons | Nonhospitalised cases (%) | Type of medical doctor consulted: | Total outpatient cases (number) | |
|---|---|---|---|---|---|
Private (%) | Public (%) | ||||
UP | 5,603 | 16.3 | 75.1 | 24.9 | 913 |
Rural | 4,236 | 17.1 | 75.9 | 24.1 | 726 |
Urban | 1,367 | 13.7 | 72.2 | 27.8 | 187 |
Rajasthan | 3,523 | 13.7 | 58.4 | 41.6 | 481 |
Rural | 2,705 | 13.9 | 57.6 | 42.4 | 377 |
Urban | 818 | 12.7 | 61.5 | 38.5 | 104 |
Delhi | 1,937 | 17.6 | 62.5 | 37.5 | 341 |
Slum | 569 | 16.9 | 61.5 | 38.5 | 96 |
Non-slum | 1,368 | 17.9 | 62.9 | 37.1 | 245 |
All social group | 11,063 | 15.7 | 68.0 | 32.0 | 1,735 |
SC | 2,531 | 16.3 | 70.6 | 29.4 | 412 |
ST | 1,361 | 15.2 | 53.6 | 46.4 | 207 |
OBC | 4,367 | 14.5 | 71.9 | 28.1 | 634 |
Upper caste | 2,804 | 17.2 | 66.8 | 33.2 | 482 |
All religions | 11,063 | 15.7 | 68.0 | 32.0 | 1,735 |
Hindu | 9,795 | 15.8 | 67.8 | 32.2 | 1,544 |
Muslim | 1,112 | 14.8 | 69.7 | 30.3 | 165 |
Total sample | 11,063 | 15.7 | 68.0 | 32.0 | 1,735 |
Contrary to the outpatient services, public facilities appear to have a greater role in providing hospital care at most of the places under reference. Table 7.1a summarises these details. This table shows that the utilisation of government hospitals is invariably higher among the tribal, low-caste and low-income people, especially from the slums and rural areas (see the coloured numbers in Table 7.1a; also see Fig. 7.1a). Unfortunately, however, it does not prove to be conclusively so as quite a bigger fraction of inpatient care accessed by the people from non-slum and urban areas of Delhi and UP has been delivered by the private hospitals and nursing homes. This is also true for those belonging to the upper-caste groups in the sample (see the coloured numbers in the table).
These variations apart, it needs to be admitted that the public hospitals not only serve a big fraction of people from different stratums and residential areas, they also serve to regulate the overall functioning of the private providers in more ways than one.
7.1.1 Distribution of Hospitalised and Nonhospitalised Care by Quintile Groups
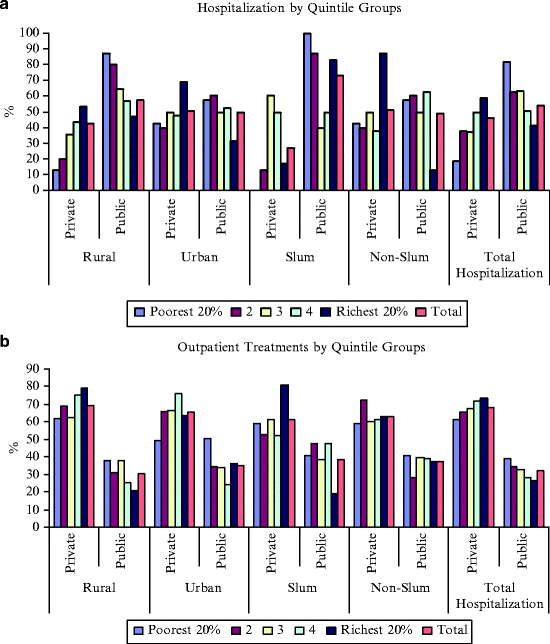
Tables 7.2a and 7.2b distributes the users of public and private health-care services from different residential areas according to their consumption quintiles. Like before, this table has also been divided into two parts—7.2a and 7.2b—with the latter relating to the nonhospitalisation or outpatient cases with a reference period of 30 days, while the former provides a similar distribution for the hospitalisation episodes using a recall period of 12 months. Figure 7.2a and bgive a graphical presentation of the two tables, respectively.


