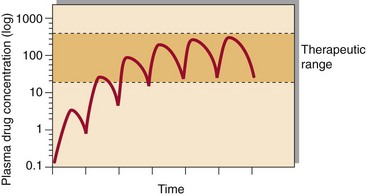
59 Following the administration of a drug, the graph of plasma concentration against time, plotted on semi-logarithmic graph paper, will look like that in Figure 59.1. Analysis of such graphs can allow an estimate of the half-life of the drug ( Fig 59.1 Plasma drug concentration shown after a series of identical doses equally spaced. After approximately 5 half-lives steady state is achieved.
Therapeutic drug monitoring
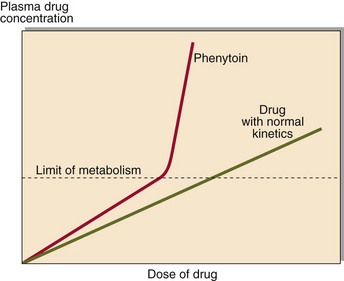
 ) and the volume of distribution, which is higher if the drug is taken up by tissues. These can be used to estimate the correct dose to give. After several similar doses have been given, the pattern reaches a steady state at which the plasma drug concentration will oscillate between a peak and a trough level. It usually takes about five half-lives for the steady state to be attained. In the steady state there is a stable relationship between the dose and the effect, and decisions can be made with confidence. For most drugs there is a linear relationship between dose and plasma concentration. However, phenytoin shows non-linear kinetics (Fig 59.2).

Basicmedical Key
Fastest Basicmedical Insight Engine


