FIGURE 8-1. The nephron. Arrows pointing toward the nephron represent substances entering from the peritubular blood or interstitial space. Arrows heading away represent reabsorption. Solid arrows represent an active (energy-requiring) process, and dashed arrows represent a passive process. PCN = penicillin; lytes = electrolytes.
The proximal tubule reabsorbs large quantities of water and solute. Sodium passively follows the reabsorption of water back into the blood. Glucose, uric acid, chloride, bicarbonate, amino acids, urea, hydrogen, phosphate, calcium and magnesium are also primarily reabsorbed by the proximal tubule. Sodium, chloride, magnesium, and water are further reabsorbed in the loop of Henle. The distal tubule controls the amounts of sodium, potassium, bicarbonate, phosphate, and hydrogen that ultimately are excreted, and the collecting duct regulates the amount of water in the urine as a result of the effect of antidiuretic hormone (ADH), which facilitates water reabsorption.1
As shown in Figure 8-1, substances can enter the nephron from the peritubular blood or interstitial space via secretion. In addition, substances can be reabsorbed from primarily the distal tubule back into the systemic circulation via the peritubular vasculature. Tubular secretion occurs via two primary pathways in the proximal tubule: the organic acid transport (OAT) system and the organic cation transport (OCT) system. While each system is somewhat specific for anions and cations, respectively, some drugs, such as probenecid, are excreted by both pathways. Creatinine enters the tubule primarily by filtration through the glomerulus. However, a small amount of creatinine is also secreted by the OCT system into the proximal tubule. This becomes important when using the renal clearance of creatinine to estimate kidney function.1
Blood flow to the kidneys is determined, in large part, by cardiac output with about 20% or 1.2 L/min directed to the kidneys. Renal plasma flow (RPF) is directly related to renal blood flow (RBF) by taking the patient’s hematocrit into consideration as follows:
(1) RPF = RBF × (1–Hct)
where RPF = renal plasma flow; RBF = renal blood flow; and Hct = hematocrit.
The normal value for RPF is about 625 mL/min. Of the plasma that reaches the glomerulus, about 20% is filtered and enters the proximal tubule, resulting in a glomerular filtration rate (GFR) of about 125 mL/min. The GFR is often used as a measure of the degree of kidney excretory function in a patient. The kidneys filter about 180 L of fluid each day; of this amount, they excrete only 1.5 L as urine. Thus, more than 99% of the GFR is reabsorbed back into the bloodstream. Many solutes, such as creatinine and many renally eliminated drugs, are concentrated in the urine.1
ASSESSMENT OF KIDNEY FUNCTION
Classification of kidney disease as well as dosing of medications depends on an accurate and reliable method of assessing kidney function.2 Direct measurement of GFR using markers such as inulin and iothalamate is the most accurate assessment of kidney function but is not used routinely in clinical practice due to cost and practical concerns. Measurement of timed 24-hour urine creatinine (UCr) collections are difficult by design, flawed by collection errors, and inconvenient. The estimation of creatinine clearance (CrCl) through equations such as Cockcroft-Gault has been the “gold standard” for drug dosing. Recently, serum concentrations of cystatin C, an endogenous amino acid, have been evaluated as an alternative method to predict GFR in children as well as adults.3-5 The estimation of GFR (eGFR) has been validated using the Modification of Diet in Renal Disease (MDRD) equation and is used to stage and monitor chronic kidney disease (CKD).6-10 Recently, the Food and Drug Administration Guidance to Industry draft revision has proposed that both the eGFR and CrCl be incorporated into the package insert dosage recommendations for patients with decreased renal function.11 With more clinical laboratories reporting eGFR values and as pharmacokinetic data reference both eGFR and CrCl for new medications, the use of eGFR to adjust medication doses may become more commonplace.
Exogenous Markers
Inulin Clearance
Normal range: men = 127 mL/min/m2; women = 118 mL/min/m2
Inulin is a fructose polysaccharide, an inert carbohydrate, with a molecular weight of 5200 daltons, which is not bound to plasma proteins. Inulin is freely filtered through the glomerulus and not metabolized, secreted, or reabsorbed and can be regarded as the gold standard for measuring GFR in adults and older children.12 Neonates and younger children may present logistical problems in obtaining accurate urine flow rates.9 This test is fairly invasive because inulin must be administered intravenously, and it requires special analytical methods that limit its practical application in many healthcare facilities.9
Iothalamate and Cr-EDTA Clearance
Normal range: men = 127 mL/min/m2; women = 118 mL/min/m2
The urinary clearance of the radioactive marker I-Iothalamate is being more commonly used in research settings. The test involves injection of the radioactive exogenous marker, repeated blood sampling, and timed urine collection. The invasiveness and associated costs prohibit widespread application. The administration of 51Cr-EDTA (ethylenediamine tetra-acetic) has been used in the past as an alternative to I-Iothalamate. As with inulin, the need for intravenous (IV) administration and timed urine collections for both these markers make them impractical for routine use.
Endogenous Markers
Cystatin C
Cystatin C is a protease inhibitor produced at a steady-state by all nucleated cells that is filtered by the glomerulus and neither reabsorbed or secreted by the kidney.13 It had been originally proposed that cystatin C may be more sensitive than SCr in tracking changes in kidney function, and that it is unaffected by diet or muscle mass. Serum cystatin C concentrations would be expected to be inversely proportional to GFR. Changes in serum cystatin C concentrations may be an indirect reflection of GFR. Combining SCr with cystatin C, age, sex, and race in estimating GFR have provided better results than equations based upon a single filtration marker.14 The practical utility of these serum concentrations in clinical practice warrants further investigation. The standardization of this assay must be completed before cystatin C equations are adopted for use in patient care decisions.15 Cystatin C concentrations have been used in equations for estimating GFR in pediatric patients.3 Research has validated the use of cystatin C in these special populations over traditional SCr-based equations. Further data may support the use of cystatin C concentrations in adolescents, obstetrics, and geriatric patients.16 Data also supports the correlation of elevated cystatin C levels and cardiovascular disease mortality.17 Initial findings may also expand the clinical utility of measuring cystatin C concentrations to detect early kidney impairment in patients with prediabetes and diabetes and to provide more accurate estimation of renal function for patients with human immunodeficiency virus (HIV) or liver disease.16
CKD-EPI cystatin equation and creatinine adjusted for age, sex, and race16:
(2) eGFR = 177.6 × SCr -0.65 × CysC-0.57 × age-0.20 × 0.80 (if female) × 1.11 (if African American)
Serum Creatinine
Normal range: 0.6–1.2 mg/dL or 53–106 µmol/L for adults; 0.2–0.7 mg/dL or 18–62 µmol/L for young children
Creatinine and its precursor creatine are nonprotein, nitrogenous biochemicals of the blood. After synthesis in the liver, creatine diffuses into the bloodstream. Creatine then is taken up by muscle cells, where some of it is stored in a high-energy form, creatine phosphate. Creatine phosphate acts as a readily available source of phosphorus for regeneration of adenosine triphosphate (ATP) and is required for transforming chemical energy to muscle action.
Creatinine, which is produced in the muscle, is a spontaneous decomposition product of creatine and creatine phosphate. The daily production of creatinine is about 2% of total body creatine, which remains constant if muscle mass is not significantly changed. In normal patients at steady-state, the rate of creatinine production equals its excretion. Therefore, creatinine concentrations in the serum (SCr) vary little from day-to-day in patients with healthy kidneys. Although there is an inverse relationship between SCr and kidney function, SCr should not be the sole basis for the evaluation of renal function.9 There are several issues to consider when evaluating a patient’s SCr. Some of factors that affect SCr concentrations are muscle mass, sex, age, race, medications, method of laboratory analysis, and low-protein diets. Additionally, acute changes in a patient’s GFR such as in acute kidney injury may not be initially manifested as an increase in SCr concentration since it takes time for new steady-state concentrations of SCr to be achieved. The time required to reach 95% of steady-state in patients with 50%, 25%, and 10% of normal kidney function is about 1, 2, and 4 days respectively. Steady-state concentrations of SCr become very important as they are integral in clinical practice estimations of renal function.
A SCr concentration within the reference ranges as reported by clinical laboratories does not necessarily indicate normal kidney function. For example, a SCr concentration of 1.5 mg/dL in a 45-year-old male who weighs 150 pounds and a 78-year-old female who weighs 92 pounds would correspond to different GFRs.
Clinicians can surmise that as long as no abnormalities exist in muscle mass and there has been no recent protein ingestion, an increased SCr almost always reflects a decreased GFR. The converse is not always true; a normal SCr does not necessarily imply a normal GFR. As part of the aging process, both muscle mass and renal function diminish. Therefore, SCr may remain in the normal range because as the kidneys become less capable of filtering and excreting creatinine, they also are presented with decreasing amounts of creatinine. Thus, practitioners should not rely solely on SCr as an index of renal function.
Besides aging and alterations in muscle mass, some pathophysiological changes can affect the relationship between SCr and kidney function. For example, renal function may be overestimated on the basis of SCr alone in cirrhotic patients. In this patient population, the low SCr is due to a decreased hepatic synthesis of creatine, the precursor of creatinine. In cirrhotic patients, it is prudent to perform a measured 24-hour CrCl. If the patient also has hyperbilirubinemia, assay interference by elevated bilirubin also may contribute to a low SCr.
Laboratory measurement and reporting of SCr. Historically, the laboratory methods used to measure SCr included the alkaline picrate method, inorganic enzymatic methods, and high-pressure liquid chromatography (HPLC). The alkaline picrate assay (Jaffe) was the most commonly used method to measure SCr; however, interfering substances such as noncreatinine chromogens can often lead to underestimation of kidney function. Causes of falsely elevated SCr results included unusually large amounts of noncreatinine chromogens (e.g., uric acid, glucose, fructose, acetone, acetoacetate, pyruvic acid, and ascorbic acid) in the serum. For example, an increase in glucose of 100 mg/dL (5.6 mmol/L) could falsely elevate SCr by 0.5 mg/dL (44 µmol/L) in some assays. Likewise, serum ketones high enough to spill into the urine may falsely increase SCr and UCr. In diabetic patients in diabetic ketoacidosis (DKA), false elevation could precipitate unnecessary evaluation for renal failure when presenting with ketoacidosis. Like ketones, acetoacetate may have been elevated enough to cause falsely elevated SCr after a 48-hour fast or in patients with DKA. Another endogenous substance, bilirubin, could falsely lower SCr results with both the alkaline picrate and enzymatic assays. At low GFRs, however, creatinine secretion overtakes the balancing effects of measuring noncreatinine chromogens, causing an overestimation of GFRs by as much as 50%.5
Reliable and accurate measurement and subsequent reporting of SCr concentrations is very important. The MDRD equation utilizes as one of its variables the SCr concentration to stage kidney damage based on the estimation of GFR. The Cockcroft-Gault equation, which is highly dependent on the SCr concentration, has been used as the accepted methodology for drug dosing based on estimation of CrCl.18 The greater the imprecision of the assay the less accurate the resultant GFR estimations. The primary source of measurement errors included systematic bias and interlaboratory, intralaboratory, and random variability in daily calibration of SCr values. Interlaboratory commutability is also problematic secondary to the variations in assay methodologies. Recently, a report from the Laboratory Working Group of the National Kidney Disease Program, made recommendations to improve and standardize measurement of SCr.19,20 As of 2011, creatinine standardization is reported to be nationwide (in the United States) and calibration should be traceable to isotope dilution mass spectrometry (IDMS). Of note, SCr concentrations are lower than had been previously reported with older methods. Calculations of renal function using Cockcroft-Gault or MDRD should use the standardized creatinine value. Calculated GFRs above 60 mL/min/1.73 m2 using the MDRD equation should be simply reported as “greater than 60 mL/min/1.73 m2.”
Normal range: 8–23 mg/dL or 2.9–8.2 mmol/L
Blood urea nitrogen (BUN) is actually the concentration of nitrogen (as urea) in the serum and not in RBCs as the name implies. Although the renal clearance of urea can be measured, it cannot be used by itself to assess kidney function. Its serum concentration depends on urea production (which occurs in the liver) and tubular reabsorption in addition to glomerular filtration. Therefore, clinicians must consider factors other than filtration when interpreting changes in BUN.
When viewed with other laboratory and clinical data, BUN can be used to assess or monitor hydration, renal function, protein tolerance, and catabolism in numerous clinical settings (Table 8-1). Also, it is used to predict the risk of uremic syndrome in patients with severe renal failure. Concentrations above 100 mg/dL (35.7 mmol/L) are associated with this risk.
Elevated BUN
Urea production is increased by
- A high-protein diet (including amino acid infusions)
- Upper gastrointestinal (GI) bleeding
- Administration of corticosteroids, tetracyclines, or any other drug with antianabolic effects
Usually, about 50% of the filtered urea is reabsorbed, but this amount is inversely related to the rate of urine flow in the tubules. In other words, the slower the urine flows, the more time the urea has to leave the tubule and re-enter surrounding capillaries (reabsorption). Urea reabsorption tends to change in parallel with sodium, chloride, and water reabsorption. Since patients with volume depletion avidly reabsorb sodium, chloride, and water, larger amounts of urea are also absorbed.
Urine flow, in turn, is affected by fluid balance and BP. For example, patients who are dehydrated with low urine flow may develop high concentrations of urea nitrogen in the blood. Likewise, a patient with a pathologically low BP may develop diminished urine flow secondary to decreased RBF with a subsequently diminished GFR. Congestive heart failure and reduced RBF, despite increased intravascular volume, is a common cause of elevated BUN. Causes of abnormally high BUN (also called azotemia) are listed in Table 8-1.
Decreased BUN
In and of itself, a low BUN does not have pathophysiological consequences. BUN may be low in patients who are malnourished or have profound liver damage (due to an inability to synthesize urea). Intravascular fluid overload may initially dilute BUN (causing low concentrations), but many causes of extravascular volume overload, which are associated with third spacing of fluids into tissues (e.g., congestive heart failure, renal failure, and nephrotic syndrome) result in increased BUN because effective circulating volume is decreased.
Concomitant BUN and SCr
Simultaneous BUN and SCr determinations are commonly made and can furnish valuable information to assess kidney function. This is particularly true for acute kidney injury. In acute kidney injury due to volume depletion, both BUN and SCr are elevated. However, the BUN:SCr ratio is often >20:1 (SI: 0.08:1 or higher). This observation is due to the differences in the renal handling of urea and creatinine. Recall that urea is reabsorbed with water, and under conditions of decreased renal perfusion both urea and water reabsorption are increased. Since creatinine is not reabsorbed, it is not affected by increased water reabsorption. So the concentrations of both substances may increase in this setting, but the BUN would be increased to a greater degree, leading to a BUN:SCr >20:1.
In summary, when acute changes in kidney function are observed, and both BUN and SCr are greater than normal limits, BUN:SCr ratios greater than 20:1 suggest prerenal causes of acute renal impairment (Table 8-1), whereas ratios from 10:1 to 20:1 (SI: from 0.04:1 to 0.08:1) suggest intrinsic kidney damage. Furthermore, a ratio greater than 20:1 is not clinically important if both SCr and BUN are within normal limits (e.g., SCr = 0.8 mg/dL and BUN = 20 mg/dL).
Measurement of CrCl
A complete 24-hour urine collection to measure CrCl is difficult to obtain outside of research facilities and is prone to errors in collection. In addition, the National Kidney Foundation indicates that these measured CrCls are not better than the estimates of CrCl provided through equations such as the Cockcroft-Gault or the MDRD.9,21 However, a 24-hour, timed urine measurement of CrCl may be useful in the following clinical situations: patients starting dialysis; in the presence of acute changes in kidney function; during evaluation of dietary intake and nutrition or malnutrition; patients with extremes in muscle mass; health enthusiasts taking creatinine supplementation; vegetarians; patients with quadriplegia or paraplegia; and patients who have undergone amputations.2,9
Interpreting CrCl Values with Other Renal Parameters
As noted previously, the most common clinical uses for CrCl and SCr include
- Assessing kidney function in patients with acute or CKD
- Monitoring the effects of drug therapy on slowing the progression of kidney disease
- Monitoring patients on nephrotoxic drugs
- Determining dosage adjustments for renally eliminated drugs
Because the relationship between SCr and CrCl is inverse and geometric as opposed to linear (Figure 8-2), significant declines in CrCl may occur before SCr rises above the normal range. For example, as CrCl slows, SCr rises very little until more than 50% of the nephrons have become nonfunctional. Therefore, SCr alone is not a sensitive indicator of early kidney dysfunction.
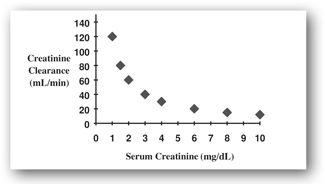
FIGURE 8-2. This plot represents the inverse relationship between SCr and CrCl. Relatively small changes in SCr at lower levels represent significant change in kidney function as assessed by CrCl.
Calculating CrCl from a Timed Urine Collection
Although shorter collection periods (3–8 hours) appear to be adequate and may be more reliable, CrCl is routinely calculated using a 12- or 24-hour urine collection.22 Creatinine excretion is normally 20–28 mg/kg/24 hr in men and 15–21 mg/kg/24 hr in women. In children, normal excretion (mg/kg/24 hr) should be approximately 15 + (0.5 × age), where age is in years.
Because its excretion remains relatively consistent within these ranges, UCr is often used as a check for the completion of the urine collection. In adults, some clinicians discount a urine sample if it contains less than 10 mg of creatinine/kg/24 hr; they assume that the collection was incomplete. However, 8.5 mg/kg/day might be a better cutoff, especially in critically ill elderly patients. Urine creatinine assays are affected by most of the same substances that affect SCr. To interfere significantly, however, the substance must appear in the urine in concentrations at least equal to those found in the blood.
Measured CrCl is calculated using the following formula:

where CrCl is the CrCl in mL/min/1.73 m2; UCr = urine creatinine concentration (mg/dL); V = volume of urine produced during the collection interval (mL); SCr = serum creatinine concentration (mg/dL); T = time of the collection interval (minutes), and BSA = body surface area (m2).
BSA can be estimated using the standard method of Dubois and Dubois:
(4) BSA (m2) = 0.20247 × height(m) 0.725 × weight(kg) 0.425
BSA also can be estimated using the following equations from Mosteller23:


Adjustment of CrCl to a standard BSA (1.73 m2) allows direct comparison with normal CrCl ranges since such tables are in units of milliliters per minute per 1.73 m2. The CrCl value adjusted for BSA is the number of milliliters cleared per minute for each 1.73 m2 of the patient’s BSA. Therefore, such adjustment in a large person (>1.73 m2) reduces the original nonadjusted clearance value since the assumption is that clearance would be lower if the patient were smaller. In practice, it is only important to adjust CrCl for BSA in patients who are much smaller or larger than 1.73 m2.
Estimation of CrCl
In practice, dosage recommendations for medications excreted through the kidney have been traditionally based on the Cockcroft-Gault estimation of CrCl and the corresponding dosing information in the product information. With the implementation of standardized reporting of creatinine values, calculated CrCl values may be 5% to 20% higher and may not correlate with dosage guidelines based on renal dose adjustments on creatinine values obtained from older assay methodologies.
Cockcroft-Gault Equation
This formula provides an estimation of CrCl.18 The patient’s age, total body weight (TBW), and SCr concentration are necessary for the estimation. Calculations of CrCl using standardized creatinine values will result in higher and less reliable estimations of renal function. There is some controversy regarding which patient weight to use in the formula. Few patients are close to their ideal body weight (IBW). There are weight adjustment formulas that have empirically attempted to improve the estimation of CrCl by calculating an adjusted body weight. Additional attempts to improve the Cockcroft-Gault equation such as rounding SCr to 1.0, using adjusted or lean body weight have all been attempted without clinical validation. This equation should be used cautiously in patients with unstable renal function.


Cockcroft-Gault IBW, where IBW (kg) =
(2.3 × inches >5 feet) + 50 (if male),
or (2.3 × inches >5 feet) + 45.5 (if female)
Cockcroft-Gault TBW= TBW for weight in CG equation
The National Kidney Foundation Kidney Disease Outcome Quality Initiative (KDOQI) guidelines recommend use of either the Schwartz or Counahan-Barratt equations to estimate kidney function in patients less than 12 years of age.9 The Schwartz equation provides an estimation of CrCl whereas the Counahan-Barratt equation provides an estimation of the GFR. The older version of the Schwartz equation was derived from inulin clearance and measured creatinine concentrations, which could overestimate the true value.24,25 The Schwartz equation has been recently modified to integrate the newer standardized SCr values.26,27 The bedside formula may be more practical since the majority of clinical laboratories may not be able to report cystatin C values in a timely manner. The Counahan-Barratt equation was developed using 51Cr-EDTA plasma clearance.10 Both equations are imprecise to some degree; however, they represent a more practical alternative than using SCr alone. There is a clear need for a more precise formula for estimating kidney functions in the pediatric population.4
Bedside IDMS-traceable Schwartz equation26:
(9) GFR (mL/min/1.73m2) = (0.413 × Height (cm)/serum creatinine (mg/dL)
IDMS-traceable Schwartz equation26:
(10) GFR (mL/min/1.73m2) = 39.1 [(height (m)/SCr (mg/dL)]0.516 × [(1.8/cystatin C (mg/L)0.294 [30/BUN (mg/dL)]0.169 [1.099]male [height (m)/1.4)0.188
Counahan-Barratt equation10:
(11) GFR (mL/min/1.73m2) = 0.43 [(height (cm)/SCr (mg/dL)]
In a prospective cohort study in critically ill children, urine neutrophil gelatinase-associated lipocalcin (uNGAL) has exhibited promise as an early signal of acute kidney insult when compared to SCr alone.28 Future research may validate or better define the usefulness of this biomarker, which is currently limited to research facilities.
Estimation of GFR—MDRD Equation
The MDRD equation had been developed as a tool to identify those patients at risk for complications arising from CKD.9,29 See Table 8-2 for the stages of chronic kidney disease. Estimated GFR values less than 60 mL/min/1.73 m2 are considered to be consistent with kidney disease. The MDRD equation provides an estimated GFR, which was developed using measured GFR I-Iothalamate reference values. The original MDRD equation accounted for urea and albumin concentrations but the KDOQI guidelines recommend that clinical laboratories report the estimated GFR as calculated using the abbreviated MDRD equation.9 Patients at age extremes may be particularly vulnerable to errors of estimated GFR.4,8 The abbreviated MDRD equation has been re-expressed to include standardized SCr traceable to IDMS values.6,20,30–32 Validation in clinical trials in special populations, pediatric, geriatric, and obese patients may be warranted before further applicability and clinical use. In addition, results of the MDRD equation should be interpreted cautiously in patients with low muscle mass (e.g., cachectic patients). One limitation identified with the MDRD equation that is well known is the underestimation of renal function for patients with eGFR greater than 60 mL/min/1.73 M2.33 This can lead to more patients being falsely identified with CKD.
GFR = glomerular filtration rate.
Abbreviated MDRD using revised calibration for SCr:
(12) GFR (mL/min/1.73 m2) = 175 × standardized SCr -1.154 × age -0.203 × 1.210 (if African American) × 0.742 (if female)
Estimation of GFR—CKD Epidemiology Collaboration Creatinine Equation
Introduced in 2009, the CKD-EPI (CKD-EPI) equation also based upon standardized SCr, age, sex, and race. This equation performs with the same degree of accuracy as the MDRD equation for patients with eGFR less than 60 mL/min/1.73M2.34,35 However, it corrects the inadequacy of the MDRD, which leads to underestimations in those patients with eGFR greater than 60 mL/min/1.73 M2. Both the CKD-EPI and the MDRD equation account for the age of the patient. Like all SCr-based equations, Cockcroft-Gault, MDRD, and CKD-EPI succumb to the same inherent problems associated with this endogenous surrogate marker. At the same SCr, younger patients who have more muscle mass will have a higher GFR than older adults with low muscle mass. Clinical labs may begin reporting eGFR based upon CKD-EPI rather than MDRD.36 The usefulness of the CKD-EPI may be particularly evident in younger patients without kidney disease, younger type 1 diabetics without microalbuminuria, or those considering kidney donation with GFR rates approximating normal values. The CKD-EPI equation may eventually replace the MDRD equation in clinical practice.
CKD-EPI equation34,35:
(13) GFR (mL/min/1.73 M2) = 141 × min (Sc/κ,1)α × max
(Sc/κ, 1)–1.209 × 0.993age × 1.018 (if female) × 1.159
(if African American)
Sc = standardized serum creatinine
κ= 0.7 for females and 0.9 for males
α= –0.329 for females and –0.411 for males
min indicates the minimum of Sc/κ or 1
max indicates the maximum of Sc/κ or 1
Estimating Equations for GFR
HENRY G., A 30-YEAR-OLD MAN (non-African American), has a significant history for diabetes mellitus type 1.
Laboratory tests were as follows:
Sodium, 140 mEq/L (136–145 mEq/L)
Potassium, 4.5 mEq/L (3.5–5.0 mEq/L)
Chloride, 101 mEq/L (96–106 mEq/L)
Carbon dioxide, 28 mEq/L (24–30 mEq/L)
Magnesium, 2.0 mEq/L (1.5–2.2 mEq/L)
Glucose, 98 mg/dL (70–110 mg/dL)
BUN, 12 mg/dL (8–20 mg/dL)
SCr, 1.45 mg/dL (0.7–1.5 mg/dL)
Question: Why would his eGFR vary between the MDRD and CKD-EPI estimating equations?
Discussion: Using the MDRD and CKD-EPI equations, the calculated eGFR for Henry G. are 57 mL/min/1.73 M2 (stage III CKD) and 64 mL/min/1.73 M2 (stage II CKD), respectively. First, it has to be recognized that the study equations were developed in different populations. The MDRD was developed in patients with CKD (average eGFR 40 mL/min/1.73 M2) and the CKD-EPI in more diverse patients with and without kidney disease (average eGFR 68 mL/min/1.73 M2). In a recent systematic review, inherent biases were identified in both equations. The MDRD exhibited more bias at eGFR greater than 60 mL/min/1.73 M2 and the CKD-EPI at eGFR less than 60 mL/min/1.73 M2. One universal equation has not been found to be optimal for all populations or ethnic populations. The CKD-EPI equation may permit more effective utilization of resources by better identification of those patients who should be under the care of a nephrologist.37
Clinical Controversy: Cockcroft-Gault Versus MDRD for Drug Dosing
The appropriate dosing of renally eliminated medications is necessary to prevent overdosage or underdosage of medications. Overdosage of a medication can cause significant clinical consequence and contribute to poor patient outcomes. Similarly, underdosing medications can lead to therapeutic failures. In both scenarios, inappropriate medication dosing can lead to increased length of stay, higher healthcare costs, and preventable medication-related problems. The MDRD equation provides a more accurate estimation of kidney excretory function than the Cockcroft-Gault equation.6,30,38 At this time, the optimal single best equation that can be used universally in all populations does not exist. The usefulness of the MDRD equation in staging kidney disease is indisputable. Recently, manufacturers have provided some dosage guidance based upon eGFR for patients with deteriorating kidney function. Recent studies support the agreement of the MDRD equation with measured GFR and FDA assigned kidney function categories for medication dose adjustment.39 The National Kidney Disease and Education Program in 2009 has suggested the use of either the CrCl as estimated by Cockcroft-Gault or the eGFR for dosing medications in CKD for most patients.40 The eGFR needs to be individualized in patients at the extremes in body size by multiplying the eGFR/1.73 M2 by the patients’ body surface area (BSA) to convert units to mL/min:
(14) Individualized MDRD=eGFR/1.73 m2 × estimated BSA (m2) = eGFR for drug dosing
Alternatively, in patients who are considered to be high risk for adverse medication events, in patients who are taking drugs that have a narrow therapeutic index, or where estimations of kidney function vary or are inaccurate, consider measuring CrCl or GFR using exogenous markers.40 The Nephrology Practice and Research Network of the American College of Clinical Pharmacy (ACCP) has suggested an algorithm for dosing medications eliminated by the kidneys using SCr-based equations.41 Additionally, safety and efficacy considerations affect decisions regarding dosing of renally eliminated medications that include both patient factors (clinical condition, cachexia) and drug specifics properties (therapeutic index). In summary, clinical assessment of the benefits and risks will continue to provide dosing recommendations for patients with kidney impairment.
URINALYSIS
Urinalysis is a commonly used clinical tool for the evaluation of various renal and nonrenal problems (e.g., endocrine, metabolic, and genetic). A routine urinalysis is done as a screening test during many hospital admissions and initial physician visits. It is also performed periodically in patients in nursing homes and other settings. The most common components of the urinalysis are discussed here.
An accurate interpretation of a urinalysis can be made only if the urine specimen is properly collected and handled. Techniques are fairly standardized and, keeping in mind that urine is normally sterile, aim to avoid contamination by normal flora of the external environment (mucous membranes of the vagina or uncircumcised penis or by microorganisms on the hands). Therefore, these areas are cleansed and physically kept away from the urine stream. During menses or heavy vaginal secretions, a fresh tampon should be inserted before cleansing. A first-morning, midstream collection is customarily used as the specimen.42
Once voided, the urine should be brought to the laboratory as soon as possible to prevent deterioration. If the sample is not refrigerated, bacteria multiply and use glucose (if present) as a food source. Subsequently, glucose concentrations decrease and ketones may evaporate with prolonged standing. Another problem is that formed elements (see Microscopic Analysis section) begin decomposing within 2 hours. With excessive exposure to light, bilirubin and urobilinogen are oxidized. Unlike other substances, however, protein is minimally affected by prolonged standing.
Heart Failure
RUTH K., AN 83-YEAR-OLD FEMALE with a long history of congestive heart failure, was admitted to Community Hospital with complaints of shortness of breath (she needed to sleep in her recliner and was unable to sleep in her bed despite using two pillows), 15-pound weight gain, and fluid retention in her lower extremities. She also had anorexia, nausea, fatigue, and weakness. All had worsened over the past 2 weeks.
PMH: hypertension, osteoarthritis, atrial fibrillation
Physical examination revealed a frail (5’3″; 78 kg) woman in moderate distress; heart rate of 108 BPM; BP of 96/60 mm Hg; S3/S4 heart sounds; + three pitting edema bilateral lower extremities. Chest x-ray reveals bilateral pleural effusions.
Current medications:
Lisinopril, 20 mg PO daily
Metoprolol succinate, 100 mg PO daily
Furosemide, 40 mg PO daily
KCl, 10 mEq PO BID
Ibuprofen, 400 mg PO 4 times daily PRN for knee pain
Laboratory tests were as follows:
Sodium, 130 mEq/L (136–142 mEq/L)
Potassium, 3.2 mEq/L (3.8–5.0 mEq/L)
Chloride, 96 mEq/L (95–103 mEq/L)
Carbon dioxide, 30 mEq/L (24–30 mEq/L or mmol/L)
Magnesium, 1.3 mEq/L (1.3–2.1 mEq/L)
Glucose, 78 mg/dL (70–110 mg/dL)
Hemoglobin (Hgb), 11.5 g/dL (12.3–15.3 g/dL)
BUN, 76 mg/dL (8–23 mg/dL)
SCr, 2.5 mg/dL (0.6–1.2 mg/dL)
Urinalysis: normal
BNP: 1200 pg/mL (<100 pg/mL)
Over the next 2 days, Ruth K. received aggressive diuretic therapy (furosemide 80 mg IV twice a day), and all electrolyte abnormalities were corrected. Her physical exam was much improved. She was no longer short of breath. On the morning of day 4, her test results were
Sodium, 135 mEq/L
Potassium, 3.2 mEq/L
Chloride, 100 mEq/L
Carbon dioxide, 34 mEq/L
Magnesium, 1.4 mEq/L Glucose, 80 mg/dL
Hgb, 11.4 g/dL
BUN, 35 mg/dL
SCr, 1.4 mg/dL
BNP, 400 pg/mL
Question: What type of renal dysfunction was Ruth K. experiencing on admission to the hospital? What were the likely causes of her elevated BUN and SCr? How often should BUN and SCr be interpreted?
Discussion: This case is rather complex because of the involvement of the kidneys in heart failure. Initially, the elevated BUN and SCr could be attributed to a prerenal state secondary to increased edema (hypervolemia) caused by worsening heart failure. This is supported by her clinical presentation (weight gain, symptoms of heart failure, CXR, elevated BNP, and an elevated BUN:SCr ratio with a ratio of greater than 20:1. The urinalysis did not reveal any cells that might indicate an intrinsic acute kidney injury (see Urinalysis section). In addition, diuretics may increase the BUN, which may complicate the picture, but the other evidence supports the diagnosis of prerenal azotemia. Assessment of kidney function on day 1 is difficult since the Cockcroft-Gault, MDRD, or CKD- EPI equations should not be used in patients with acute alterations in kidney function. In suspected acute kidney injury and when there is a need to assess GFR, measurement of CrCl through collection of urine should be considered.
Question: What was the trigger of Ruth K.’s heart failure?
Discussion: Ruth K. has several risk factors that can worsen heart failure. She has a history of hypertension and atrial fibrillation. She may have been using more ibuprofen more frequently and for an extended period for increased osteoarthritic knee pain. Additional risk factors that could also contribute to exacerbation of heart failure include noncompliance with fluid restriction (2 liters) and diet (2 g sodium/day).
Question: What other electrolyte abnormalities resulted?
Discussion: There are several electrolyte abnormalities identified during initial presentation and then subsequent lab analysis: increased BUN and SCr, increased serum bicarbonate, hypokalemia, hypomagnesemia, and hyponatremia. On admission, worsening heart failure resulted in decreased RBF. As with creatinine, there will be a reduction in BUN filtration at the glomerulus; however, urea is avidly reabsorbed in the proximal tubule (following sodium and water) resulting in an elevated ratio of BUN out of proportion to the creatinine (>20:1). Ruth K. also presented initially with hypervolemic hyponatremia. This most likely caused by the worsening heart failure, diminished blood flow to the kidney, and peripheral edema and subsequent weight gain. As Ruth K. becomes euvolemic, the hyponatremia will gradually be corrected. After aggressive diuresis with IV furosemide, hypokalemia and hypomagnesemia required replacement therapy. Loop diuretics can also cause metabolic alkalosis (increased serum bicarbonate). Overaggressive diuresis can cause elevations in BUN and SCr without evidence of overt heart failure.
Stay updated, free articles. Join our Telegram channel

Full access? Get Clinical Tree


