FIGURE 11-1. Blood flow through the heart and the pulmonary and systemic circulations.
The functional unit of the heart is comprised of a network of noncontractile cells that form the conduction system, which is responsible for originating and conducting action potentials from the atria to the ventricles. This leads to the excitation and contraction of the cardiac muscle, which is responsible for the pumping of the blood to the other organs.
The normal adult human heart contracts rhythmically at approximately 70 beats per minute (bpm). Each cardiac cycle is divided into a systolic and diastolic phase. During each cycle, blood from the systemic circulation is returned to the heart via the veins, and blood empties from the superior and inferior vena cavae into the right atrium. During the diastolic phase, blood passively fills the right ventricle through the tricuspid valve with an active filling phase by atrial contraction just prior to end-diastole. During systole, blood is then pumped from the right ventricle through the pulmonary artery to the lungs where carbon dioxide is removed and the blood is oxygenated. From the lungs, blood returns to the heart via the pulmonary veins and empties into the left atrium. Again, during diastole, blood empties from the left atrium through the mitral valve into the main pumping chamber, the left ventricle. With systole the left ventricle contracts and blood is forcefully propelled into the peripheral circulation via the aorta (Figure 11-1). At rest, the normal heart pumps approximately 4–6 L of blood per minute. Maintaining normal cardiac output (CO) is dependent on the heart rate (HR) and stroke volume (SV).
CO = HR × SV
The SV, defined as the volume of blood ejected during systole, is determined by intrinsic and extrinsic factors including myocardial contractility, preload, and afterload. The coronary arteries, the arteries supplying the heart muscle, branch from the aorta just beyond the aortic valve and are filled with blood primarily during diastole. The major coronary arteries are depicted in Figure 11-2. In the face of increased myocardial metabolic needs, the heart is able to increase coronary blood flow by vasodilation to meet myocardial oxygen demand.
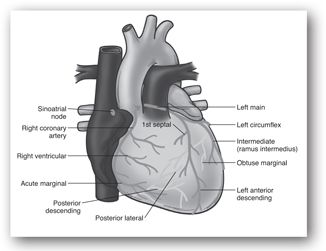
FIGURE 11-2. Major coronary arteries and their principal branches.
Cardiac Dysfunction
Decreased CO compromises tissue perfusion, and depending on the severity and duration, may lead to significant acute and chronic complications. A number of cardiac diseases lead to decreased CO, including hypertensive heart diseases, heart failure, valvular heart diseases, congenital heart diseases, diseases of the myocardium, conduction abnormalities, CAD, and ACS. This chapter focuses on the various tests used in the diagnosis and assessment of patients presenting with CAD, ACS, and heart failure.
Also known as ischemic heart disease (IHD), CAD is caused by atherosclerosis of the coronary arteries, resulting in lumen narrowing and blood flow reduction to the myocardium perfused by the affected artery. This leads to tissue ischemia and chest pain. Severe reduction in or total interruption of blood flow may lead to severe tissue ischemia or infarction, resulting in a clinical presentation as a type of ACS.
Patients with severe symptoms of myocardial ischemia or acute myocardial infarction (AMI) may be experiencing one of three types of ACS: unstable angina (UA), non-ST-segment elevation MI (NSTEMI), or ST-segment elevation MI (STEMI). The most common cause for ACS is atherosclerotic plaque rupture and subsequent obstruction of the coronary lumen by thrombosis composed of platelet aggregates, fibrin, and entrapped blood cells leading to myocardial ischemia. When a coronary artery is occluded, the location, extent, rate, and duration of occlusion determine the severity of myocardial ischemia resulting in UA, NSTEMI, or STEMI.
According to the universal definition of myocardial infarction (MI), MI may be classified clinically into different types1:
- Type 1: Spontaneous MI related to ischemia due to a primary coronary event such as plaque erosion and/or rupture, fissuring, or dissection
- Type 2: Myocardial infarction secondary to ischemia due to either increased oxygen demand or decreased supply (e.g., coronary artery spasm, coronary embolism, anemia, arrhythmias, hypertension, or hypotension)
- Type 3: Sudden unexpected cardiac death, including cardiac arrest, often with symptoms suggestive of myocardial ischemia accompanied by presumably new ST elevation or new left bundle branch block (LBBB), or evidence of fresh thrombus in a coronary artery by angiography and/or autopsy, but death occurring before blood samples could be obtained, or at a time before the appearance of cardiac biomarkers in the blood
- Type 4a: Myocardial infarction associated with percutaneous coronary intervention (PCI)
- Type 4b: Myocardial infarction associated with stent thrombosis as documented by angiography or at autopsy
- Type 5: Myocardial infarction associated with coronary artery bypass graft (CABG)
Complications of AMI include cardiogenic shock, congestive heart failure (CHF), ventricular and atrial arrhythmias, ventricular rupture or ventricular septal defect formation, cardiac tamponade, pericarditis, papillary muscle rupture, mitral regurgitation, and embolism. Initial assessment of the patient presenting with ACS may be complicated by the presence and severity of the above complications.
Heart failure is a syndrome in which the heart is unable to pump blood at a rate sufficient to meet the demands of the body or unable to accept the fluid volume with which it is presented. Heart failure may be due to reduced systolic (ventricular contraction) function defined as left ventricular ejection fraction (LVEF) less than 50%. Common etiologies for systolic heart failure include CAD, ACS, valvular diseases, or long-term hypertension. A substantial number of patients with heart failure have preserved LVEF. Those with preserved LVEF and abnormal diastolic function (abnormal relaxation, filling or stiffness) are diagnosed with diastolic heart failure.2 Signs and symptoms consistent with heart failure may be attributed to volume overload and congestion (e.g., elevated jugular venous pressure, peripheral edema, pulmonary congestion and edema, and dyspnea) and/or hypoperfusion (e.g., tachycardia (HR >100 bpm), cold extremities, cyanosis, and fatigue).
ELECTROCARDIOGRAPHY
Electrocardiography is the recording of the electrical activity of the heart on an electrocardiogram (ECG).
Normal Conduction System and Electrocardiogram Recording
The conduction system is composed of specialized, noncontractile cells that serve to originate and conduct action potentials in the appropriate sequence and at an appropriate rate from the atria to the ventricles. At rest, the cardiac cells are more negatively charged intracellularly than extracellularly, or polarized, with a voltage difference of 60–90 mV. When excited, ionic currents across cell membranes lead to charge shifting where the interior of the cells become more positive (depolarization) and an action potential is generated. Calcium influx leads to the excitation-contraction coupling of the cells. Subsequently, the action potential is propagated and the cells return to a normal resting state (repolarization). Depolarization is the electrical phenomenon that leads to myocardial contraction, and repolarization is the electrical phenomenon that leads to myocardial relaxation. The ECG provides a pictorial presentation of the depolarization and repolarization of atrial and ventricular cells that can be assessed by reviewing a number of waves and intervals.
Normally, an electrical impulse originates in the sinoatrial (SA) node and is propagated through Bachmann bundle and internodal tracts, the atrioventricular (AV) node, His bundle, the left and right bundle branches, and the Purkinje fibers resulting in one cardiac cycle. Each cardiac cycle is presented on ECG by the P wave reflecting atrial depolarization, the QRS complex reflecting ventricular depolarization, and the T wave reflecting ventricular repolarization (Figure 11-3). By placing multiple leads on the patient, the electrical impulses of the heart are recorded from different views. The standard ECG is composed of 12 leads: six limb leads (I, II, III, AVR, AVL, and AVF) and six chest leads (V1–V6). Different leads provide specific information on different aspects of heart chambers and coronary arteries.
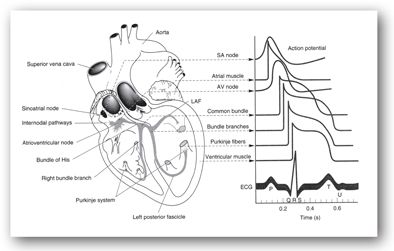
FIGURE 11-3. Conduction system of the heart. Typical transmembrane action potentials for the sinoatrial (SA) and atrioventricular (AV) nodes, other parts of the conduction system, and the atrial and ventricular muscles are shown along with the correlation to the extracellularly recorded electrical activity (i.e., the electrocardiogram [ECG]). The action potentials and ECG are plotted on the same time axis but with different zero points on the vertical scale. The PR interval is measured from the beginning of the P wave to the beginning of the QRS. (LAF, left anterior fascicle.) (Reproduced with permission from Kusumoto F. Cardiovascular disorders: heart disease. In: McPhee SJ, Lingappa VR, Ganong WF, et al. Pathophysiology of Disease: An Introduction to Clinical Medicine. 3rd ed. New York, NY: McGraw-Hill; 2000.)
Electrocardiographic Findings in Acute Coronary Syndrome
In patients with ACS, the ECG is an essential diagnostic tool providing immediate and invaluable data vital for expeditious diagnosis, prognosis, and management. A 12-lead ECG should be obtained within 10 minutes of a patient’s presentation to the emergency department if ACS is suspected. Careful reading of the ECG by an experienced clinician provides information on the presence of myocardial ischemia, injury, or infarction. The leads in which ECG changes consistent with ACS occur provide information on the occluded coronary artery most likely causing the ischemia or infarction (Table 11-1).
CX = circumflex branch of the left coronary artery; ECG = electrocardiogram; LAD = left anterior descending artery; RCA = right coronary artery.
The classic ECG changes consistent with acute presentation of myocardial ischemia or infarction are (1) T-wave inversion, (2) ST-segment elevation, and (3) ST-segment depression (Figure 11-4). Q waves, defined by a width of greater than 1 mm and a depth of greater than 25% of the QRS complex height, are also indicative of MI and loss of electrically functioning cardiac tissue. Pathologic Q waves may appear within 1–2 hours of onset of symptoms, often 12 hours, and, occasionally, up to 24 hours.3 Among patients presenting with ST-segment elevation, most ultimately develop a Q-wave MI (QwMI) whereas most patients presenting with NSTEMI ultimately develop a non-Q wave MI (NQMI).4
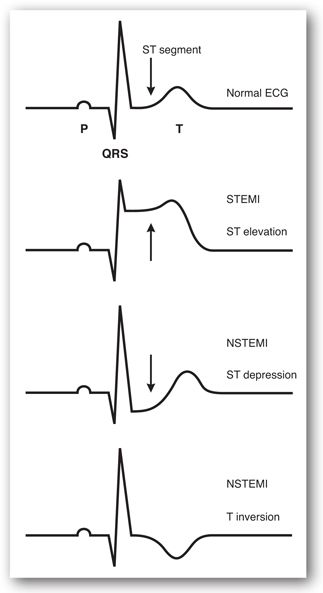
FIGURE 11-4. ECG changes consistent with STEMI and NSTEMI.
Electrocardiogram manifestations of non-ST elevation ACS are ST depression and or T-wave inversion without ST segment elevation or pathologic Q waves. Electrocardiogram criteria for the diagnosis of ST elevation MI (in the absence of LBBB and left ventricular hypertrophy [LVH]) include ≥2 mm of ST segment elevation in the two contiguous leads for men and ≥1.5 mm for women (who tend to have less ST elevation) in leads V2-V3 and/or ≥1 mm in other leads. Criteria for ST depression include ≥0.5 mm horizontal or down-sloping ST depression and/or T inversion of ≥1 mm in two contiguous leads with prominent R-wave or R/S ratio >1.1
During an acute STEMI, the EKG evolves through three stages:
- T-wave peaking with subsequent T-wave inversion (with the onset of infarction, the T waves become hyperacute or tall and narrow, commonly known as “peaking.” Shortly thereafter, usually within hours, the T waves invert. T wave changes are reflective of myocardial ischemia, but they are not indicative of myocardial infarct.
- ST-segment elevation signifies myocardial injury, likely reflecting a degree of cellular damage beyond that of mere ischemia; however, this is potentially reversible. A more reliable sign that is diagnostic of true infarction. Persistent ST segment elevation may indicate other cardiac injury such as ventricular aneurysm.
- Appearance of new Q-waves that are indicative of irreversible myocardial cell death (diagnostic of an MI).
Any one of these changes may be present without any of the others.
In addition to diagnosing ACS, ECG findings provide prognostic information. Patients presenting with UA/NSTEMI who experience angina at rest with transient ST-segment changes greater than 0.05 mm, new or presumed bundle-branch block, or sustained ventricular tachycardia are at high risk of short-term death or nonfatal MI.4
LABORATORY TESTS USED IN THE EVALUATION OF ACUTE CORONARY SYNDROME
Three criteria for the diagnosis of AMI were identified by the World Health Organization and, subsequently, modified by the Global Task Force for the Redefinition of Myocardial Infarction, convened by the European Society of Cardiology, the American College of Cardiology (ACC), the American Heart Association (AHA), and World Heart Federation (WHF), to include clinical presentation, electrocardiography, and elevated biochemical markers of myocardial necrosis.1,5
Clinical presentation does not distinguish among UA, NSTEMI, and STEMI. The ECG differentiates between NSTEMI and STEMI. Unstable angina/non-ST-segment elevation MI (NSTEMI) is defined by ST-segment depression or prominent T-wave inversion and/or positive biomarkers of necrosis (e.g., troponin) in the absence of ST-segment elevation and in an appropriate clinical setting (chest discomfort or anginal equivalent).1 The distinction between UA and NSTEMI is ultimately made on the basis of the absence or presence, respectively, of biochemical cardiac markers in the blood. The release of detectable quantities of biochemical markers in the peripheral circulation indicates myocardial injury and is more consistent with MI than UA. Markers are detected in the peripheral circulation within a few hours after the initial insult in NSTEMI and STEMI.
In the era of reperfusion therapy, diagnosing ACS accurately and without delay is crucial for risk stratification and appropriate, life-saving treatment implementation. This section describes the laboratory tests used in the diagnosis of ACS. Special emphasis is placed on cardiac biomarkers. Other noncardiac-specific tests are presented briefly.
Biochemical Cardiac Markers
Infarction of myocardial cells disrupts membrane integrity, leaking intracellular macromolecules into the peripheral circulation where they are detected. The criteria of an ideal biochemical marker for the diagnosis of ACS include the following5:
- High specificity: present in high concentrations in the myocardial tissues and absent from nonmyocardial tissue
- High sensitivity: detects minor injury to the myocardium
- Release and clearance kinetics provide expedient and practical diagnosis:
- Rapidly released into the blood after injury to facilitate early diagnosis
- Persists for sufficient time to provide convenient diagnostic time window
- Rapidly released into the blood after injury to facilitate early diagnosis
- Measured level of the marker is in direct proportional relationship to the extent of myocardial injury.
- Assay technique is commercially available and is easy to perform, inexpensive, and rapid.
Several biochemical cardiac markers are used in the diagnosis and evaluation of ACS. The cardiac-specific troponins have a number of attractive features and have gained acceptance as the biochemical markers of choice in the evaluation of patients with ACS.1,4,6,7
Cardiac-Specific Troponin I
Diagnostic level: ≥0.30 ng/mL (assay dependent)
Cardiac-Specific Troponin T
Diagnostic level: ≥0.1 ng/mL (assay dependent)
Troponin is a protein complex consisting of three subunits: troponin C (TnC), troponin I (TnI), and troponin T (TnT). The three subunits are located along thin filaments of myofibrils, and they regulate Ca+2-mediated interaction of actin and myosin necessary for the contraction of cardiac muscles. Troponin C binds Ca+2, TnI inhibits actomyosin ATPase, and TnT attaches to tropomyosin on the thin filaments. The TnC expressed by myocardial cells in cardiac and skeletal muscle is identical. On the contrary, TnI and TnT expressed by cardiac cells are encoded by distinct genes different from those in skeletal muscle cells. Distinct amino acid sequences between the two isoforms allow for specific antibody development without cross-reactivity. Monoclonal antibody-based immunoassays have been developed to detect cardiac-specific TnI (cTnI) and cardiac-specific TnT (cTnT). Quantitative and qualitative assays are commercially available.
Cardiac-specific TnI and cTnT are highly specific and sensitive for MI.8–10 Following myocardial injury, serum cTnI and cTnT begin to rise above the upper reference limit within 3–12 hours, peak in 24 hours (cTnI) or 12 hours to 2 days (cTnT), and return to normal in 5–10 days (cTnI) or 5–14 days (cTnT) (Table 11-2). The initial rise of troponin is due to the release of cytoplasmic troponin whereas the later sustained rise is due to the release of complexed troponin from disintegrating myofilaments (Figure 11-5).11 Troponins are most beneficial in identifying AMI 6 hours or more after symptom onset. Patients with normal serum levels at presentation should be reassessed between 6–12 hours after onset of symptoms if the clinical index of suspicion is high.7 Levels typically increase more than 20 times above the reference limit. The prolonged time course of elevation of cTnI and cTnT is useful for the late diagnosis of AMI.
CK-MB = creatinine kinase isoenzyme MB; cTnI = cardiac-specific troponin I; cTnT = cardiac-specific troponin T.
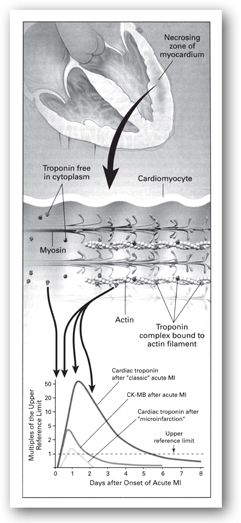
FIGURE 11-5. Release of cardiac troponins in AMI. The zone of necrosing myocardium is shown at the top of the figure, followed in the middle portion of the figure by a diagram of a cardiomyocyte that is in the process of releasing biomarkers. Most troponin exists as a tripartite complex of C, I, and T components that are bound to actin filaments, although a small amount of troponin is free in the cytoplasm. After disruption of the sarcolemmal membrane of the cardiomyocyte, the cytoplasmic pool of troponin is released first (left-most arrow in bottom portion of figure), followed by a more protracted release from the disintegrating myofilaments that may continue for several days (three-headed arrow). Cardiac troponin levels rise to about 20–50 times the upper reference limit (the 99th percentile of values in a reference control group) in patients who have a classic AMI and sustain sufficient myocardial necrosis to result in abnormally elevated levels of the MB fraction of creatine kinase (CK-MB). Clinicians can now diagnose episodes of microinfarction by sensitive assays that detect cardiac troponin elevations above the upper reference limit, even though CK-MB levels may be still in the normal reference range. (Reproduced with permission from reference 11.)
Two cutoff limits for interpreting levels of troponin have been identified: (1) upper reference limit defined as the 97.5th percentile of the values measured in normal controls without myocardial necrosis, and (2) AMI decision limit defined as a level of troponin measurement consistent with AMI, as defined by the World Health Organization and on the basis of the creatine kinase isoenzyme MB (CK-MB). Later, a standardized upper reference limit was defined as an abnormally increased level of cTnI and cTnT exceeding that of 99% of a reference control group.12
Several analytical factors should be considered with troponin assays. The first-generation troponin assay T ELISA was limited by lack of specificity to cardiac troponin and long turnaround time (90 minutes at 20°C and 45 minutes at 37°C). Second-generation troponin assay T ELISA was improved by changing the antibody detected to the cardiac-specific antibody M11.7, resulting in enhanced specificity.13 The currently available third-generation assay (Elecsys, Roche Diagnostics) uses recombinant human cardiac troponin T as standard material enabling reproducibility and standardization of cTnT assays with a normal cutoff concentration of 0.1 mcg/L and a turnaround time of 9–12 minutes.14
In contrast to cTnT, cTnI assays lack the standardization between multiple commercially available assays developed by different manufacturers. A number of factors complicate the standardization of the assays including (1) cTnI released from disintegrating myocytes may be free cTnI, complexed with cTnC, or a combination of the two forms as well as free-cTnI degradation products; (2) the different forms undergo oxidation, phosphorylation, and proteolysis after release from cells; and (3) the differences in the matrices used and the commutability from an artificial matrix to a physiologic one.15 Despite these differences, most commercial immunoassays measure cTnI. Contemporary cTnI assays have an analytical sensitivity almost 100-fold higher than that of the first available commercial assays. Different specificities of the antibodies used for detecting free and complexed cTnI may lead to variations in the cutoff concentration or abnormal levels of cTnI in the available immunoassays. Considerable variation (up to 20-fold) in cTnI levels may be observed when measured by different methods causing ambiguity in clinical interpretation.16–19
Commercially available troponin assays vary widely in lower detection limits, upper reference limits, diagnostic cut points, and assay imprecision (coefficient of variation). The upper reference limit is established by each laboratory and is set at the 99th percentile of normal population. An increased value for cardiac troponin is defined as a measurement exceeding the 99th percentile of a reference control group. Acceptable imprecision at the 99th percentile for each assay is defined as less than or equal to 10.12 However, not all commercially available assays can achieve this precision level. Thus, when interpreting results, clinicians should employ the upper reference limit and AMI diagnostic cutoff values for the particular assay used in each institution’s laboratory. Table 11-3 provides an example of one institution’s interpretive data for cTnI.
MI = myocardial infarction.
Cardiac troponins have been endorsed internationally as the standard biomarkers for the detection of myocardial injury, diagnosis of MI, and risk stratification in patients with suspected ACS.4,20 Significant prognostic information may be inferred from troponin levels. In a study of patients presenting to the emergency department with chest pain, negative qualitative bedside testing of cTnI and cTnT was associated with low risk for death or MI within 30 days (event rates of 0.3 and 1.1, respectively).21 Other large, clinical trials have documented that elevated troponin levels are strong, independent predictors of mortality and serious adverse outcome 30–42 days after ACS.22-26 Troponin levels should always be used in conjunction with other clinical findings. In one study, in-hospital mortality was as high as 12.7% in a troponin-negative subgroup of patients with ACS.27
High-sensitivity troponin I (hsTnI) and troponin T (hsTnT) assays have been developed to increase the clinical sensitivity for detection of myocardial injury. However, no consensus exists on how to define a “high-sensitivity assay,” in analytical or clinical terms.28,29 Studies suggest that high-sensitivity troponins may enhance early diagnosis of AMI. In one study, hsTnT was superior to TnT but equivalent to third-generation TnI for the diagnosis of AMI. High-sensitivity TnT was the most likely assay to be elevated at baseline. The study also showed that changes in troponin levels (delta troponin) increases specificity but reduces sensitivity.30 Another study comparing hsTnI (Architect STAT hsTnI assay, Abbott Diagnostics) and cTnI (Architect STAT cTnI assay, Abbott Diagnostics) revealed that measurement at three hours after admission may help rule out AMI. Troponin measured using either assay was superior to other biomarkers (including CK and CK-MB) in ruling in or ruling out AMI. The sensitivity and negative predictive value of the hsTnI assay were higher than the cTnI assay at admission (82.3% and 94.7% versus 79.4% and 94.0%, respectively); however, the negative predictive value of both assays was 99.4% at 3 hours. For patients with detectable troponin on admission (using the 99th percentile diagnostic cutoff value) and a 250% increase in troponin at 3 hours, the probability of AMI was 95.8%.31 The use of hsTnI assay in early diagnosis of AMI in patients presenting soon after symptom onset is currently in clinical use in Europe.20 The clinical use of delta troponin in addition to troponin levels may further enhance diagnostic accuracy. Studies have evaluated delta troponin using high-sensitivity troponin assays in patients presenting with AMI, with promising findings.30,32,33 High-sensitivity troponin assays are not commercially available in the United States, and their role over contemporary assays is being debated. Further investigation is needed before they are incorporated into clinical practice.
A number of cardiac and noncardiac conditions have been reported to cause detectable serum levels of troponins in the absence of ACS (Table 11-4).34-36 The use of cardiac troponin levels in patients with renal dysfunction has been controversial.37–40 Most data indicate that cTnI is highly specific, but it should be considered as a useful but an imperfect marker in patients with renal insufficiency and end-stage renal disease.37 In patients with end-stage renal disease and no evidence of acute myocardial necrosis, less than 10% will have elevated cTnI and a significantly higher number will have elevated cTnT. This is thought to be due to silent subendocardial ischemia, decreased clearance, or other metabolic abnormalities. Regardless of cause, it is well-established that these patients with elevated cardiac troponin levels have a higher risk of mortality even in the absence of symptoms.39
Source: Adapted from references 34–36.
In high-risk patients with UA/NSTEMI undergoing PCI, cTnI re-elevation, defined as a postprocedural elevation >1 times admission levels, was associated with a significant increase in in-hospital and 6-month mortality.41 Another study showed elevated cTnI after successful PCI to be an independent predictor of mortality at 12 months in patients with chronic renal insufficiency (as defined by a serum creatinine of at least 1.8 mg/dL but not on dialysis). Patients with cTnI >3 times normal values were particularly at higher risk.42 A recent meta-analysis showed that troponin elevation after PCI was associated with increased mortality and that mortality or nonfatal MI was more likely to occur in patients with post-PCI troponin elevation.43
Normal range: males, 55–170 International Units/L or 919–2839 nmol sec/L; females, 30–135 International Units/L or 501–2254 nmol sec/L
Creatine kinase (CK) is an enzyme that stimulates the transfer of high-energy phosphate groups, and it is found in skeletal muscle, myocardium, and the brain. Circulating serum CK is directly related to the individual’s muscle mass.
Serum CK concentrations rise sharply 4–8 hours after the onset of chest pain associated with AMI, peak in 24 hours, and return to normal in 3–4 days. Maximum concentrations of CK may reach 5–7 times the normal values. Serial CK measurements following AMI provide excellent sensitivity (98%) but poor specificity (67%). Other causes for increased serum CK concentrations include any musculoskeletal injury or diseases, intramuscular (IM) injections, and a number of medications (Table 11-5).
AMI = acute myocardial infarction; CK = creatine kinase; HMG-CoA = 3-hydroxy-3-methylglutaryl-coenzyme A; IM = intramuscular.
Creatine Kinase Isoenzymes
Normal range: CK-MB ≤6.0 ng/mL
The enzyme CK is a dimer of two B monomers (CK-BB), two M monomers (CK-MM), or a hybrid of the two (CK-MB). The three isoenzymes are found in different sources: CK-BB, found in the brain, lungs, and intestinal tract; CK-MM, found primarily in skeletal and cardiac muscle; and CK-MB, found predominantly in the myocardium but also in skeletal muscle. Fractionation of total CK into three isoenzymes increases the diagnostic specificity of the test for AMI.
The CK-MB isoenzyme is most specific for myocardial tissue and has been used for the diagnosis of AMI. Serum CK-MB concentrations begin to rise 3–12 hours after the onset of symptoms, peak in 24 hours, and return to baseline in 2–3 days. Other causes for elevated CK-MB levels include trauma, skeletal muscle injury, or surgical procedures involving the small intestine, tongue, diaphragm, uterus, or prostate.44
Electrophoretic separation followed by fluorometric analysis of isoenzyme bands is used to determine the actual CK-MB concentration in International Units per liter (International Units/L). The cutoff for the upper limit of normal when the actual CK-MB concentration is determined ranges between is 5–25 International Units/L. Alternatively, CK-MB as a percentage of the total CK concentration is determined by dividing the CK-MB concentration by the total CK concentration. The cutoff for the upper limit of normal for this value is usually 3% to 6%. The diagnosis of AMI is strongly suggested when CK-MB as a percentage of total CK is greater than 5% or when the actual CK-MB concentration is greater than 10 International Units/L.
Laboratory artifacts may cause false-positive elevations of CK-MB. When using column chromatography assays, false-positive results may be caused by carryover of elevated CK-MM isoenzyme into fractions that normally contain CK-MB. In addition, variant isoenzymes that migrate as a band between CK-MM and CK-MB on electrophoresis may be interpreted as CK-MB on quantitative assays. These variants are usually due to immunoglobulin G complexed to CK-BB or to a mitochondrial source of CK, which differs slightly from cytoplasmic CK. An uncommon problem of qualitative electrophoretic assays is nonspecific fluorescence from other proteins (especially albumin), which may exhibit migration similar to that of other fractions.
Most laboratories currently use the newer CK-MB immunoassay using direct chemiluminometric technology. The assay measures the immunological activity of CK-MB using two monoclonal antibodies and reports the concentration in mass units (ng/mL) or SI units (nmol/L). The conversion formula is 1.0 ng/mL = 0.0125 nmol/L. These new monoclonal antibody immunoassay methodologies are highly sensitive and specific. Furthermore, they do not show the interferences common to earlier immunoassay or traditional electrophoretic and chromatographic methods.
When interpreting serum CK-MB levels, the timing of blood specimen collections in relation to the onset of symptoms must be assessed. Lack of absolute cardiac specificity (skeletal muscle, healthy persons) limits CK-MB interpretation. Other causes for elevated CK-MB levels are listed in Table 11-6 and are usually not associated with the typical rise and fall in serum levels as seen in AMI.45,46 To differentiate between cardiac and noncardiac sources of CK-MB elevation, the relative index (RI), or the ratio of CK-MB to total CK concentrations, can be used and is calculated using the following equation:
This index is usually calculated only when both total CK and CK-MB are elevated above the normal value. It is useful in differentiating MB released from cardiac versus skeletal muscle. An index greater than 5 indicates significant myocardial injury.
CK-MB Isoforms
Once CK-MB, also known as the CK-MB2 isoform while in the myocardial tissue, is released into the circulation following an AMI, it undergoes metabolism by lysine carboxypeptidase producing the more negatively charged isoform CK-MB1. In healthy individuals, the two isoforms are in equilibrium and the normal levels are 0.5–1 International Units/L for each isoform. One study showed that elevated CK-MB2 levels of >1.0 International Units/L and an increased ratio of CK-MB2 to CK-MB1 of 1.5 has a sensitivity of AMI diagnosis in the emergency department of 59% when measured at 2–4 hours and 92% at 4–6 hours post-onset of symptoms.47 Another study showed that CK-MB isoforms were most sensitive and specific (91% and 89%) when measured 6 hours after onset of chest pain in patients with MI presenting to the emergency department.48 Similar to CK-MB, the isoforms lack absolute cardiac specificity. In addition, assays are not widely available for clinical use. The role of CK-MB isoforms among other biochemical markers remains to be defined.49
Myoglobin
Myoglobin is a low-molecular-weight heme protein found in cardiac and skeletal muscle. This protein is one of two preferred markers for the early detection of AMI, and automated immunoassays are commercially available. Serum levels are detected within 1–4 hours and peak 6–7 hours after the onset of symptoms. The early rise of myoglobin levels after onset of symptoms makes it most appropriate and convenient test for early detection of AMI. Myoglobin is cleared rapidly by renal glomerular filtration, and levels return to the reference value 24 hours following AMI. The fast rise and fall of myoglobin levels make it an appropriate marker to detect a reinfarction if occurring 24 hours after the initial insult. In addition, in patients presenting with AMI receiving thrombolytic therapy, elevated baseline or 12–hour myoglobin levels predict 30-day mortality and may be useful in triaging patients following reperfusion.50,51
Acute Coronary Syndrome
JOHN S., A 68-YEAR-OLD MAN, presented to the emergency department complaining of chest pain that started 3 hours ago. The pain is characterized as substernal pressure across his chest with radiation to his left arm and jaw. The pain was associated with slight shortness of breath. His past medical history includes hypertensive heart disease and dyslipidemia.
On physical examination, John S. had a blood pressure of 148/90 mm Hg and a pulse of 98 bpm. Heart and lung examinations were normal. Initial 12-lead ECG revealed sinus rhythm at 92 bpm and a 1-mm ST-segment depression in leads II, III, and aVF. Biochemical markers tested are as follows:
| TROPONIN I (0.00–0.02 ng/mL) | |
| At presentation | 0.01 |
| 6 hr later | 1.4 |
Question: What is the most likely assessment of John S.’s presentation?
Discussion: On presentation, the ECG findings are consistent with ST-segment depression representing ischemia in the inferior leads. Cardiac troponin level, however, is within the reference range, using the 99th percentile of normal controls. According to the ECG findings and baseline troponin level, John S. may be diagnosed as having UA.
However, the assumption that John S. has UA based on normal markers may be erroneous since his symptoms started 3 hours prior to presentation and the release kinetics of troponin I are such that the levels begin to rise between 3–12 hours after onset of AMI. Because the clinical presentation is highly suspicious, a second level should be drawn between 6–12 hours later. The second troponin level was positive for myocardial infarct (MI diagnostic cutoff at ≥0.30 ng/mL). Thus, the clinical picture is consistent with a non-ST-segment elevation myocardial infarction (NSTEMI) rather than UA.
Because of its release kinetics and high sensitivity to myocardial ischemia, myoglobin used to be most useful in ruling out AMI. However, lack of specificity to cardiac muscle limits the interpretation of myoglobin levels. Several conditions lead to false-positive results including skeletal muscle injury of any cause, trauma, and renal failure. In addition, studies using myoglobin used the WHO definition of Acute MI. New guidelines put forth by ACC and ESC recommend troponin as the standard biomarker for AMI because of its substantially higher sensitivity and specificity rendering myoglobin measurement essentially obsolete in current era.4,20
Normal range: 100–190 International Units/L or 1667–3167 nmol sec/L
Lactate dehydrogenase (LDH) is an enzyme that catalyzes the reversible formation of lactate from pyruvate. Following AMI, serum LDH rises in 24–48 hours, peaks at 2–3 days, and returns to normal in 8–14 days after the onset of chest pain. The major limitation to LDH is the lack of specificity as it is found in numerous organs and tissues including the heart, liver, lungs, kidneys, skeletal muscle, red blood cells, and lymphocytes. Electrophoretic fractionation of LDH to its five major isoenzymes (LDH1–LDH5) better distinguishes the site of origin, but these tests are not specific for AMI. The heart contains mainly LDH1 and to a lesser extent LDH2. In the past, elevation of LDH1 or a ratio of LDH1:LDH2 greater than one was used in the differential diagnosis of AMI. Since the development of more cardiac-specific markers, LDH and LDH isoenzymes are no longer recommended for the evaluation of the patient with ACS.7
Aspartate Aminotransferase
Normal range: 8–33 International Units/L or 134–551 nmol sec/L
Aspartate aminotransferase (AST) is an enzyme involved in amino acid synthesis. It is widely distributed in the liver, heart, skeletal muscle, red blood cells, kidneys, and pancreas. Serum levels of AST rise within 12 hours of AMI, peak in 24–48 hours, and return to baseline in 3–4 days. Poor specificity of AST for myocardial cell damage led to its replacement by more cardiac-specific markers.
Recommendations for Measurement of Biochemical Markers
Given the release and clearance kinetics of the different biochemical markers, the time of the patient’s presentation in relation to the onset of AMI should always be considered when interpreting laboratory results. Until recently, early-rising biochemical markers (myoglobin or CK-MB isoforms) were considered most appropriate for patients presenting within 6 hours of onset of symptoms whereas troponins were considered most appropriate for patients presenting 6 hours or later after AMI. A combination of an early marker with troponins was acceptable practice and was adopted by most laboratories.7 The advent of contemporary and high-sensitivity troponin assays have rendered myoglobulin and CK-MB measurements unnecessary. Currently, cTnI and cTnT have emerged as the preferred cardiac biochemical markers for the evaluation of patients with ACS.4,7,20 In settings where cardiac troponin assays are not available, CK-MB is the preferred alternative biomarker.
Cardiac troponins should be measured at presentation. Patients with normal serum levels at presentation should be reassessed after 6–12 hours or 6–9 hours.20 High-sensitivity troponins have been suggested to enhance early diagnostic performance in patients with suspected ACS. The European Society of Cardiology has recommended a protocol using high-sensitivity troponins, measured at presentation and then 3 hours afterward. Baseline troponin levels greater than the upper limit of normal using the 99th percentile of healthy controls, as well as the relevant change in troponin level at 3 hours from baseline, are used for detecting early AMI. The relevant change in levels is assay dependent and is greatly debated.20 High-sensitivity troponin assays are not available in the United States.
Other Biochemical Markers
Two other biochemical markers have been shown useful in patients with ACS: B-type natriuretic peptide (BNP) and c-reactive protein (CRP).
B-type natriuretic peptide is a neurohormone released by ventricular myocardium in response to volume overload. Its primary utilization is for the evaluation of patients with heart failure. However, it has been shown to be a strong predictor of short- and long-term mortality in patients with ACS. A detailed discussion of BNP is presented later in the chapter.
C-reactive protein is a nonspecific acute-phase reactant that is released in the presence of inflammatory processes caused be various etiologies (e.g., infections, malignancy, trauma, rheumatoid arthritis, and other inflammatory processes). It is synthesized in the liver and is normally present in trace amounts in the peripheral circulation. In the presence of inflammation, CRP production is stimulated by systemic cytokines. Since inflammation plays a role in the pathophysiologic processes leading to atherosclerosis and plaque rupture, serum and plasma levels of CRP are elevated in patients with CAD and ACS. In fact, several studies have reported CRP to be a strong predictor of mortality in patients presenting with ACS.52-56 In addition, the risk of recurrent MI and death in patients with ACS receiving aggressive statin therapy were decreased significantly more in patients with low CRP levels than those with higher CRP levels regardless of the low-density lipoprotein cholesterol level.57
Several CRP qualitative and quantitative assays are commercially available. The diagnostic level cutoff is assay dependent. CRP assays lack the sensitivity necessary to measure low levels of the protein that might be found in healthy individuals for prognostic purposes; they are intended for use in the acute setting for the evaluation of the presence of infection, tissue injury, and inflammatory disorders. In addition, as a nonspecific marker of inflammation, the test is used to indicate the presence of inflammation, but it is not useful in the delineation among the many causes of inflammation. Measuring CRP for the diagnosis of CAD or ACS or cardiovascular risk stratification is not recommended for routine use in clinical practice.
High-sensitivity C-reactive protein (hsCRP) is a more sensitive CRP test with an ability to detect low levels (0.2–0.4 mg/L) with sufficient precision needed for accurate atherosclerotic cardiovascular risk assessment in otherwise healthy individuals. High-sensitivity C-reactive protein levels have been shown to be a strong independent predictor of cardiovascular and peripheral vascular disease risk and of recurrent cardiac events in patients with history of CAD or ACS. In patients presenting with ACS, a cutoff level of 10 mg/L or greater has been identified as a marker of high risk for death and MI, a cutoff level between 3 mg/L and 10 mg/L has been identified as intermediate risk, and a cutoff level of less than 3 mg/L has been identified as low risk.58 In patients with stable CAD, a cutoff level of greater than 1 mg/L has been identified as a strong predictor of adverse cardiovascular events regardless of baseline characteristics and treatments.59 The evaluation of hsCRP should be performed in conjunction with the standard cholesterol evaluation for cardiovascular disease risk stratification. The average of two measurements of hsCRP performed 2 weeks apart should be used. Patients with active infections or systemic inflammatory processes have increased hsCRP levels. To enhance the accuracy of cardiovascular risk assessment in these patients, hsCRP measurement should be postponed until the acute phase of the active infection or systemic inflammatory process has subsided and the patients are metabolically stable.60
The role of CRP in hypertension has also been investigated, and it has been suggested to upregulate angiotensin type 1 receptors in vascular smooth muscle.61 Elevated levels of hsCRP have been shown to be a useful marker of arterial stiffness in hypertensive patients.62 Moreover, treatment with valsartan, an angiotensin receptor blocker has been shown to reduce hsCRP levels.63 Further evaluation of the clinical benefit of routine CRP use in the evaluation and management of hypertensive patients is needed.
In 2005, the Food and Drug Administration (FDA) delineated another type of designation to a high-sensitivity CRP assay, the cardiac CRP (cCRP).64 The guidance provided manufacturers with recommendations for development of CRP assays, specifically that cCRP is exclusively indicated for the assessment and stratification of individuals at risk for cardiovascular disease, whereas hsCRP is indicated for the evaluation of other conditions thought to be associated with inflammation, in otherwise healthy individuals. In essence, the FDA defines cCRP as “high-sensitivity CRP with evidence of efficacy for identification and assessment/stratification of individuals at risk for future cardiovascular disease.” The diagnostic cutoff for cCRP is the same as that of hsCRP. The need to differentiate between the two types of CRP assays has been debated.65-66 Even though it has no role in the diagnosis of ACS, when used in conjunction with standard clinical laboratory evaluation of ACS, cCRP may be useful as an independent marker of prognosis for recurrent events, in patients with stable coronary disease, or ACS.67-70
Other biochemical markers include serum amyloid A and interleukin-6, which are acute phase inflammation markers and have been shown to predict an increased risk of adverse outcomes of ACS patients.72,72 Fibrinopeptide and fibrinogen, two markers of coagulation cascade activity, also appear to be associated with an increased risk and a poor clinical outcome in patients with UA.73,74 Myeloperoxidase, a hemoprotein with microbicidal activity has been shown to have pro-atherogenic properties, leading to CAD and ACS. Several studies have revealed that elevated serum and plasma levels of myeloperoxidase are independent predictors of outcomes in patients presenting with ACS.75-77 In addition, microalbuminuria has been shown in a limited number of studies to be an independent predictor of CAD and a strong prognostic marker in patients with AMI.78-81
Miscellaneous Laboratory Tests
A number of noncardiac specific laboratory abnormalities may be manifested in patients with AMI. These include nonspecific elevation of serum glucose, white blood cells, and erythrocyte sedimentation rate (ESR), and alterations in lipid profile findings. Recognition of these abnormalities as secondary to AMI precludes misinterpretation or misdiagnosis of other disorders.
Serum Glucose
Normal range: 70–110 mg/dL or 3.9–6.1 mmol/L, preprandial
Following AMI, patients may present with elevations of serum glucose, apparently related to stress, and may persist for several weeks. Hyperglycemia may be found in diabetic as well as nondiabetic patients. Measurement of glycosylated hemoglobin may help to differentiate hyperglycemia associated with AMI versus uncontrolled diabetes mellitus.82,83 Hyperglycemia on admission and fasting glycemia during early hospitalization in patients with AMI has been shown to be a strong predictor of mortality even in nondiabetic patients.84,85
White Blood Cells
Normal range: 4.4–11.0 × 10³ cells/mm3 or 4.4–11.0 × 10⁹ cells/L for adults
White blood cell count may be increased in patients presenting with AMI in response to myocardial tissue necrosis or secondary to increased adrenal glucocorticoid secretion due to stress. Polymorphonuclear leukocytosis of 10,000–20,000 cells/mm3 (10–20 × 109 cells/L) may be seen 12–24 hours after onset of symptoms and may last for 1–2 weeks depending on extent of tissue necrosis. Fever may accompany leukocytosis.
Erythrocyte Sedimentation Rate
Normal range: males, 1–15 mm/hr females; 1–20 mm/hr
The erythrocyte sedimentation rate (ESR) is related to levels of acute phase reactants that increase in patients with AMI. The ESR usually peaks on day 4 or 5 and may remain elevated for 3–4 weeks post-AMI.
Lipid Panel
Total cholesterol and low-density lipoprotein may be decreased when measured 48–72 hours post-MI and may persist for 6–8 weeks afterward.
LABORATORY TESTS USED IN THE EVALUATION OF HEART FAILURE
Natriuretic Peptides
Natriuretic peptides are naturally-secreted hormones that are released by various cells in response to increased volume or pressure. A number of natriuretic peptides have been identified, including atrial natriuretic peptide (ANP), BNP, C-type natriuretic peptide (CNP), Dendroaspis natriuretic peptide (DNP), and urodilatin. The latter were recently isolated from the venom of Dendroaspis angusticeps (green mamba snake) and human urine, respectively. However, their clinical utilization in patients with cardiovascular diseases is not well-defined as of this writing. A structurally related peptide to ANP and BNP, CNP is secreted by the heart and vascular endothelium and exerts vasodilating effects.86 Limited evidence suggests that plasma CNP levels are increased in patients with heart failure, but further investigation of the clinical utilization of CNP levels and their interpretation in the diagnosis and assessment of heart failure is warranted.87
Atrial natriuretic peptide and BNP are known cardiac-specific peptides. The two are structurally similar and exert potent diuretic, natriuretic, and vascular smooth muscle-relaxing effects. A 28-amino acid (aa) peptide, ANP is primarily secreted by the atrial myocytes in response to increased atrial wall tension. A 32-aa peptide, BNP was first identified in porcine brain extracts (hence the name brain natriuretic peptide).88 Subsequently, it was found in much higher concentrations in cardiac ventricles and is primarily secreted by the left ventricular myocytes in response to volume overload and increased ventricular wall tension.
The precursor for BNP is PreproBNP, a 134-aa peptide that is enzymatically cleaved into proBNP, a 108-aa peptide. The latter is then further cleaved into the biologically active C-terminal 32-aa BNP and the biologically inactive amino-terminal portion of the prohormone, N-terminal-proBNP (NT-proBNP). Plasma levels of both BNP and NT-proBNP are elevated in response to increased volume and ventricular myocyte stretch in patients with heart failure. Once released into the peripheral circulation, BNP is cleared by enzymatic degradation via endopeptidase and natriuretic peptide receptor-mediated endocytosis, whereas NT-proBNP is cleared renally. The elimination half-life of BNP is significantly shorter than that of NT-proBNP (20 minutes versus 120 minutes, respectively).
The quantitative measurements of BNP and NT-proBNP levels are indicated for the evaluation of patients suspected of having heart failure, assessment of the severity of heart failure, and risk stratification of patients with heart failure and ACS.89 In conjunction with standard clinical assessment, BNP and NT-proBNP levels at the approved cutoff points are highly sensitive and specific for the diagnosis of acute heart failure and correlate well with the severity of heart failure symptoms as evaluated by the New York Heart Association (NYHA) Classification.90,91 In addition, BNP and NT-proBNP are strong independent markers of clinical outcomes in patients with heart failure, IHD, and ACS even in the absence of previous history of CHF or objective evidence of left ventricular dysfunction during hospitalization.92-98
There is growing interest in the value of serial BNP and NT-proBNP measurements to guide optimal heart failure therapy.99 Several randomized trials of chronic heart failure patients have compared standard heart failure therapy plus BNP or NT-proBNP- guided therapy to standard heart failure treatment alone.100-104 A meta-analysis of these trials confirmed the findings that BNP-guided heart failure therapy reduces all-cause mortality in patients with chronic heart failure, compared with usual clinical care in patients younger than 75 years, but not in those older than 75 years of age. Mortality reduction might be attributable to the higher percentage of patients achieving target doses of angiotensin-converting enzyme inhibitors (ACE-I) and beta blockers, classes of agents shown to delay or halt progression of cardiac dysfunction and improve mortality in patients with heart failure.105 A greater than 30% reduction in BNP levels in response to heart failure treatment indicates a good prognosis.106 B-type natriuretic peptide levels cannot be used in the assessment of patient receiving therapy with the synthetic BNP, Natrecor® (nesiritide, Scios). Assays measuring NT-pro-BNP are not affected by the presence of synthetic BNP and thus may be used in the assessment of patients.
Several factors impact the BNP and NT-proBNP levels, including gender, age, renal function, and obesity. Plasma BNP and NT-proBNP levels in normal volunteers are higher in women and increase with age. In addition, renal insufficiency at an estimated glomerular filtration rate (GFR) below 60 mL/min may impact the interpretation of the measured natriuretic peptides. Significant correlation between NT-proBNP level, and GFRs have been shown, more so than that between BNP level and GFRs. This is because renal clearance is the primary route of elimination of NT-proBNP, and the measured levels of the biomarker are elevated in patients with mild renal insufficiency. Yet, evaluation of patients with GFRs as low as 14.8 mL/min revealed that the test continues to be valuable for the evaluation of the dyspneic patient irrespective of renal function.107 Higher diagnostic cutoffs for different GFR ranges may be necessary for optimal interpretation in patients with renal insufficiency.
Plasma levels of BNP and NT-proBNP are reduced in obese patients, limiting the clinical interpretation of the tests in these patients. An inverse relation between the levels of these markers and body mass index (BMI) is observed.108,109 The exact mechanism for this is not known, but a BMI-related defect in natriuretic peptide secretion has been suggested.110 In one study, NT-proBNP levels were found to be lower in obese patients presenting with dyspnea (with or without acute heart failure), but the test seemed to retain its diagnostic and prognostic capacity across all BMI categories.111 Similarly, in patients with advanced systolic heart failure, although BNP levels were relatively lower in overweight and obese patients, the test predicted worse symptoms, impaired hemodynamics, and higher mortality at all levels of BMI. Optimal BNP cutoff levels for prediction of death or urgent transplant in lean, overweight, and obese patients were reported to be 590 pg/mL, 471 pg/mL, and 342 pg/mL, respectively.112 In order to increase the specificity of BNP levels for heart failure in obese and lean patients, a diagnostic cutoff level of greater than or equal to 54 pg/mL for severely obese patients and a cutoff level of greater than or equal to 170 pg/mL in lean patients have been suggested.113
Despite the fact that BNP and NT-proBNP have no role in the diagnosis of ACS, they are powerful prognostic markers and predictors of mortality in these patients.20,106,114-117 The use of BNP levels in the assessment of cardiotoxicity associated with anthracycline chemotherapy is under investigation.118-121
Diagnostic cutoff: 100 pg/mL (or ng/L)
The clinical diagnostic cutoff level for heart failure is a B-type natriuretic peptide (BNP) level of greater than 100 pg/mL. In addition to standard clinical evaluation, a BNP level of greater than 100 pg/mL is associated with sensitivity and specificity of 90% for heart failure in a patient presenting with shortness of breath.122 The test has a high negative predictive value in ruling out heart failure as a primary cause for the presentation. A BNP level of 100–500 pg/mL is suggestive of heart failure and a level greater than 500 pg/mL is indicative of heart failure as the likely etiology of acute dyspnea (Table 11-7).106
aIn patients with estimated glomerular filtration rate <60 mL/min/1.73 m2 and body mass index <35 kg/m2, different decision limits must be used.
bIn patients with estimated glomerular filtration rate <60 mL/min/1.73 m2, different decision limits must be used.
Source: Adapted from reference 106.
Several assays using various technologies are currently available in the United States for the quantitative measurement of BNP including the AxSYM (Abbott Laboratories), which utilizes microparticle enzyme immunoassay; the ADVIA Centaur (Bayer Diagnostics), which utilizes direct chemiluminescent sandwich immunoassay; the Triage BNP (Biosite, Inc.), which utilizes single use fluorescence immunoassay; and the Beckman Coulter (Biosite, Inc.), which utilizes two-site chemiluminescent immuno-enzymatic assay. The Biosite Triage BNP Test is a point-of-care test with a turnaround time of 15 minutes, making it readily available for use in emergency rooms and physicians’ offices.
N-Terminal-ProBNP
Diagnostic cutoff: 300 pg/mL (or ng/L)
N-terminal-proBNP (NT-proBNP) is a more stable form of BNP that correlates well with BNP in patients with heart failure, and its levels are typically higher than BNP levels. In addition, NT-proBNP levels are elevated in the elderly and, accordingly, the clinical diagnostic cutoff level for heart failure is higher in older patients. An NT-proBNP level less than 300 pg/mL was optimal for ruling out acute CHF, with a negative predictive value of 99%. For cut points of greater than 450 pg/mL for patients younger than 50 years of age and greater than 900 pg/mL for patients 50 years of age or older, NT-proBNP levels were highly sensitive and specific for the diagnosis of acute heart failure (Table 11-7).106,123
Several NT-proBNP assays utilizing various technologies are currently available in the United States including the Elecsys (Roche Diagnostics, Inc.), which utilizes electrochemiluminescent immunoassay and the Dimension (Dade Behring), which utilizes microparticle enzyme immunoassay. In addition, a point-of-care NT-proBNP assay is commercially available.
Other Biochemical Markers
Elevated cardiac troponin levels in patients with heart failure have been shown to be related to the severity of heart failure and worse outcomes.124-126 In patients presenting with acute decompensated heart failure, routine measurement of troponin levels is recommended.127 In addition to baseline troponin levels, serial troponin measurements may be useful in predicting outcomes.128 In a recent study of patients hospitalized for acute heart failure, 60% of patients had detectable cTnT levels (>0.01 ng/mL) levels and 34% had positive values (>0.03 ng/mL) at baseline. Of the patients with negative troponin at baseline, 21% had elevated cTnT levels by day 7. Positive troponin levels at baseline and conversion to detectable levels were associated were associated with poor prognosis.129
IMAGING STUDIES
A number of imaging modalities contribute to the diagnosis and assessment of ACS, including chest roentgenography, echocardiography, cardiac catheterization, perfusion imaging, computed tomography (CT), magnetic resonance imaging (MRI), and positron-emission tomography (PET). For patients presenting with ACS, these tests may be used when clinical presentation, biochemical markers, and ECG are nondiagnostic with high clinical suspicion.
Chest Roentgenogram
Chest radiography taken at the initial presentation of patients with ACS provides an early estimation of the size of the left heart chambers. In addition, presence and degree of pulmonary congestion indicates elevated left-ventricular end-diastolic pressure, which may result from a sizeable infarction of the left ventricle. In addition, chest radiography is a standard study in evaluating patients presenting with symptoms suggestive of heart failure. Chest roentgenogram findings of heart failure include cardiac enlargement, vascular redistribution, interstitial and alveolar edema, peribronchial cuffing, and pleural effusions. Cardiac enlargement on chest roentgenogram in patients with heart failure is associated with a higher morbidity rate.
Echocardiography
Echocardiography is based on sound transmitted to and through the heart. Different tissues present different acoustical impedance (resistance to transmitting sound). Transthoracic echocardiography (TTE) involves sound waves from a transducer positioned on the anterior chest directed across cardiac tissues. The sound is reflected back in different frequencies, and images of cardiac anatomy are displayed on an oscilloscope or an electronic monitor.
Two-dimensional (2D) echocardiography records multiple views providing cross-sectional images of the heart. Clinical uses include anatomic assessment of the heart and functional assessment of cardiac chambers and valves. Contrast agents may be injected for better visualization of endocardial borders. M-mode, or motion-mode, records the motion of individual structures. Doppler echocardiography uses sound or frequency ultrasound to record the velocity and direction of blood and wall motion; it is based on the principle of bouncing ultrasound waves off of a moving object (e.g., red blood cells). This method permits the assessment of valvular and wall motion abnormalities.
As a noninvasive test that measures cardiac hemodynamics and filling pressures, TTE plays an important role in assessing patients with ACS presenting with apparent large infarct and hemodynamic instability. Information provided includes wall motion abnormalities to assess the extent of the infarct or the level of function of the remaining myocardium, recognition of complications such as postinfarction ventricular septal defect, and the presence of left ventricular thrombi.130 In addition, TTE can be combined with exercise and pharmacologic stress testing to assess stress-induced structural or functional abnormalities (e.g., wall motion abnormality associated with ischemia) in patients with IHD.
Left ventricular ejection fraction is a valuable diagnostic and prognostic index in patients with failure, and it is defined as the fraction of end-diastolic volume ejected from the left ventricle during each systolic contraction. The normal range for LVEF is 55% to 75%. Patients may have heart failure due to diastolic ventricular dysfunction with a normal LVEF. In clinical practice, TTE is currently the modality most utilized and accepted for the evaluation of systolic and diastolic cardiac function.
Newer and sophisticated techniques such as speckle tracking and strain rate are now utilized in 2D echocardiography to aid in evaluation of the dynamic nature of the myocardial function and provide more precise quantitative myocardial function assessment. Three-dimensional (3D) echocardiography provides improved accuracy over 2D echocardiography and is recommended for left ventricular function assessment (volume and ejection fraction).131 Further investigation is needed before 3D echocardiography is recommended for routine in clinical practice.
Transesophageal echocardiography (TEE) involves mounting the transducer at the end of a flexible endoscope and passing it through the esophagus to position it closer to the heart. Transesophageal echocardiography provides higher resolution of the posterior cardiac structures making it ideal for viewing the atria, cardiac valves, and aorta. Clinical indications include detection of atrial appendage thrombi, native and prosthetic valvular function and morphology, cardiac masses, or thoracic aortic dissection, and TEE has no role in the diagnosis or assessment of patients with ACS. Appropriateness criteria for use of TTE and TEE in the evaluation of cardiac structure and function has been published.132
Noninvasive Stress Testing
Exercise Stress Testing
In patients with chronic stable CAD who are capable of physical exercise, myocardial perfusion imaging is used in conjunction with exercise testing. Physical exercise is performed using a graded exercise protocol on a treadmill or upright bicycle. The most widely used protocol is the Bruce protocol. Nonimaging endpoints include reproduction of anginal symptoms, exhaustion, hypertension or 20 mm Hg decrease in systolic blood pressure, ventricular arrhythmias, or severe ST-segment depression on ECG. Exercise allows for several useful measurements including the duration of exercise, total workload, maximum HR, exercise-induced symptoms, ECG changes, and blood pressure response. Limitations include patients with orthopedic, neurological, or peripheral vascular problems. Patients receiving agents that may blunt HR response to exercise (beta blockers or nondihydropyridine calcium channel blockers) may not be able to achieve the target heart rate necessary for diagnostic and prognostic purposes.
Pharmacologic Stress Testing
Patients who are unable to exercise may be stressed pharmacologically using either (1) vasodilating agents such as adenosine or dipyridamole or (2) positive inotropic agents such as dobutamine. Both modalities produce a hyperemic (vasodilatory response or increased blood flow) response leading to heterogeneity of myocardial blood flow between vascular areas supplied by normal and significantly stenosed coronary arteries. Heterogeneity is visualized with radionuclide myocardial perfusion agents.
Adenosine is an endogenous vasodilator. Coronary vasodilation is mediated through the activation of A2a receptors. Dipyridamole blocks the cellular reabsorption of endogenous adenosine. Vasodilation, by both adenosine and dipyridamole, increases coronary blood flow in normal arteries 3–5 times baseline with little or no increase in blood flow to stenotic arteries. Dobutamine increases myocardial oxygen demand by increasing myocardial contractility, HR, and blood pressure. Following dobutamine administration, coronary blood flow in normal arteries is increased 2–3 times baseline, which is similar to that achieved with exercise. Myocardial uptake of thallium-201, a radiopharmaceutical agent, is directly proportional to coronary blood flow (see Myocardial Perfusion Imaging). Administration of the above pharmacologic agents causes relatively less thallium-201 uptake in myocardial areas supplied by stenotic arteries. Therefore, a greater difference is seen between tissue supplied by normal arteries and tissue supplied by stenotic arteries.
Cardiac catheterization involves the introduction of a catheter through the femoral or brachial artery, which is advanced to the heart chambers or great vessels guided by fluoroscopy. Measurements collected include intracardiac pressures, hemodynamic data, and blood flow in the heart chambers and coronary arteries.
Coronary Angiography
Coronary angiography, also referred to as angiocardiography or coronary arteriography, is a diagnostic test in which contrast media is injected into the coronary arteries. X-ray exposures of the coronary arteries are then examined to assess the location and severity of coronary atherosclerotic lesions. Therapeutic interventions or PCI may be performed during the catheterization including percutaneous transluminal coronary angioplasty (PTCA) and bare-metal or drug-eluting stent placement.
Left Ventriculography
Left ventriculography is the injection of contrast media into the left ventricle to assess its structure and function. The test is often performed as part of a diagnostic cardiac catheterization to evaluate ventricular wall motion and measure LVEF.
Nuclear Imaging
Nuclear imaging involves the injection of trace amounts of radioactive elements that concentrate in certain areas of the heart. A gamma camera is then rotated around the patient, and multiple planar images are taken to detect the radioactive emissions and form an image of the deployment of the tracer in the different regions of the heart. Single-photon emission CT (SPECT) is the most common imaging technique.
Nuclear imaging is used to assess blood flow through the heart and myocardial perfusion, locate and assess severity of myocardial ischemia and infarction, and evaluate myocardial metabolism.
Myocardial Perfusion Imaging
Thallium-201 (201Tl) became available in 1974 and was the conventional radiopharmaceutical agent used until the early 1990s, at which time technetium-99m (99mTc)-labeled compounds such as 99mTc-sestamibi and 99mTc-tetrofosmin were introduced for visualization of myocardial perfusion. The imaging agents measure the relative distribution of myocardial blood flow between normal and stenotic coronary arteries.
201Tl, a potassium analog is taken up by healthy functioning tissue in a manner similar to potassium. 201Tl is taken up at reduced rates by ischemic myocardial tissue and is not distributed to or taken up by regions of MI. Imaging with 201Tl for detection of infarction is accomplished with the patient at rest and is optimal within 6 hours of symptom onset. 201Tl is injected intravenously and imaging is initiated 10–20 minutes after injection; imaging is repeated 2–4 hours later to determine whether redistribution occurred. The diagnosis of AMI must be inferred by a lack of regional myocardial uptake of the radiotracer. 201Tl imaging for a perfusion defect has a sensitivity of about 90% if applied within the first 24 hours after symptom onset and falls sharply thereafter.
99mTc is an infarct-avid agent. It concentrates in necrotic myocardial tissue, presumably because it enters myocardial cells and selectively binds to calcium and calcium complexes. Abnormal intracellular uptake of calcium is a feature of irreversible cell death and begins as early as 12 hours after AMI and may persist for 2 weeks. 99mTc scans may be positive as early as 4 hours after the onset of AMI symptoms. The peak sensitivity for the scan is between 48–72 hours, but it generally remains positive for up to 1 week post AMI. When obtained within 24–72 hours after onset of infarction, the scan has a diagnostic sensitivity of 90% to 95% in patients with Q-wave AMI or 38% to 92% in patients with non-Q-wave AMI. 99mTc imaging has moderate specificity, with an overall range of 60% to 80%.
201Tl perfusion imaging is widely utilized in patients with atypical chest pain following a nondiagnostic (symptoms or findings consistent with CAD are not evident during the test due to inability to achieve target HR or a technically-limited study) or false-positive stress test to determine if coronary artery atherosclerosis is the cause of symptoms. In addition, since redistribution is a marker of jeopardized but viable myocardial tissue, 201Tl can be used to indicate the probable success of revascularization or angioplasty and for preoperative prognostic stratification of patients. Transient defects (redistribution) indicate hemodynamically significant coronary lesions with the risk of cardiac death.
Nuclear imaging in conjunction with stress testing provides further information on myocardial perfusion and function. 99mTc-sestamibi may be used in combination with 201Tl to assess rest and stress myocardial perfusion sequentially in 1 day. The patient’s rest study is done first with 201Tl; imaging is started immediately after tracer injection and is completed within about 45 minutes. Stress testing (pharmacologically or with exercise) is begun after the rest study, and 99mTc-sestamibi is injected at peak cardiac stress.
Since 99mTc-sestamibi emits higher energy photons than 201Tl, its images are not subject to cross-interference from the previously administered 201Tl. Both 201Tl and 99mTc-sestamibi undergo first-pass extraction from blood by myocardial cells; both provide a stop-frame image of regional myocardial blood flow at the time of tracer injection. 99mTc-sestamibi does not leak appreciably from myocardial cells, thus imaging may be delayed to allow blood and lung concentrations to diminish. Consequently, 99mTc-sestamibi imaging can be completed between 1–4 hours after tracer injection without significantly reducing diagnostic reliability.
The clinically most important application of myocardial perfusion imaging is detection of an AMI. Images are interpreted qualitatively and quantitatively and assessment of myocardial perfusion to the different areas is reported as normal, defect, reversible defect, fixed defect, or reverse redistribution. Myocardial perfusion imaging may also be used for the assessment of thrombolytic therapy effectiveness and early risk stratification of patients presenting with AMI or ACS who were treated conservatively at initial presentation. Electrocardiogram-gated myocardial perfusion SPECT studies enhance the interpretive confidence and accuracy and provide information critical for the diagnosis, prognosis, and management decisions, including global left ventricular function and regional wall motion and thickening.
Heart Failure
MARTIN G., A 64-YEAR-OLD MAN with a history of chronic obstructive pulmonary disease, presents to the emergency department with complaints of worsening shortness of breath. He reports that his symptoms have worsened over the past four weeks. He now has shortness of breath at rest and has noticed increased swelling in his feet. He is an active smoker and has consumed one pack of cigarettes per day for over 40 years.
On examination, Martin G. was unable to complete full sentences. His BP was 150/90 mm Hg and pulse was 100 bpm. His jugular venous pressure was increased at 11 cm H2O. Lungs revealed poor air exchange with diffuse rhonchi and crackles. Lower extremities showed 2 + edema. His ECG revealed sinus tachycardia at 110 bpm. Troponin I level was less than 0.02 ng/mL and BNP level was 900 pg/mL. Chest x-ray was limited and revealed changes consistent with COPD along with mild cardiomegaly and possible mild vascular redistribution.
Question: How should Martin G.’s findings and laboratory values be interpreted?
Discussion: Given Martin G.’s history of pulmonary disease, his presentation could be easily attributed to COPD exacerbation. However, his presentation is consistent with signs and symptoms of new onset heart failure (tachycardia, elevated JVP, crackles, lower extremity edema and shortness of breath). The troponin I level is within the normal reference range and is consistent with the lack of any evidence of myocardial ischemia or infarction on ECG. His BNP level is elevated well above the diagnostic level of 100 pg/mL, and the 500 pg/mL level is indicative of heart failure. Based on the symptoms and the BNP level, Martin G.’s presentation is consistent with heart failure. An echocardiography is needed to further evaluate his LVEF and possible etiologies of heart failure.
Stay updated, free articles. Join our Telegram channel

Full access? Get Clinical Tree


