OBJECTIVES
After studying this chapter, you should be able to:
Describe how the sequential pattern of contraction and relaxation in the heart results in a normal pattern of blood flow.
Understand the pressure, volume, and flow changes that occur during the cardiac cycle.
Explain the basis of the arterial pulse, heart sounds, and murmurs.
Delineate the ways by which cardiac output can be upregulated in the setting of specific physiologic demands for increased oxygen supply to the tissues, such as exercise.
Describe how the pumping action of the heart can be compromised in the setting of specific disease states.
INTRODUCTION
Of course, the electrical activity of the heart discussed in the previous chapter is designed to subserve the heart’s primary physiologic role—to pump blood through the lungs, where gas exchange can occur, and thence to the remainder of the body (Clinical Box 30–1). This is accomplished when the orderly depolarization process described in the previous chapter triggers a wave of contraction that spreads through the myocardium. In single muscle fibers, contraction starts just after depolarization and lasts until about 50 ms after repolarization is completed (see Figure 5–15). Atrial systole starts after the P wave of the electrocardiogram (ECG); ventricular systole starts near the end of the R wave and ends just after the T wave. In this chapter, how these changes in contraction produce sequential changes in pressures and flows in the heart chambers and blood vessels, thereby propelling blood appropriately as needed by whole body demands for oxygen and nutrients, will be considered. As an aside, it should be noted that the term systolic pressure in the vascular system refers to the peak pressure reached during systole, not the mean pressure; similarly, the diastolic pressure refers to the lowest pressure during diastole.
MECHANICAL EVENTS OF THE CARDIAC CYCLE
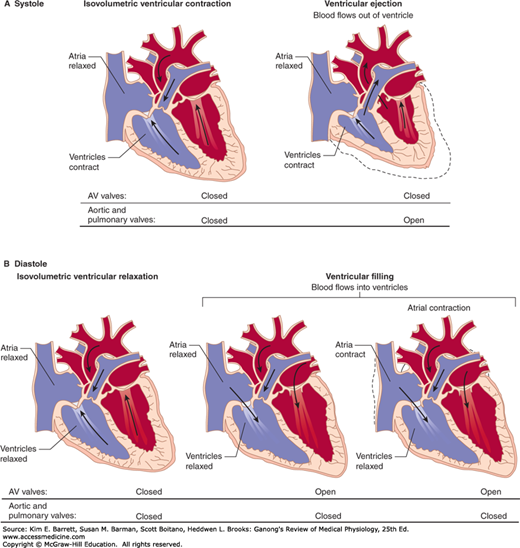
Late in diastole, the mitral (bicuspid) and tricuspid valves between the atria and ventricles (atrioventricular [AV] valves) are open and the aortic and pulmonary valves are closed. Blood flows into the heart throughout diastole, filling the atria and ventricles. The rate of filling declines as the ventricles become distended and, especially when the heart rate is low, the cusps of the AV valves drift toward the closed position (Figure 30–1). The pressure in the ventricles remains low. About 70% of the ventricular filling occurs passively during diastole.
FIGURE 30–1
Divisions of the cardiac cycle: A) systole and B) diastole. The phases of the cycle are identical in both halves of the heart. The direction in which the pressure difference favors flow is denoted by an arrow; note, however, that flow will not actually occur if a valve prevents it. AV, atrioventricular.
Contraction of the atria propels some additional blood into the ventricles. Contraction of the atrial muscle narrows the orifices of the superior and inferior vena cava and pulmonary veins, and the inertia of the blood moving toward the heart tends to keep blood in it. However, despite these inhibitory influences, there is some regurgitation of blood into the veins.
CLINICAL BOX 30–1 Heart Failure
Heart failure occurs when the heart is unable to put out an amount of blood that is adequate for the needs of the tissues. It can be acute and associated with sudden death, or chronic. The failure may involve primarily the right ventricle (cor pulmonale), but much more commonly it involves the larger, thicker left ventricle or both ventricles. Heart failure may also be systolic or diastolic. In systolic failure, stroke volume is reduced because ventricular contraction is weak. This causes an increase in the end-systolic ventricular volume, so that the ejection fraction falls from 65% to as low as 20%. The initial response to failure is activation of the genes that cause cardiac myocytes to hypertrophy, and thickening of the ventricular wall (cardiac remodeling). The incomplete filling of the arterial system leads to increased discharge of the sympathetic nervous system and increased secretion of renin and aldosterone, so Na+ and water are retained. These responses are initially compensatory, but eventually the failure worsens and the ventricles dilate.
In diastolic failure, the ejection fraction is initially maintained, but the elasticity of the myocardium is reduced so filling during diastole is reduced. This leads to inadequate stroke volume and the same cardiac remodeling and Na+ and water retention that occur in systolic failure. It should be noted that the inadequate cardiac output in failure may be relative rather than absolute. When a large arteriovenous fistula is present, in thyrotoxicosis and in thiamine deficiency, cardiac output may be elevated in absolute terms but still be inadequate to meet the needs of the tissues (high-output failure).
THERAPEUTIC HIGHLIGHTSTreatment of heart failure is aimed at improving cardiac contractility, treating the symptoms, and decreasing the load on the heart. Currently, the most effective treatment in general use is inhibition of the production of angiotensin II with angiotensin-converting enzyme (ACE) inhibitors. Blockade of the effects of angiotensin II on AT1 receptors with nonpeptide antagonists is also of value. Blocking the production of angiotensin II or its effects also reduces the circulating aldosterone level and decreases blood pressure, reducing the afterload against which the heart pumps. The effects of aldosterone can be further reduced by administering aldosterone receptor blockers. Reducing venous tone with nitrates or hydralazine increases venous capacity so that the amount of blood returned to the heart is reduced, lowering the preload. Diuretics reduce the fluid overload. Drugs that block β-adrenergic receptors have been shown to decrease mortality and morbidity. Digitalis derivatives such as digoxin have classically been used to treat heart failure because of their ability to increase stores of intracellular Ca2+ and hence exert a positive inotropic effect, but they are now used in a secondary role to treat systolic dysfunction and slow the ventricular rate in patients with atrial fibrillation.
At the start of ventricular systole, the AV valves close. Ventricular muscle initially shortens relatively little, but intraventricular pressure rises sharply as the myocardium presses on the blood in the ventricle (Figure 30–2). This period of isovolumetric (isovolumic, isometric) ventricular contraction lasts about 0.05 s, until the pressures in the left and right ventricles exceed the pressures in the aorta (80 mm Hg; 10.6 kPa) and pulmonary artery (10 mm Hg) and the aortic and pulmonary valves open. During isovolumetric contraction, the AV valves bulge into the atria, causing a small but sharp rise in atrial pressure (Figure 30–3).
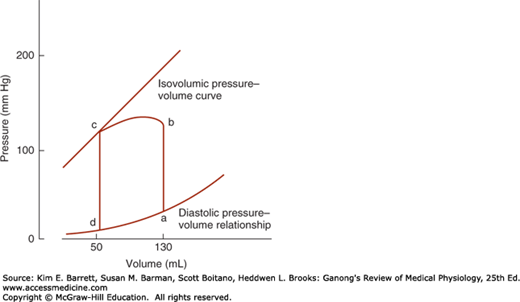
FIGURE 30–2
Normal pressure–volume loop of the left ventricle. During diastole, the ventricle fills and pressure increases from d to a. Pressure then rises sharply from a to b during isovolumetric contraction and from b to c during ventricular ejection. At c, the aortic valves close and pressure falls during isovolumetric relaxation from c back to d. (Reproduced with permission from McPhee SJ, Lingappa VR, Ganong WF [editors]: Pathophysiology of Disease, 6th ed. New York, NY: McGraw-Hill; 2010.)
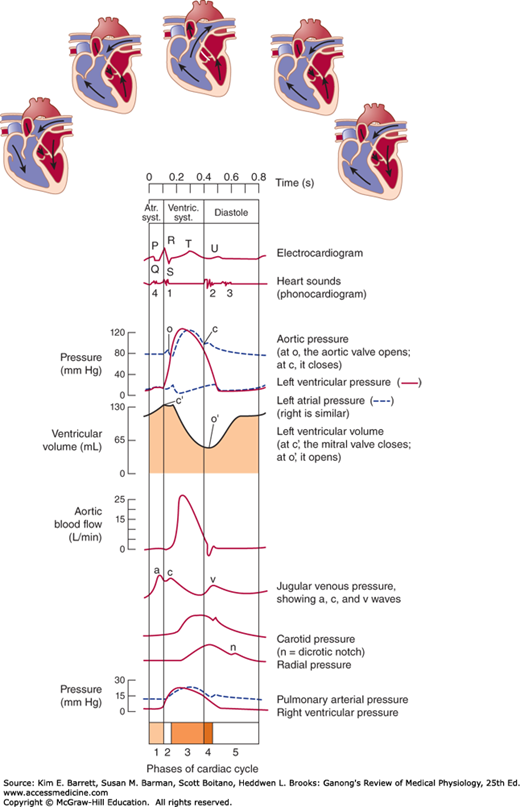
FIGURE 30–3
Events of the cardiac cycle at a heart rate of 75 beats/min. The phases of the cardiac cycle identified by the numbers at the bottom are as follows: 1, atrial systole; 2, isovolumetric ventricular contraction; 3, ventricular ejection; 4, isovolumetric ventricular relaxation; 5, ventricular filling. Note that late in systole, aortic pressure actually exceeds left ventricular pressure. However, the momentum of the blood keeps it flowing out of the ventricle for a short period. The pressure relationships in the right ventricle and pulmonary artery are similar. Atr. syst., atrial systole; ventric. syst., ventricular systole.
When the aortic and pulmonary valves open, the phase of ventricular ejection begins. Ejection is rapid at first, slowing down as systole progresses. The intraventricular pressure rises to a maximum and then declines somewhat before ventricular systole ends. Peak pressures in the left and right ventricles are about 120 and 25 mm Hg, respectively. Late in systole, pressure in the aorta actually exceeds that in the left ventricle, but for a short period momentum keeps the blood moving forward. The AV valves are pulled down by the contractions of the ventricular muscle, and atrial pressure drops. The amount of blood ejected by each ventricle per stroke at rest is 70–90 mL. The end-diastolic ventricular volume is about 130 mL. Thus, about 50 mL of blood remains in each ventricle at the end of systole (end-systolic ventricular volume), and the ejection fraction, the percentage of the end-diastolic ventricular volume that is ejected with each stroke, is about 65%. The ejection fraction is a valuable index of ventricular function. It can be measured by injecting radionuclide-labeled red blood cells and imaging the cardiac blood pool at the end of diastole and the end of systole (equilibrium radionuclide angiocardiography), or by computed tomography.
Once the ventricular muscle is fully contracted, the already falling ventricular pressures drop more rapidly. This is the period of protodiastole, which lasts about 0.04 s. It ends when the momentum of the ejected blood is overcome and the aortic and pulmonary valves close, setting up transient vibrations in the blood and blood vessel walls. After the valves are closed, pressure continues to drop rapidly during the period of isovolumetric ventricular relaxation. Isovolumetric relaxation ends when the ventricular pressure falls below the atrial pressure and the AV valves open, permitting the ventricles to fill. Filling is rapid at first, then slows as the next cardiac contraction approaches. Atrial pressure continues to rise after the end of ventricular systole until the AV valves open, then drops and slowly rises again until the next atrial systole.
Although events on the two sides of the heart are similar, they are somewhat asynchronous. Right atrial systole precedes left atrial systole, and contraction of the right ventricle starts after that of the left (see Chapter 29). However, since pulmonary arterial pressure is lower than aortic pressure, right ventricular ejection begins before that of the left. During expiration, the pulmonary and aortic valves close at the same time; but during inspiration, the aortic valve closes slightly before the pulmonary. The slower closure of the pulmonary valve is due to lower impedance of the pulmonary vascular tree. When measured over a period of minutes, the outputs of the two ventricles are, of course, equal, but transient differences in output during the respiratory cycle occur in normal individuals.
Cardiac muscle has the unique property of contracting and repolarizing faster when the heart rate is high (see Chapter 5), and the duration of systole decreases from 0.27 s at a heart rate of 65 beats/min to 0.16 s at a rate of 200 beats/min (Table 30–1). The reduced time interval is mainly due to a decrease in the duration of systolic ejection. However, the duration of systole is much more fixed than that of diastole, and when the heart rate is increased, diastole is shortened to a much greater degree. For example, at a heart rate of 65 beats/min, the duration of diastole is 0.62 s, whereas at a heart rate of 200 beats/min, it is only 0.14 s. This fact has important physiologic and clinical implications. It is during diastole that the heart muscle rests, and coronary blood flow to the subendocardial portions of the left ventricle occurs only during diastole (see Chapter 33). Furthermore, most of the ventricular filling occurs in diastole. At heart rates up to about 180 beats/min, filling is adequate as long as there is ample venous return, and cardiac output per minute is increased by an increase in rate. However, at very high heart rates, filling may be compromised to such a degree that cardiac output per minute falls.
| Heart Rate 75/min | Heart Rate 200/min | Skeletal Muscle | |
|---|---|---|---|
| Duration, each cardiac cycle | 0.80 | 0.30 | … |
| Duration of systole | 0.27 | 0.16 | … |
| Duration of action potential | 0.25 | 0.15 | 0.007 |
| Duration of absolute refractory period | 0.20 | 0.13 | 0.004 |
| Duration of relative refractory period | 0.05 | 0.02 | 0.003 |
| Duration of diastole | 0.53 | 0.14 | … |
Because it has a prolonged action potential, cardiac muscle cannot contract in response to a second stimulus until near the end of the initial contraction (see Figure 5–15). Therefore, cardiac muscle cannot be tetanized like skeletal muscle. The highest rate at which the ventricles can contract is theoretically about 400/min, but in adults the AV node will not conduct more than about 230 impulses/min because of its long refractory period. A ventricular contraction rate of more than 230/min is seen only in paroxysmal ventricular tachycardia (see Chapter 29).
Exact measurement of the duration of isovolumetric ventricular contraction is difficult in clinical situations, but it is relatively easy to measure the duration of total electromechanical systole (QS2), the preejection period (PEP), and the left ventricular ejection time (LVET) by recording the ECG, phonocardiogram, and carotid pulse simultaneously. QS2 is the period from the onset of the QRS complex to the closure of the aortic valves, as determined by the onset of the second heart sound. LVET is the period from the beginning of the carotid pressure rise to the dicrotic notch (see below). PEP is the difference between QS2 and LVET and represents the time for the electrical as well as the mechanical events that precede systolic ejection. The ratio PEP/LVET is normally about 0.35, and it increases without a change in QS2 when left ventricular performance is compromised in a variety of cardiac diseases.
The blood forced into the aorta during systole not only moves the blood in the vessels forward but also sets up a pressure wave that travels along the arteries. The pressure wave expands the arterial walls as it travels, and the expansion is palpable as the pulse. The rate at which the wave travels, which is independent of and much higher than the velocity of blood flow, is about 4 m/s in the aorta, 8 m/s in the large arteries, and 16 m/s in the small arteries of young adults. Consequently, the pulse is felt in the radial artery at the wrist about 0.1 s after the peak of systolic ejection into the aorta (Figure 30–3). With advancing age, the arteries become more rigid, and the pulse wave moves faster.
The strength of the pulse is determined by the pulse pressure and bears little relation to the mean pressure. The pulse is weak (“thready”) in shock. It is strong when stroke volume is large; for example, during exercise or after the administration of histamine. When the pulse pressure is high, the pulse waves may be large enough to be felt or even heard by the individual (palpitation, “pounding heart”). When the aortic valve is incompetent (aortic regurgitation), the pulse is particularly strong, and the force of systolic ejection may be sufficient to make the head nod with each heartbeat. The pulse in aortic regurgitation is called a Corrigan or water-hammer pulse.
The dicrotic notch, a small oscillation on the falling phase of the pulse wave caused by vibrations set up when the aortic valve snaps shut (Figure 30–3), is visible if the pressure wave is recorded but is not palpable at the wrist. The pulmonary artery pressure curve also has a dicrotic notch produced by the closure of the pulmonary valves.
Atrial pressure rises during atrial systole and continues to rise during isovolumetric ventricular contraction when the AV valves bulge into the atria. When the AV valves are pulled down by the contracting ventricular muscle, pressure falls rapidly and then rises as blood flows into the atria until the AV valves open early in diastole. The return of the AV valves to their relaxed position also contributes to this pressure rise by reducing atrial capacity. The atrial pressure changes are transmitted to the great veins, producing three characteristic waves in the record of jugular pressure (Figure 30–3). The a wave is due to atrial systole. As noted above, some blood regurgitates into the great veins when the atria contract. In addition, venous inflow stops, and the resultant rise in venous pressure contributes to the a wave. The c wave is the transmitted manifestation of the rise in atrial pressure produced by the bulging of the tricuspid valve into the atria during isovolumetric ventricular contraction. The v wave mirrors the rise in atrial pressure before the tricuspid valve opens during diastole. The jugular pulse waves are superimposed on the respiratory fluctuations in venous pressure. Venous pressure falls during inspiration as a result of the increased negative intrathoracic pressure and rises again during expiration.


