OBJECTIVES
After studying this chapter, you should be able to:
Describe the structure and function of the conduction system of the heart and compare the action potentials in each part.
Describe the way the electrocardiogram (ECG) is recorded, the waves of the ECG, and the relationship of the ECG to the electrical axis of the heart.
Name the common cardiac arrhythmias and describe the processes that produce them.
List the principal early and late ECG manifestations of myocardial infarction and explain the early changes in terms of the underlying ionic events that produce them.
Describe the ECG changes and the changes in cardiac function produced by alterations in the ionic composition of the body fluids.
INTRODUCTION
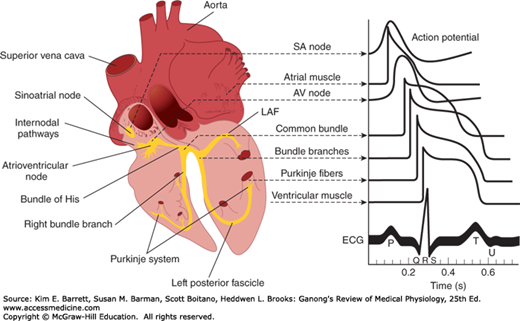
The parts of the heart normally beat in orderly sequence: Contraction of the atria (atrial systole) is followed by contraction of the ventricles (ventricular systole), and during diastole all four chambers are relaxed. The heartbeat originates in a specialized cardiac conduction system and spreads via this system to all parts of the myocardium. The structures that make up the conduction system are the sinoatrial node (SA node), the internodal atrial pathways, the atrioventricular node (AV node), the bundle of His and its branches, and the Purkinje system. The various parts of the conduction system and, under abnormal conditions, parts of the myocardium, are capable of spontaneous discharge. However, the SA node normally discharges most rapidly, with depolarization spreading from it to the other regions before they discharge spontaneously. The SA node is therefore the normal cardiac pacemaker, with its rate of discharge determining the rate at which the heart beats. Impulses generated in the SA node pass through the atrial pathways to the AV node, through this node to the bundle of His, and through the branches of the bundle of His via the Purkinje system to the ventricular muscle. Each of the cell types in the heart contains a unique electrical discharge pattern; the sum of these electrical discharges can be recorded as the electrocardiogram (ECG).
ORIGIN & SPREAD OF CARDIAC EXCITATION
In the human heart, the SA node is located at the junction of the superior vena cava with the right atrium. The AV node is located in the right posterior portion of the interatrial septum (Figure 29–1). There are three bundles of atrial fibers that contain Purkinje-type fibers and connect the SA node to the AV node: the anterior, middle (tract of Wenckebach), and posterior (tract of Thorel) tracts. Bachmann bundle is sometimes used to identify a branch of the anterior intermodal tract that connects the right and left atria. Conduction also occurs through atrial myocytes, but it is more rapid in these bundles. The AV node is continuous with the bundle of His, which gives off a left bundle branch at the top of the interventricular septum and continues as the right bundle branch. The left bundle branch divides into an anterior fascicle and a posterior fascicle. The branches and fascicles run subendocardially down either side of the septum and come into contact with the Purkinje system, whose fibers spread to all parts of the ventricular myocardium.
FIGURE 29–1
Conducting system of the heart. Left: Anatomic depiction of the human heart with additional focus on areas of the conduction system. Right: Typical transmembrane action potentials for the SA and AV nodes, other parts of the conduction system, and the atrial and ventricular muscles are shown along with the correlation to the extracellularly recorded electrical activity, that is, the electrocardiogram (ECG). The action potentials and ECG are plotted on the same time axis but with different zero points on the vertical scale for comparison. AV, atrioventricular; LAF, left anterior fascicle; SA, sinoatrial. (Data from Donahue JG, Choo PW, Manson JE, et al. The incidence of herpes zoster. Arch Intern Med. 155:1605–1609, 1995; Choo PW, Galil K, Donahue JG, et al. Risk factors for postherpetic neuralgia. Arch Intern Med. 1997;157:1217–1224.)
The histology of a typical cardiac muscle cell (eg, a ventricular myocyte) is described in Chapter 5. For the most part, the conduction system is composed of modified cardiac muscle that has fewer striations and indistinct boundaries. Individual cells within regions of the heart have unique histologic features. Purkinje fibers, specialized conducting cells, are large with fewer mitochondria and striations and distinctly different from a myocyte specialized for contraction. Compared with Purkinje fibers, cells within the SA node and, to a lesser extent, the AV node are smaller and sparsely striated and are less conductive due to their higher internal resistance. The atrial muscle fibers are separated from those of the ventricles by a fibrous tissue ring, and normally the only conducting tissue between the atria and ventricles is the bundle of His.
The SA node develops from structures on the right side of the embryo and the AV node from structures on the left. This is why in the adult the right vagus is distributed mainly to the SA node and the left vagus mainly to the AV node. Similarly, the sympathetic innervation on the right side is distributed primarily to the SA node and the sympathetic innervation on the left side primarily to the AV node. On each side, most sympathetic fibers come from the stellate ganglion. Noradrenergic fibers are epicardial, whereas the vagal fibers are endocardial. However, connections exist for reciprocal inhibitory effects of the sympathetic and parasympathetic innervation of the heart on each other. Thus, acetylcholine acts presynaptically to reduce norepinephrine release from the sympathetic nerves, and conversely, neuropeptide Y released from noradrenergic endings may inhibit the release of acetylcholine.
The electrical responses of cardiac muscle and nodal tissue and the ionic fluxes that underlie them are discussed in detail in Chapter 5 and are briefly reviewed here for comparison with the pacemaker cells below. Myocardial fibers have a resting membrane potential of approximately −90 mV (Figure 29–2A). The individual fibers are separated by membranes, but depolarization spreads radially through them as if they were a syncytium because of the presence of gap junctions. The transmembrane action potential of single cardiac muscle cells is characterized by rapid depolarization (phase 0), an initial rapid repolarization (phase 1), a plateau (phase 2), and a slow repolarization process (phase 3) that allows return to the resting membrane potential (phase 4). The initial depolarization is due to Na+ influx through rapidly opening Na+ channels (the Na+ current, INa). The inactivation of Na+ channels contributes to the rapid repolarization phase. Ca2+ influx through more slowly opening Ca2+ channels (the Ca2+ current, ICa) produces the plateau phase, and repolarization is due to net K+ efflux through multiple types of K+ channels. Recorded extracellularly, the summed electrical activity of all the cardiac muscle fibers is the ECG (discussed below). The timing of the discharge of the individual units relative to the ECG is shown in Figure 29–1. Note that the ECG is a combined electrical record and thus the overall shape reflects electrical activity from cells from different regions of the heart.
FIGURE 29–2
Comparison of action potentials in ventricular muscle and diagram of the membrane potential of pacemaker tissue. A) Phases of action potential in ventricular myocyte (0–4, see text for details) are superimposed with principal changes in current that contribute to changes in membrane potential. B) The principal current responsible for each part of the potential of pacemaker tissue is shown under or beside the component. L, long-lasting; T, transient. Other ion channels contribute to the electrical response. Note that the resting membrane potential of pacemaker tissue is somewhat lower than that of atrial and ventricular muscle.
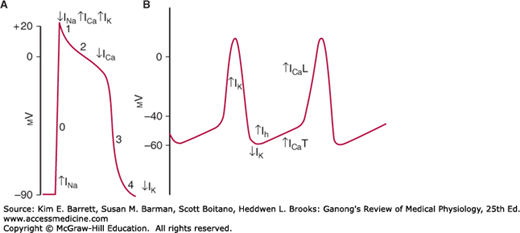
Rhythmically discharging cells have a membrane potential that, after each impulse, declines to the firing level. Thus, this prepotential or pacemaker potential (Figure 29–2B) triggers the next impulse. At the peak of each impulse, IK begins and brings about repolarization. IK then declines, and a channel permeable to both Na+ and K+ is activated. Because this channel is activated following hyperpolarization, it is referred to as an “h” channel; however, because of its unusual (funny) activation it has also been dubbed an “f” channel and the current produced as “funny current.” As Ih increases, the membrane begins to depolarize, forming the first part of the prepotential. Ca2+ channels then open. These are of two types in the heart, the T (for transient) channels and the L (for long-lasting) channels. The calcium current (ICa) due to opening of T channels completes the prepotential, and ICa due to opening of L channels produces the impulse. Other ion channels are also involved, and there is evidence that local Ca2+ release from the sarcoplasmic reticulum (Ca2+ sparks) occurs during the prepotential.
The action potentials in the SA and AV nodes are largely due to Ca2+, with no contribution by Na+ influx. Consequently, there is no sharp, rapid depolarizing spike before the plateau, as there is in other parts of the conduction system and in the atrial and ventricular fibers. In addition, prepotentials are normally prominent only in the SA and AV nodes. However, “latent pacemakers” are present in other portions of the conduction system that can take over when the SA and AV nodes are depressed or conduction from them is blocked. Atrial and ventricular muscle fibers do not have prepotentials, and they discharge spontaneously only when injured or abnormal.
When the cholinergic vagal fibers to nodal tissue are stimulated, the membrane becomes hyperpolarized and the slope of the prepotentials is decreased (Figure 29–3) because the acetylcholine released at the nerve endings increases the K+ conductance of nodal tissue. This action is mediated by M2 muscarinic receptors, which, via the βγ subunit of a G protein, open a special set of K+ channels. The resulting IKAch slows the depolarizing effect of Ih. In addition, activation of the M2 receptors decreases cyclic adenosine 3′,5′-monophosphate (cAMP) in the cells, and this slows the opening of Ca2+ channels. The result is a decrease in firing rate. Strong vagal stimulation may abolish spontaneous discharge for some time.
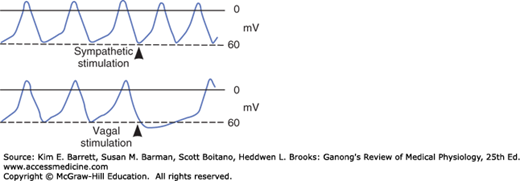
Conversely, stimulation of the sympathetic cardiac nerves speeds the depolarizing effect of Ih, and the rate of spontaneous discharge increases (Figure 29–3). Norepinephrine secreted by the sympathetic endings binds to β1 receptors, and the resulting increase in intracellular cAMP facilitates the opening of L channels, increasing ICa and the rapidity of the depolarization phase of the impulse.
The rate of discharge of the SA node and other nodal tissue is influenced by temperature and by drugs. The discharge frequency is increased when the temperature rises, and this may contribute to the tachycardia associated with fever. Digitalis depresses nodal tissue and exerts an effect like that of vagal stimulation, particularly on the AV node (Clinical Box 29–1; also see Clinical Box 5–6).
CLINICAL BOX 29–1 Use of Digitalis
Digitalis, or its clinically useful preparations (digoxin and digitoxin) has been described in medical literature for over 200 years. It was originally derived from the foxglove plant. (Digitalis purpurea is the name of the common foxglove.) Correct administration can strengthen contractions through digitalis inhibitory effects on the Na, K ATPase, resulting in greater amounts of Ca2+ release and subsequent changes in contraction forces. Digitalis can also have an electrical effect in decreasing AV nodal conduction velocity and thus altering AV transmission to the ventricles.
THERAPEUTIC HIGHLIGHTSDigitalis has been used for treatment of systolic heart failure. It augments contractility, thereby improving cardiac output, improving left ventricle emptying, and decreasing ventricular filling pressures. Digitalis has also been used to treat atrial fibrillation and atrial flutter. In this scenario, digitalis reduces the number of impulses transmitted through the AV node and thus, provides effective rate control.
In both these instances alternative treatments developed over the past 20 years and the need to tightly regulate dose due to significant potential for side effects have reduced the use of digitalis. However, with better understanding of mechanism and toxicity, digitalis and its clinically prepared derivatives remain important drugs in modern medicine.
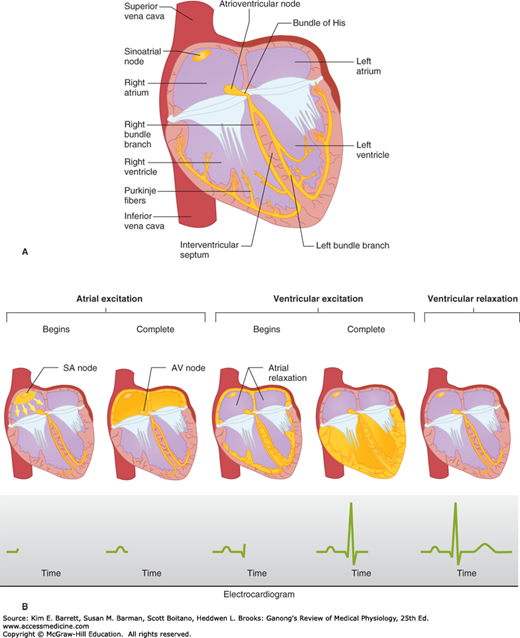
Depolarization initiated in the SA node spreads radially through the atria, then converges on the AV node. Atrial depolarization is complete in about 0.1 s. Because conduction in the AV node is slow (Table 29–1), a delay of about 0.1 s (AV nodal delay) occurs before excitation spreads to the ventricles. It is interesting to note here that when there is a lack of contribution of INa in the depolarization (phase 0) of the action potential, a marked loss of conduction is observed. This delay is shortened by stimulation of the sympathetic nerves to the heart and lengthened by stimulation of the vagi. From the top of the septum, the wave of depolarization spreads in the rapidly conducting Purkinje fibers to all parts of the ventricles in 0.08–0.1 s. In humans, depolarization of the ventricular muscle starts at the left side of the interventricular septum and moves first to the right across the mid portion of the septum. The wave of depolarization then spreads down the septum to the apex of the heart. It returns along the ventricular walls to the AV groove, proceeding from the endocardial to the epicardial surface (Figure 29–4). The last parts of the heart to be depolarized are the posterobasal portion of the left ventricle, the pulmonary conus, and the uppermost portion of the septum.
FIGURE 29–4
Normal spread of electrical activity in the heart. A) Conducting system of the heart. B) Sequence of cardiac excitation. Top: Anatomic position of electrical activity. Bottom: Corresponding electrocardiogram. The yellow color denotes areas that are depolarized. (Reproduced with permission from Goldman MJ: Principles of Clinical Electrocardiography, 12th ed. Originally published by Appleton & Lange. Copyright © 1986 by McGraw-Hill.)
THE ELECTROCARDIOGRAM
Because the body fluids are good conductors (ie, because the body is a volume conductor), fluctuations in potential, representing the algebraic sum of the action potentials of myocardial fibers, can be recorded extracellularly. The record of these fluctuations in potential during the cardiac cycle is the ECG.
The ECG may be recorded by using an active or exploring electrode connected to an indifferent electrode at zero potential (unipolar recording) or by using two active electrodes (bipolar recording). In a volume conductor, the sum of the potentials at the points of an equilateral triangle with a current source in the center is zero at all times. A triangle with the heart at its center (Einthoven triangle, see below) can be approximated by placing electrodes on both arms and on the left leg. These are the three standard limb leads used in electrocardiography. If these electrodes are connected to a common terminal, an indifferent electrode that stays near zero potential is obtained. Depolarization moving toward an active electrode in a volume conductor produces a positive deflection, whereas depolarization moving in the opposite direction produces a negative deflection.
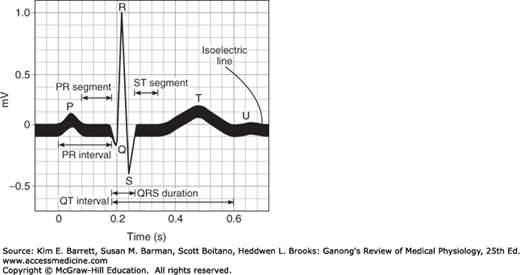
The names of the various waves and segments of the ECG in humans are shown in Figure 29–5. By convention, an upward deflection is written when the active electrode becomes positive relative to the indifferent electrode, and a downward deflection is written when the active electrode becomes negative. As can be seen in Figure 29–1, the P wave is primarily produced by atrial depolarization, the QRS complex is dominated by ventricular depolarization, and the T wave by ventricular repolarization. The U wave is an inconstant finding that may be due to ventricular myocytes with long action potentials. However, the contributions to this segment are still undetermined. The intervals between the various waves of the ECG and the events in the heart that occur during these intervals are shown in Table 29–2.
FIGURE 29–5
Waves of the ECG. Standard names for individual waves and segments that make up the ECG are shown. Electrical activity that contributes the observed deflections are discussed in the text and in Table 29–2.
| Normal Durations | |||
|---|---|---|---|
| Intervals | Average | Range | Events in the Heart during Interval |
| PR intervala | 0.18b | 0.12–0.20 | Atrioventricular conduction |
| QRS duration | 0.08 | to 0.10 | Ventricular depolarization |
| QT interval | 0.40c | to 0.43 | Ventricular action potential |
| ST interval (QT minus QRS) | 0.32 | … | Plateau portion of the ventricular action potential |
Bipolar leads were used before unipolar leads were developed. The standard limb leads each record the differences in potential between two limbs. Because current flows only in the body fluids, the records obtained are those that would be obtained if the electrodes were at the points of attachment of the limbs, no matter where on the limbs the electrodes are placed. In lead I, the electrodes are connected so that an upward deflection is inscribed when the left arm becomes positive relative to the right (left arm positive). In lead II, the electrodes are on the right arm and left leg, with the leg positive; and in lead III, the electrodes are on the left arm and left leg, with the leg positive.
An additional nine unipolar leads, that is, leads that record the potential difference between an exploring electrode and an indifferent electrode, are commonly used in clinical electrocardiography. There are six unipolar chest leads (precordial leads) designated V1–V6 (Figure 29–6)
Stay updated, free articles. Join our Telegram channel

Full access? Get Clinical Tree


