Learning Objectives
- Recognize the rationale for summary measures of population health
- Understand the attributes of mortality, morbidity, and disability as they apply to burden of disease
- Describe various composite measures of burden of disease, their relative strengths and weaknesses, and how they are used in public health literature, World Health Organization reports, and the lay press
- Identify the changing global health risks and effective interventions to prevent disease and injury
- Understand how data on global health measures affect international development, policy change, and their limitations
- Apply the global burden of disease study to understanding poverty and global health inequalities
Rationale for Composite Indicators
Measuring the impact of diseases on populations is a prerequisite for determining effective ways to reduce the burden of illness. Traditional methods of quantifying disease in populations, such as incidence, prevalence, mortality, birth rate, and infant mortality rate, do not capture nonfatal health outcomes. In the past 3 decades, significant international effort has been put into the development of composite indicators that include both mortality and morbidity measures to make judgments about the health of populations and to identify which interventions would have the greatest effect.
The growth of aging populations and the increase of associated chronic diseases have provided an impetus to examine nonfatal health outcomes and the associated quality of life. Disability and suffering are difficult to quantify because they involve complex, subjective notions of pain, discomfort, and emotional distress that are interpreted within a social and cultural context. Prior work on health-related quality-of-life (HRQL) measures, measures of utility or preference-weighted measures, the 1980 International Classification of Impairment, Disability and Handicaps by the World Health Organization (WHO), and the later International Classification of Functioning, Disability and Health, a classification of health and health-related domains, laid the framework for the development of morbidity measures that would be incorporated into summary measures of population health.
The benefits of having a common currency to measure the magnitude of health problems include the following abilities:
- Comparing the health of populations
- Monitoring trends over time
- Conducting cost-effectiveness analyses
- Measuring the population-wide benefits of health interventions
Implicit in the applications of these measures is the ability to assess global health inequalities; to inform debates on priorities for health service delivery and for planning, research, and development in the health sector; and to improve public health curricula and training.1
Capturing timely accurate data is a particular concern, especially in resource-poor settings. Mortality information is probably the most widely available kind of health information, obtained through death certificates, vital registration, and verbal autopsy studies, but even this type of data is found to be incomplete and unreliable. An adult who presents with fever, diarrhea, and hypotension to a district hospital and dies before any definitive diagnostic testing may have died from malaria, dysentery, sepsis, and/or acquired immunodeficiency syndrome (AIDS). Data about morbidity presented in the literature are often based on self-perceived or observed assessments, household surveys, and interview information. As this chapter examines the methods used to assess the global burden of disease, keep in mind that all measures of population health involve choices and value judgments in both their construction and their application.2
Health Expectancies and Health Gaps
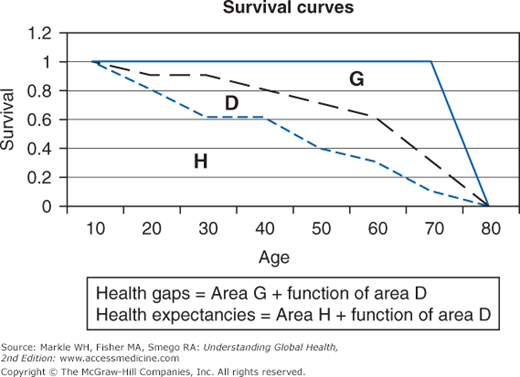
The two types of composite measures are health expectancies and health gaps. Figure 2-1 illustrates a typical survivorship curve for a hypothetical population.1 The area under the middle curve (black dashed line) is divided into two components: H, which represents health expectancy (time lived in full health), and D, which represents time lived at each age in some defined level of disability. Life expectancy at birth (the middle curve [black dashed line]) is simply H + D. The top curve (blue unbroken line) signifies an ideal goal of full health until death for the population. The area G between the middle curve (life expectancy) and the top curve is equivalent to premature mortality. A health gap is then area G and some function of area D. How you define area D (disability weights) is a major issue wrestled with by the various composite measures. This chapter touches on quality-adjusted life year (QALY) and health-adjusted life expectancy (HALE) as examples of health expectancy measures and focuses on disability-adjusted life years (DALYs) as an example of a health gap measure.
QALY is a measure of health outcomes that incorporates both the quality and quantity of life lived into a single index number, originally developed over 30 years ago for cost-effectiveness analysis. The QALY calculation is derived from the change in utility value (individual preference for different nonfatal health outcomes) induced by the treatment multiplied by the duration of the treatment effect to provide the number of QALYs gained. A year of perfect health is considered equal to 1.0 QALY. The value of a year of ill health is discounted. For example, a year bedridden might have a value equal to 0.5 QALY. Extending someone’s life for a year at one-half full health is equal to 0.5 QALY, which is also equal to extending two people’s lives by a year at one-fourth full health! To permit aggregation of QALY changes, an improvement in health from 0.4 to 0.6 QALY is numerically equivalent to an improvement from 0.7 to 0.9. As another example, a woman who is healthy in her first 60 years of life with a HRQL valued at 0.95 experiences severe pneumonia with complications that decreases her HRQL to 0.7 until her death at age 62. Although she lives to age 62, she only attains 58 QALYs in her life path: (0.95 × 60) + (0.7 × 2).
Traditional QALYs are built using HRQL weights that are not attached to any particular disease or condition but to individual health status. A number of approaches—standard gamble, time trade-off, or rating scales—have been used to generate quality-of-life valuations, also referred to as health utilities. The time trade-off method requires the respondents to value health states by making explicit what they would be willing to sacrifice in terms of time or risk of death to return to better or perfect health. The Health Utility Index, the EuroQoL EQ-5D, the WHO Quality of Life, and the SF-36 represent commonly used instruments for the measurement and valuation of HRQL, and they include key domains such as physical, psychological, and social role function, health perceptions, and symptoms (Table 2-1).
HUI | SF-36 | EuroQol EQ-5D | WHOQoL |
|---|---|---|---|
Vision | Physical function (PF) | Mobility | Physical health |
Hearing | Role—physical (RP) | Self-care | Psychological |
Speech | Bodily pain (BP) | Usual activities | Level of independence |
Ambulation | General health (GH) | Pain/discomfort | Social relations |
Dexterity | Vitality (VT) | Anxiety/depression | Environment |
Emotion | Social function (SF) | Spirituality/religion/ personal beliefs | |
Cognition | Role—emotional (RE) | ||
Pain | Mental health (MH) |
Finally, QALYs can then be incorporated with medical costs to arrive at a final common denominator of cost/QALY, or the cost-utility analysis. If, for example, a standard intervention allows a patient to live for 1 additional year than if no intervention had taken place, but only with a quality-of-life weight of 0.8, then the intervention confers 1 × 0.8 = 0.8 QALY to the patient. If a new intervention confers 2 extra years of life at a quality-of-life weight of 0.6, then it confers an additional 2 × 0.6 = 1.2 QALYs to the patient. The net benefit of the new over the standard intervention is therefore 1.2 − 0.8 = 0.4 QALY. The difference in treatment costs ($10,000) is divided by the QALYs gained (0.4) to calculate the cost per QALY, or $25,000 per QALY.
Example: The Cost Effectiveness of Routine Voluntary Human Immunodeficiency Virus Screening in South Africa
As of 2011, more than half of all South Africans living with human immunodeficiency virus (HIV) remained unaware of their infection and unable to access counseling and lifesaving care. Using a simulation model of HIV case detection and treatment, Walensky and colleagues examined three HIV screening scenarios in addition to current practice: one time, every 5 years, and annually.3 They found a 16.9% HIV prevalence, a 1.3% annual incidence, a 49% test acceptance rate, HIV testing costs of $6.49/patient, and a 47% linkage-to-care rate (including two sequential antiretroviral therapy regimens) for identified cases. Annual routine HIV screening in South Africa increases the per person quality-adjusted life expectancy (LE) of an HIV-infected individual by 16.6 months, even when assuming highly constrained rates of acceptance and linkage to care. Annual screening is very cost effective ($1,720/QALY). This study has started to address the critical question of whether frequent HIV screening is clinically beneficial and economically viable for South Africa as researchers and policymakers tackle the bigger “HIV treatment as prevention” strategies globally.
Using a Markov model, Salomon and colleagues estimated the incremental cost/QALY gained of $29,300 for men and $48,800 for women without fibrosis on biopsy using a combination therapy of interferon and ribavirin compared with no treatment in hepatitis C virus (HCV) infection.4 The expected benefits of therapy are derived mostly from improvements in HRQL rather than from survival outcomes. Although considered reasonably cost effective, these results depend on assumptions about quality of life associated with mild HCV infection and treatment, and they vary widely among different patient subgroups. More information is needed on the quality weights associated with chronic liver disease and the decrements in quality of life associated with its treatment.
Healthy life expectancy (HLE) in combining the length and quality of life has become a standard summary measure of population health in many developed countries. Monitoring health expectancies allows countries to evaluate their population’s health to see whether longer life is being spent in good health or ill health. Health expectancies can be created by adjusting LE for disability, specific disease, or for self-perceived health. Population health surveys assess self-perceived health or functional status. Levels of reported ill health are combined with mortality data to estimate the number of years of healthy life an individual will live. HLE, formerly known as disability-adjusted life expectancy, is also referred to as health adjusted life expectancy (HALE).
Various methods exist for calculating health expectancies. The Sullivan method is the only one for which data are widely available. It requires only a population life table that can be constructed for a population using the observed mortality rates at each age for a given time period, prevalence data for each type of disability at each age, and the weight assigned to each type of disability. Such prevalence rates can be obtained readily from cross-sectional health or disability surveys carried out for a population at a point in time. Levels of self-reported health vary systematically over time and social groups, making comparisons difficult. The Sullivan method, which uses observed prevalence estimates, is criticized for not producing a pure period indicator. The prevalence rates depend partly on earlier health conditions of each age cohort, and by not considering transition rates in and out of the health states, it is not capable of detecting rapid changes in population health.5
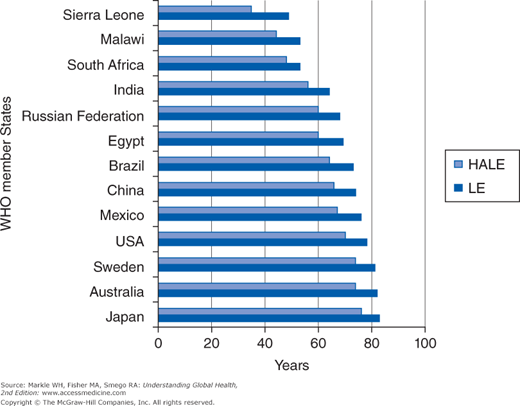
The International Network on Health Expectancies (Réseau Espérance de Vie en Santé [REVES]) has developed and promoted the concept and methods of health expectancies, which the European Union (EU) member states have adopted to monitor trends in health across the EU. The WHO uses data from the Global Burden of Disease (GBD) Study, the WHO Multi-Country Survey Study, and the World Health Survey to make independent estimates of severity-adjusted prevalence by age and sex for survey countries and life tables constructed with Sullivan’s method to compute HALE for 193 countries. According to the WHO, in 2007 the range of healthy LE was more than twofold, ranging from 35 years in Sierra Leone to 76 years in Japan (Figure 2-2). Global HLE at birth was 58 years in 2002 and 59 in 2007.
The Global Burden of Disease Study 2010, published after most of this chapter was written, looked at healthy life expectancy for 187 countries. It found that HALE had increased more slowly than LE over the past 20 years, with a 1 year increase in LE being associated with a 0.8 year increase in HALE. The global male HALE in 2010 was 58.3 years and the global female HALE was 61.8 years. Between 1990 and 2010, male HALE had increased by at least 5 years in 42 countries and female HALE had increased in 37 countries. However male HALE had decreased in 21 countries and female HALE had decreased in 11.6
It is difficult to relate health expectancies back to disease and risk factor causes because all disease and injury contribute to the risk of death or disability at each age, and the health expectancy is a weighted sum of these risks across all ages in a population life table. However, studies that involve decomposition of HLE into specific conditions, lifestyle, and health behaviors may lead to focused interventions to compress disability and/or reduce mortality with potentials for addressing health disparities across sociodemographic groups. In Europe, the United Kingdom, and Canada, HLE is playing an important role in a country’s fiscal health planning, such as retirement/pension benefits and long-term care spending. In the United States, researchers and policymakers are starting to make the case for the adoption of HLE at the national, state, community, and health care system levels to guide health improvement efforts.7
Potential years of life lost (PYLL) is a simple summary measure of premature mortality defined as the total number of years lost through the failure of individuals to live their expected number of years. The advantage of PYLL over crude mortality rates is that the crude mortality rate is weighted by the large number of deaths occurring in older people. PYLL allows decision makers and others to selectively evaluate leading causes of mortality in younger age groups. For example, if we define premature death as death before age 65, a person dying at age 52 from heart disease would represent 13 PYLL. The major limitation of the PYLL approach is that it does not count death at or above the potential (age 65 or 75 years) and hence cannot measure the benefits of health interventions in this age group. Moreover, morbidity and disability are not considered in this indicator. The US Centers for Disease Control and Prevention (CDC) has published statistics on years of potential life lost (YPLL, which is the same as PYLL) by race, sex, region/state, and by leading causes and risk factors (http://webappa.cdc.gov/sasweb/ncipc/ypll10.html).
According to data on drinking indicators from the WHO’s Comparative Risk Assessment Study, 851,900 deaths and 19,051,000 PYLL for people 15 years and older worldwide were due to injuries attributable to alcohol consumption in 2004.8
According to the National Cancer Institute, on average, each person who died from cancer in 2007 lost an estimated 15.4 years of life. Cancer deaths were responsible for more than 8.6 million PYLL, which is more than heart disease and all other causes of death combined. Lung cancer accounted for nearly 2.4 million PYLL, the most by far for any cancer, partially because of the relatively low percentage of survival and the relatively early age of onset.9
The DALY metric was developed in the original GBD 1990 Study under the leadership of Murray and Lopez, the World Bank, WHO, and the Harvard School of Public Health to assess the burden of disease consistently across diseases, risk factors, and regions. Since 2000, the WHO has published regular GBD updates for 14 regions. The 2010 Global Burden of Diseases, Injuries, and Risk Factors Study, funded by the Bill and Melinda Gates Foundation and led by the Institute for Health Metrics and Evaluation, is the first major effort since the original GBD 1990 Study to carry out a complete systematic assessment of global data for 220 diseases and injuries and more than 60 risk factors for 21 regions of the world.
DALY belongs to the second group of composite indicators called health gaps and involves estimates of HRQL attached to specific diseases, rather than to health states (as in QALY). DALYs for a disease or health condition are calculated as the sum of the years of life lost (YLL) due to premature mortality for each disease and the years lost to disability (YLD) based on the incidence of cases of the health condition. DALY = YLL + YLD. YLL = N × L, where N is the number of deaths and L is standard LE at age of death in years. YLD = I × DW × L, where I is the number of incident cases, DW is disability weight, and L is the average duration of the case until remission or death in years. In the GBD Study 2010 YLDs are computed as the prevalence of different disease-sequelae and injury-sequelae multiplied by the DW for that sequela.
In the original study, severity scores for disability or disability preference weights for 22 sample diagnoses or indicator conditions were determined by an international panel of experts. An iterative “person trade-off” approach was used—participants chose whether it was more desirable to treat a given number of people with one condition than to treat a given number with another condition. They then created seven disability classes, and once preference scores for a set of index conditions were established, weights for hundreds of other conditions were mapped by extrapolation. Weights of 1 are equated with full disability or death, and 0 with no disability or full health on the DALY scale. These DWs are thought to be equal or universal across countries and cultures. With the Global Burden of Disease Study 201010, a reassessment of DWs was made with surveys in representative countries. 30,230 people participated in either household or web-based surveys. There was a high degree of consistency and the highest disability weights were given to schizophrenia and severe multiple sclerosis. The new weights were found in general to agree with the old weights, although in the mild range, many conditions were given lower rates than previously. See Table 2-2 for a comparison of sample sequelae and their DWs from the GBD 2004. An extensive list of disability weights for 220 unique health states can be found in the GBD Study 2010.10
Sequela | Average disability weight | Range | Source |
|---|---|---|---|
LBP, episode of limiting LBP | 0.061 | Netherlands study | |
AIDS cases on ART | 0.167 | 0.165-0.469 | GBD 2004 |
Glaucoma, low vision | 0.170 | GBD 2004 | |
Unipolar depressive disorders, moderate depressive episode | 0.350 | Netherlands study | |
Ischemic heart disease, acute myocardial infarction | 0.439 | 0.405–0.477 | GBD 1990 |
COPD, severe symptomatic cases | 0.530 | Netherlands study | |
Cerebrovascular disease, first-ever stroke cases | 0.920 | GBD 1990 |
The original DALY architects made two additional adjustments. The first of these is an age weighting that gives greater value to years lived in young adulthood and less to years lived at the beginning and end of life. The value of a healthy person’s life peaks around age 25 by this calculation. The final adjustment to the DALY formula is to discount time in the future at a rate of 3%. The idea is that a future benefit is worth less than one you get now. A treatment that extends a person’s lifespan from 65 to 75 is more cost effective if provided to a 65-year-old than to a 50-year-old who sees no benefit for another 15 years.
Using road traffic injury (RTI) mortality estimates from verbal autopsy study, vital registration, and the proportion and severity of long-term disabilities from a Thai study, Ditsuwan and colleagues found the total loss of DALYs due to RTIs was 673,000 in 2004.11 Mortality contributed 88% of this burden. The use of local data did lead to a significantly higher estimate of the burden of long-term disability due to RTIs (74,000 vs 43,000 DALYs) using standing GBD methods.
The GBD Study 201010 intended to address some of the criticisms of past burden of disease studies. Household surveys including face-to-face interviews in several countries and one made available on the Web allowed for a diverse set of cultural, demographic, and linguistic contexts. The surveys asked respondents to judge the relative severity of states of health in a series of paired comparisons and time trade-off questions, for example: “Imagine two people—the first person is completely blind, and the second person suffers from constant intense back pain. Who is healthier overall?” Answers are used to calculate a health state severity weight for each sequela. Comparisons could then be made between new and old DWs for around 120 sequelae common to the old and new GBD studies. The GBD Study 2010 identified 1160 sequelae of 291 diseases and injuries. For example, diabetic retinopathy is a sequela of diabetes mellitus. Researchers needed to establish a continuous ordinal scale between DW 0 (perfect health) and DW 1 (death) for each sequela.12 The 2010 GBD team has benefited from new and improved methodologies since the last GBD Study including modeling missing data, DW estimation, cause of death attribution, and data collection techniques that provide better estimates of mortality and the YLD globally. The base case for DALYs in this study has also been simplified to omit both discounting and age weighting. YLLs were calculated with reference to new reference–standard life expectancies at each age. For example, a death at 5 years counts as 81.4 YLLs and a death at 60 years counts as 27.8 YLLs.
Through systematic review of literature, data on human prevalence, the morbidity and mortality of food-borne trematodiasis were extracted. Fürst, Keiser, and Utzinger developed simplified disease models and did meta-analyses on the proportions and odds ratios of specified sequelae and estimated that 56.2 million people were infected with food-borne trematodes in 2005; 7.9 million had severe sequelae and 7,158 died, mostly from cholangiocarcinoma and cerebral infection.13 They estimate that the global burden of food-borne trematodiasis was 665,352 DALYs. This preliminary GBD Study 2010 was chosen to highlight the relevance of this group of neglected tropical diseases.
Table 2-3 offers a comparison of essential features of the various summary measures. DALYs are different from QALYs in their population perspective. From the work of the GBD Study, DALYs allow global comparisons of major diseases and risk factors. DALYs are additive in the sense that they can be additively decomposed with respect to causes and are a more sensitive measure of changes in burden. However, disability states in DALYs do not take account of comorbid conditions. There is no way to capture the burden of diabetes, hypertension, and coronary artery disease within the same individual. DALYs take 82.5 years for women and 80 years for men as their standard LE at birth, based on the average LE of Japanese people, who currently have the longest overall LE in the world. This will lead to overestimation of YLL in high-mortality countries. Through these assumptions about social value of people at different ages and uniform LE in all different countries, Murray and Lopez tried to uphold a moral and political notion of equity and comparability for this population health measure.
Features | QALYs | HALE | DALY |
|---|---|---|---|
Origin and organizations | 1976, Academia/research, North America and Europe | 2000, REVES, EU, OECD, WHO | 1993, WHO, World Bank |
Type | Health expectancy | Health expectancy | Health gap |
Health status instrument | Yes | Yes | No |
Disability weights | Yes | Generic disability or handicap severity classes | Community and expert surveys; epidemiologic data |
Disability measures |


