Chapter 2
The Forecasting Process
Far better an approximate answer to the right question, which is often vague, than an exact answer to the wrong question, which can be made precise.
Tukey
Tell the truth and you will get you head bashed in.
Hungarian proverb
In Chapter 1 we discussed the need for forecasts in the pharmaceutical industry and the role of forecasts in driving decision making across a variety of different functional areas. In this chapter we will examine best practice in forecasting, the methods available to the forecaster, and analytic tools that can be used across forecasting methodologies.
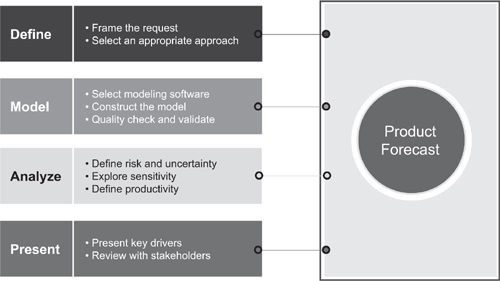
Figure 2.1 The Process of Forecasting
There are four distinct steps that are needed to create a forecast – defining the need for the forecast, selecting the appropriate methodology, analyzing the results, and presenting the forecast to the end user. These steps are shown in Figure 2.1 on the previous page and will be discussed in detail during the remainder of this chapter.
Define the Forecast
The first step in the forecasting process is to understand the use to which the forecast will be directed. Is this a forecast for a new product in late stage development? If so, the forecast may be over a ten year horizon and constructed to yield annual revenue results. Is the forecast for a currently marketed product? If so, the appropriate outputs may need to be at the monthly level, at both revenue and unit levels, and calculated over a two to three year horizon. Is the forecast one that will be used for business development decisions? If so, the forecast algorithm may need to evaluate the role of potential development or marketing partners, or may need to explicitly evaluate the financial terms of any deal that may be constructed. Is the forecast for a single country or multiple countries? The answer to this question may govern the choice of methodology and framework used to evaluate a product’s forecast potential. Is the forecast for a specific disease state that is treated by pharmaceutical as well as non-pharmaceutical interventions? If so, the forecaster may need to model out non-pharmaceutical or over-the-counter interventions as well as pharmaceutical products. Will the forecast be used to drive financial planning, manufacturing, portfolio investment decisions, compensation schemes, or some combination of these and other uses? As you can well imagine, the list of potential questions can be lengthy, but the answers to these questions govern the selection of methodology and forecast construction.
The widespread use of forecasts in multiple business decisions makes it paramount for the forecaster to understand the role of the forecast when they are constructing the model and analysis. The first step in any forecasting exercise is therefore to meet with the recipients and users of the forecast and to understand the business decisions affected by the forecast. Only after understanding the questions that need to be answered can the forecaster select the appropriate methodology and analytics.
BALANCE POINTS IN FORECASTING
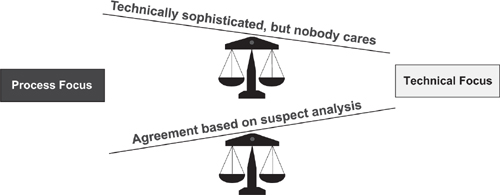
As discussed in Chapter 1, the forecaster often is confronted with balancing the demands of multiple stakeholders and functional groups. This chapter presents another set of balance challenges to the forecaster – that of methods and process in forecasting. This balance point – often overlooked – also may be stated as the balance between ‘breadth’ and ‘depth,’ or the balance between a process or a technical focus. This is an example of the ‘too general’ versus ‘too detailed’ challenge we discussed in Chapter 1 and is illustrated in Figure 2.2. Let’s consider the two extreme points – a forecast that is overly weighted on process versus one overly weighted on the technical side.
A process focus to forecasting implies that organizational ‘buy-in’ to the forecast is a key requirement. The forecast must be able to be widely disseminated and understood within the organization. More importantly, the end users agree to and support the forecast. Sometimes this can compromise the technical sophistication of the forecast. If the forecast needs to be accepted by a broad base of users – for example, manufacturing, marketing, management – the model may be packaged in a way that makes the numbers and the underlying calculations very transparent and easily digested; this may involve sacrificing some of the technical rigor. In an organization that is too heavily process focused the users agree to the result, but often it may well be based on superficial analytics, suspect analysis, or sophistry.
In the other extreme – that of too technical a focus – the forecast construct tends to be very complex. The model may consist of multiple pages in a spreadsheet, have numerous input variables, and employ state-of-the-art risk and uncertainty analysis. Typically, these models, because of the complexity involved, acquire a ‘black box’ feeling to them; the casual user cannot dissect the analytics or make simple changes to the model. The end user must adopt a ‘trust’ strategy for the forecast outputs – believing in the results of the forecast model without needing to understand all the steps and calculations involved. Although technically sophisticated these models typically are not readily agreed to within an organization. In an organization that is too technically focused the explanation for a forecast often is ‘because the model tells us,’ which can lead to distrust of or apathy towards the results. Organizations that rely heavily on this approach to forecasting are trapped in a technical trench.
Figure 2.2 Forecasting is a balancing act
Where that balance point exists, however, is more a function of an organization’s culture than it is of forecasting best practices. For example, in a ‘consensus driven’ organization, where buy-in to the forecast is more valued than the technical underpinnings, the forecasting approach is more process oriented. Conversely, in an ‘analysis driven’ company, the importance of deep technical analysis may be more valued than having all the stakeholders agree to the forecast. To the extent that an organization’s culture focuses exclusively on one end of the balance beam – and ignores the other end – the forecast loses its integrity.
Select a Forecast Method
‘The most dangerous, hideously misused and thought-annihilating piece of technology invented in the past 15 years has to be the electronic spreadsheet. Every day, millions of managers boot up their Lotus 1-2-3s and Microsoft Excels, twiddle a few numbers and diligently sucker themselves into thinking that they’re forecasting the future.’1 This quote by Michael Schrage in 1991 is a provocative one. In fact, he goes on to say that given his choice, he would rather hire a good science fiction writer than an analytical guru to do forecasting (see Appendix A for the full article). The point of these sentiments is that forecasting is much more than placing models in a spreadsheet. It is imagining what the future may hold and then communicating that assessment to others.
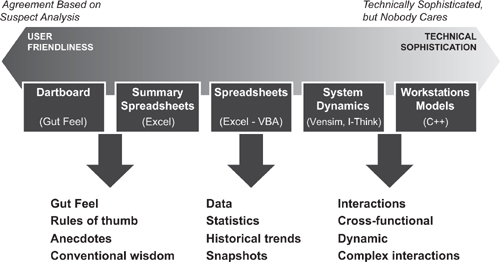
Figure 2.3 Forecast methods
Although it is doubtful that science fiction writers will replace business analysts in the pharmaceutical industry, the lesson of capturing future scenarios into forecast models are important, and a concept that we will revisit when discussing analytic tools that enhance a forecast model. Many of the elements of Michael Schrage’s criticisms are relevant to the pharmaceutical industry, where the ubiquitous tool of choice for forecasting is spreadsheet modeling.
A more comprehensive list of methodologies is illustrated in Figure 2.3 above. As with the balance between process and technique involved in forecasting, there is a similar balance in selecting a forecast methodology. This involves a trade-off between user-friendliness and model complexity. The spectrum presented in Figure 2.3 ranges from the most user friendly technique (gut feel) to complex software models for forecasting. Let’s describe the methods and then discuss how to select an approach for a given forecasting exercise.
DARTBOARD METHODS
The dartboard, or gut feel, approach to modeling relies upon an individual’s knowledge and experience in creating a forecast. The ‘forecast model’ may be as simple as the user writing down the forecast. This is a valid forecast technique, and if the experience and ‘gut feel’ of the forecaster is relevant and accurate this may result in an effective forecast. The user may go through a sophisticated set of analytics and logic in their head, but the result of this technique can be as simple as a pure statement of ‘belief’ from the forecaster. This is a very user-friendly technique and requires little more than pen and paper and some time to reflect. However, if the thought process used by the forecaster has not been documented adequately the forecast takes on a ‘black box’ feel due to lack of transparency. Moreover, using the ‘gut feel’ techniques without documenting and explaining the logic used by the forecaster results in a loss of ‘institutional memory’ if the forecaster moves on to other responsibilities.
WORKSTATION METHODS
At the other extreme – workstation models – typically employ rigorous analytics. These may include statistical time series analysis, longitudinal patient-flow modeling, in-depth analog libraries, or many other techniques. The hallmark of these methods is that the number of data points required to be analyzed is so numerous, or the forecast flows are so convoluted, that sophisticated software programs are required. In these techniques the user typically enters data into the computer along with assumptions and the model presents output forecasts. As with the ‘technical focus’ of the process of forecasting, this can take on a ‘black box’ feel to the forecast, with a methodology and process that are incomprehensible to the average user. Also with these software packages, customization or changing the algorithm for therapy-specific issues is either impossible, or at the very least, difficult.
SIMPLE SPREADSHEET METHODS
Because of the disadvantages of both extremes most organizations use one of the three ‘middle’ methods. Simple spreadsheets, like those created in Excel, are the dominant method of forecast creation today. Most analysts are familiar with spreadsheet software and are comfortable creating formulae to model the market and create forecasts. Most end-users of forecasts are familiar enough with spreadsheet software that they can navigate the model and audit the logic used in forecast creation. Possibly to Professor Schrage’s chagrin, this method is the dominant one used today.
ANALYTIC SPREADSHEET METHODS
There is a migration of methodology from summary spreadsheets to the more complex analytic spreadsheets. These more complex spreadsheet models usually involve navigational tools (for example, moving from country to country or between patient segments) and analytical functions (such as uncertainty analysis and simulation methodology) built into the spreadsheet model. The typical example of this form of model is an Excel spreadsheet that uses Visual Basic for Applications to run the forecast algorithm and create both chart and tabular outputs. The enhanced sophistication of these models is at the expense of user friendliness (if changing the model requires the user to make programmatic changes in the Visual Basic set-up), but many organizations are now choosing this balance point.
SYSTEMS DYNAMICS METHODS
A more sophisticated method that has emerged in the last decade is that of systems dynamics modeling.2 In this approach to forecasting the user can create models that track an individual’s disease progression over time and can create ‘feedback’ loops in the forecast model. For example, if a patient cycles between treatment, remission, and relapse, systems dynamics models can capture this pattern. Trying to model the same dynamic in a spreadsheet model results in the ‘circular reference’ error that plagues users of spreadsheets. The trade-off to systems dynamics models is that they have a very different ‘look and feel’ than spreadsheet models and require a degree of training both to create, use, and interpret the results of these platforms. As pharmaceutical modeling moves more into treatment paradigm and disease progression models, the systems dynamics approach is gaining support. This will be illustrated when we discuss specialty pharmacy forecasting in Chapter 5. There are several commercially available software packages that support systems dynamics models, such as iThink, Vensim, and Powersim.
Examples of all these modeling platforms are given in subsequent chapters and we will discuss each in more depth. The challenge to the forecaster at this point is to select the method that is aligned with an organization’s culture balance between user friendliness and technical complexity.
Which of these methods yield the more accurate result? None of them. A forecaster with good experience and insight can create a ‘gut feel’ forecast that is just as accurate – if not more so – than a sophisticated software package. Which of these methods is more transparent? The ones in the middle. The ‘gut feel’ methods lack transparency when the logic that is used to develop the forecast is resident only within the forecaster’s thoughts and is not documented and explained in the forecast. The ‘workstation models’ lack transparency when the algorithm and processing of the data are too ‘black box.’ Which of these methods is more defensible? The ones in the middle, due to their transparency.
ALIGNMENT WITH LIFECYCLES
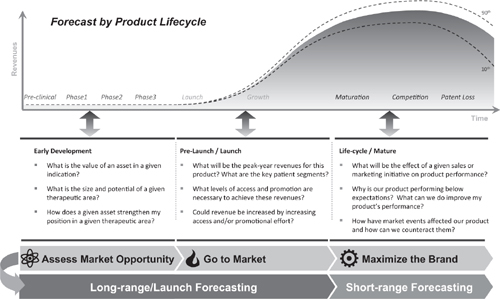
The choice of forecast method not only depends upon the balance between user friendliness and model complexity, but also is closely aligned with the lifecycle of a product. Figure 2.4 illustrates a typical lifecycle for a pharmaceutical product, from preclinical research through launch and on to loss of marketing exclusivity.
Earlier we posed the question of whether or not a single forecast model can be used throughout the lifecycle of a product. The answer is no. This is because of a dramatic change in methodology that occurs when a product launches to the market and starts to generate time series data. The launch of a product to market begins the generation of data related to a product’s use – prescriptions, days of therapy, pills dispensed, and so forth. The advent of data, more specifically time series data, forces a change in forecasting methods from the more ‘qualitative’ methods to ‘quantitative’ ones. We will revisit this distinction after we discuss some of the qualitative issues that a forecaster must address in modeling.
Figure 2.4 Alignment of forecast approaches with the product lifecycle
QUALITATIVE AND QUANTITATIVE METHODS
The primary job of the forecaster is to blend qualitative factors into a quantitative framework that creates revenue and unit expectations for a product. This blending is illustrated in Figure 2.5
Stay updated, free articles. Join our Telegram channel

Full access? Get Clinical Tree


