INTRODUCTION
In Dr Linda Burke-Galloway’s own words, “it is a unique and humbling experience when a physician becomes the patient.” Her ophthalmologist (eye doctor) recommended a surgical procedure that would be necessary to preserve her vision. As a public health physician with 23 years of experience, Dr Burke-Galloway thought she knew what to expect when she went to the hospital. And she did. It’s what happened after the hospital and routine recovery that floored her.
One day after work she opened an envelope containing a medical bill for $13,298.02. After blinking to make sure her vision was indeed working, she went through the individual line items and noticed equally astounding prices. $78 for a $4 antibiotic called gentamycin. $863.20 for a $192 pair of disposable forceps. And on it went.
Assuming a mistake occurred, she first verified the discrepant prices and compared them to those listed by medical supply companies. She then contacted the hospital only to find that no one knew how to address her concerns. Not the auditing department. Not the CEO’s office. Ultimately, she received a jolting final response to her appeal: “…when you sign consent for a procedure, you’re allowing us to charge anything we want to…” How could this be right?
In the United States, healthcare prices are opaque—hard to predict, justify, or even understand. Unlike almost everything else that Americans buy, healthcare services can seem impossible to shop for. Patients frequently make purchases without knowing the prices or even fully knowing what is being sold. When the bill arrives (weeks later) it is filled with cryptic information: diagnosis and procedure codes, unfamiliar line items, and confusing calculations involving total charges, deductibles, and copayments (Figure 3-1). As major expenses go, few of us would be willing to buy a car or house under similar circumstances. And yet this is exactly how healthcare is purchased all the time. Princeton economist Uwe Reinhardt has described US healthcare pricing as “chaos behind a veil of secrecy.”1
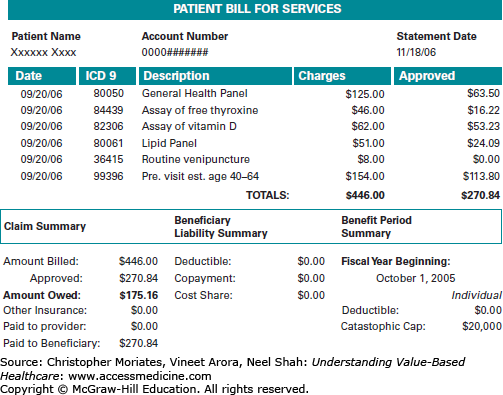
Clinicians are no more privy to the vagaries of healthcare pricing than patients are. In the true story above, Dr Burke-Galloway—despite decades of experience in both clinical care and public health—was bewildered by several aspects of the bill she received: the inflated prices of individual items, the total amount in the bottom line, and most of all, the inability of anyone to explain it to her. Sadly, the circumstances she found herself in are common in the United States and for many Americans the consequences are severe. Even among the insured, medical bills have become a leading cause of personal debt.2 Carey Goldberg, a public radio journalist who covers healthcare, pointed out that “sticker shock” after receiving a medical bill is “becoming a rite of passage for Americans.”3 As Americans continue to face greater cost sharing under high-deductible plans (Chapter 2), patients will be increasingly sensitive to prices. It goes without saying that clinicians are the ones who decide what goes on the bill.
This chapter reviews the many challenges of understanding healthcare pricing in the current system, along with approaches to achieve price transparency. However, it is worth pausing for a moment to reflect on how we got here. As we discussed in Chapter 2, healthcare purchasing at the beginning of the 19th century was more straightforward. Prices were negotiated between patients and clinicians, and payments were made “out-of-pocket” with cash or in-kind bartered goods. This was possible because clinicians were self-reliant and were able to carry most of the diagnostic tools and therapies they needed in a single small bag. Because the infrastructure of hospitals was seldom necessary outside of mass casualties or epidemics, it was common and convenient for the clinician to simply travel to the patient’s bedside.
At the turn of the 21st century the delivery of medicine looks very different. The small doctor’s bag has been replaced by an expensive array of technologies that are not easily portable. House calls are rare and patients must typically travel to the clinicians. Moreover, large teams of care have become the norm. In observing his mother’s recovery from a routine knee replacement surgery, Harvard surgeon and writer Dr Atul Gawande counted 63 different clinicians involved in her care during her short 3-day hospitalization: 19 doctors (including surgeons, radiologists, and anesthesiologists), 23 nurses, 5 physical therapists, 16 patient-care assistants, plus x-ray technologists, transport workers, and nurse practitioners.4 This type of medicine has evolved to require the economies of scale that result from large organizations, and as a result prices are no longer determined within the confines of the doctor-patient relationship. Instead prices are separately determined through closed-door negotiations between insurance companies and provider organizations. Today clinicians seldom set prices from the bedside and patients rarely negotiate prices directly with their caregivers.
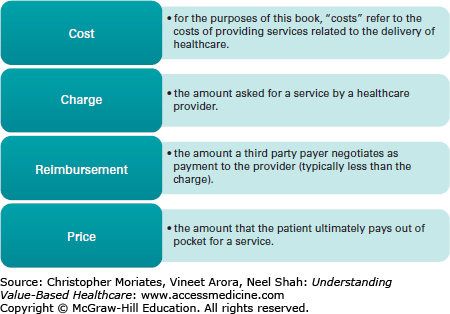
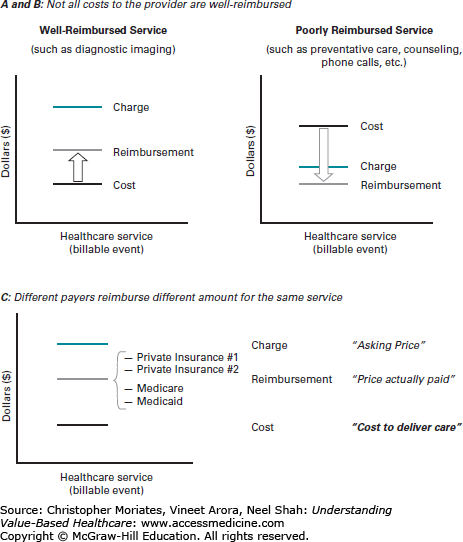
Currently, healthcare is paid for through a complex matrix of transactions that occur between providers, technology vendors, insurance companies, and other stakeholders. Each party is incentivized to charge different amounts to different customers and keep the amounts secret in order to maximize their profits. In many areas of the economy prices are determined through the meeting of supply and demand. Prices fall somewhere between the “costs of production” (ie, what it costs to deliver care) and the willingness of the customer to pay. By contrast, in healthcare multiple transactions are required to deliver a single service, thereby disconnecting prices from both what it costs to deliver care and the willingness of patients to pay. Along the way, the dollars changing hands are given different names such as “costs,” “charges,” “reimbursements,” and of course “prices” (Figure 3-2). In each transaction the amounts are altered so that the final price bears little resemblance to the original cost of production, much in the way the final whispered message in the children’s game “telephone” bears little resemblance to the original phrase. Information asymmetries between multiple stakeholders, clinical uncertainty, and lack of reliable data sources all add to the difficulty of determining prices upfront.
If this seems thoroughly confusing, don’t worry. In fact, that is the point. The aim of this chapter is to explain why healthcare pricing is so hard to understand. We break this task into two components: understanding why prices appear to vary arbitrarily, and understanding why these prices are so challenging for patients to meaningfully interpret.
VARIABLE PRICES AND THE MULTIPLE STAKEHOLDER DILEMMA
The first step to understanding healthcare pricing requires unraveling why prices for the exact same service will vary so tremendously from provider to provider, payer to payer, and patient to patient—a problem rooted in what we call the “multiple stakeholder dilemma.” In the simple 19th century approach, healthcare transactions occurred between an individual clinician and an individual patient. In the complex 21st century approach, healthcare transactions occur between large provider organizations (composed of multiple clinicians who must coordinate their efforts) and large payer organizations (composed of multiple patient “members” of an insurance company with pooled costs and financial risks). This setup introduces a “third party” to the payment relationship with different stakes in the transaction from the individual patient or the individual clinician. As a result, providers, payers, and patients are distinct parties who each evaluate costs differently (Figure 3-3).5
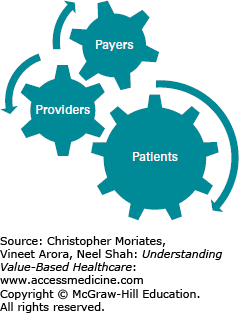
To providers, costs are the expense incurred to deliver healthcare services to patients.
To payers, costs are the amount payable to the provider for services rendered.
To patients, costs are the amount payable out-of-pocket for healthcare services.
In the 1980s, I (NS) grew up in a community of expatriate Indian Americans on the Jersey Shore, many of whom were physicians who began their careers by starting their own small private practices. When I went to medical school in the early 2000s I assumed that one day I too would hang a shingle and open a doctor’s office. That is not what happened—graduating clinicians-in-training rarely hang shingles anymore. The majority of us will apply to a human resources department and sign corporate employment contracts. Over the last few decades, fierce competition and mounting regulatory pressure has prompted many small practices to join large provider organizations, including independent physician’s associations, affiliated hospitals, and in some cases expansive multi-institutional delivery systems (California-based Kaiser-Permanente is a good example, comprised of 167,300 employees, 14,600 physicians, 37 medical centers, and 611 medical offices).6
One way to start understanding healthcare prices is to deconstruct the costs of delivering care at a small organization and then work our way up. In a small private practice on the Jersey Shore, the total costs of delivering care might be calculated similarly to any other business and divided into the expenses of staff salaries, short-term supplies, and long-term capital equipment investments. In theory, the expenses in each of these categories might be further divided up in order to determine the cost per patient. In practice however, parsing the cost of caring for individual patients is not straightforward. Some patients require many types of healthcare services over lengthy and unpredictable intervals of time. How do you calculate the costs of caring for a patient who receives a portion of their care at a different facility? How do you allocate the cost of an x-ray machine with a 7-year lifespan to a patient that only needs the machine for 7 minutes? For a small private practice, these calculations are cumbersome and may not be helpful in informing their business practices.
For corporations with multiple clinical and administrative departments, expenses are even more challenging to determine at the patient level. Typically, larger provider organizations will use sophisticated financial management software to track the patient’s utilization of “billable items” that have discrete wholesale costs (such as medicines in the pharmacy or linens from the supply closet). However, many important costs of delivering care cannot be easily tracked this way. Costs such as the time of the nurses and the overhead of maintaining a blood bank are rarely calculated as a line item on the patient’s bill. Moreover, each department—from orthopedics to waste management—may have primary responsibility for managing their own budget, which means different departments may use different accounting methods. Typically, in order to get department-level budgets to balance, a health system may create cross-department subsidies and other cost allocations that further obfuscate the patient-level costs of production.
Financial accounting in healthcare is challenging but not impossible and Chapter 4 will discuss methods for deciphering patient-level costs in greater detail. However as you can already tell, there are several immediate limitations of using the costs to the provider to understand patient prices. First, for the reasons described above, the costs to the provider are crude estimates at best— particularly for complex episodes of care. Second, the costs of caring for individual patients are mostly pieced together retrospectively after the care has already taken place. This is not helpful for a patient with a high deductible who is trying to shop for a good value. A third reason is that the costs of providing care are only loosely tied to what gets charged.
The connection between costs of providing care and the amount that gets charged is specified by a tediously long document known as the chargemaster (also known as a charge description master or “CDM”). Each provider organization has their own unique chargemaster, providing a comprehensive listing of tens of thousands of billable items along with the corresponding fee for each item. For hospital financial managers, the chargemaster is used to reconcile total costs with revenue.7 For payers, the chargemaster provides the basis and starting point for negotiating the amount they will actually pay or “reimburse” for individual care (usually less than half of what is charged).8,9
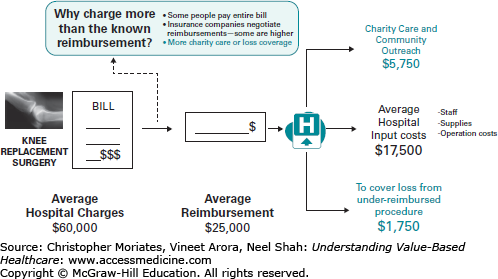
Although the chargemaster is theoretically related to both costs and payments, in practice it does not match up with either because providers highly inflate the listed prices. These sky-high prices are commonly justified as a way of balancing the relatively low fixed reimbursement rates of government payers with the higher negotiable rates paid by private payers (more on that in a moment) (Figure 3-4).8,10 Defenders of the chargemaster have also argued that the inflated prices are necessary to mitigate financial risk that providers bear since it can be hard to predict how costly an episode of care will be.11 Nonetheless the chargemaster system has come under sharp criticism for being opaque and arbitrary while exposing patients like Dr Burke-Galloway to exorbitant cost. As journalist Steven Brill detailed in his attention-grabbing April 2013 Time Magazine cover story, “prices vary from hospital to hospital and are often ten times the actual cost of an item.”12
Regardless of how it is justified, it is reasonable to wonder exactly how providers end up with the specific prices they list. Most providers start by estimating their costs of delivering care for a particular service and then apply a “mark-up” to come up with the amount charged. The mark-up is based on a combination of the provider organization’s internal financial pressures (such as a union- negotiated nurse staffing model) as well as external market pressures. Market pressures include the mix of payers (ie, how much reimbursement is coming from lower paying Medicare insurance plans verse higher paying private plans) as well as the mix of other provider organizations that are competing for the same patients. Often, the charges reflect specific market knowledge of what others are charging or paying. For example, hospitals can retrieve publically reported chargemasters from their competitors and use this information to set a ceiling on their charges so that they are not perceived as the most expensive outlier. Similarly, because Medicare typically pays much less than private payers, many hospitals use Medicare’s fee schedule as a floor for setting charges.
In 2005, the Medicare Payment Advisory Commission (MedPAC) commissioned a study by the Lewin Group that examined the charge practices of 57 delivery systems representing more than 238 hospitals across the nation.13 Most of these hospitals were affiliated, nonprofit, academic teaching institutions. Even in these settings, they found a high level of arbitrariness. Decisions about how and when to apply mark-ups varied widely based on a variety of factors, including economic inflation, specific costs of services, hospital missions, competitive forces, influence of specific payers, community perception, managed care contract terms, and administrative overhead costs. Since some of these factors could be in conflict, it is possible that charges would be kept low in one clinical arena (like childbirth) for the sake of community perception only to be inflated in another area (like neonatal intensive care) to allow cross-subsidization (Figure 3-5). The Lewin Group discovered that many hospitals did not have a strategic process for regularly reviewing their charges and even lost track of exactly how certain charges were historically determined. As a result, many of these hospitals struggled to explain or even rationalize the basis of their charges.
Given the arbitrariness of the chargemaster, most payers use the collective willingness to pay and overall size of their membership as leverage to negotiate steep discounts. The biggest payers of all are Medicare and Medicaid, often collectively referred to as an “800-pound gorilla” because of their power to set prices (this metaphor is rooted in the riddle, “where does an 800-pound gorilla sit?”—answer: “anywhere it wants to”). Medicare and Medicaid payment rates are adjusted annually but otherwise fixed by Congress at relatively low amounts. A 2005 study noted that on average, for every dollar of allocated cost, Medicare typically pays about 95 cents.14 Currently, the annual adjustments are subject to a cost-control method called the “sustainable growth rate” or SGR which every year threatens to severely cut reimbursements and sends lobbyists and lawmakers on Capital Hill into a frenzied scramble for a temporary quick fix.15 Still, even in cases when Medicare payments do not fully cover the costs of providing care, outside of the annual SGR fix, provider organizations do not have much leverage to push back.
Despite this rigidity in Medicare payments, the rates are based on the estimated costs of providing care using a process that aims to be equitable. Let’s use payments for inpatient care as an example. As we described in Chapter 2, the Center for Medicare and Medicaid Services (CMS) pays for inpatient care prospectively with a flat fee per episode of care, rather than paying fee-for-service and accounting for each individual billable item. CMS defines episodes of care according to 746 distinct “diagnosis-related groups” or DRGs. According to MedPAC, CMS sets base payment amounts “for the operating and capital costs that efficient facilities would be expected to incur in furnishing covered inpatient services.”16 This base rate is first weighted by DRG to reflect the costs of caring for more severe conditions, and then adjusted according to an algorithm that includes market conditions (such as the regional cost of labor), whether or not the hospital is a teaching facility, and a number of other factors (MedPAC provides a short primer with more details on how this algorithm works on their website).17
Occasionally, hospitals may incur costs for caring for a particularly complex patient that are much higher than the prospective amounts allocated for the DRG. In these cases, Medicare will provide “outlier payments” based on a similarly calculated, imprecise ratio of costs to charges or “RCC.”18 Of note, despite the lack of precision, many hospital accountants and health service researchers continue to use the RCC as a basis for estimating the costs of providing care. Over the last 20 years the average hospital RCC has nearly doubled, adding to the strong sentiment that hospital charges are highly inflated (Figure 3-6
Stay updated, free articles. Join our Telegram channel

Full access? Get Clinical Tree


