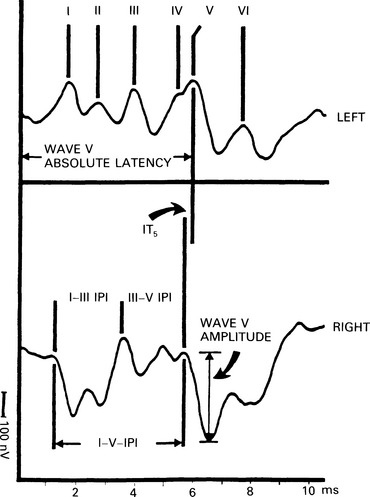
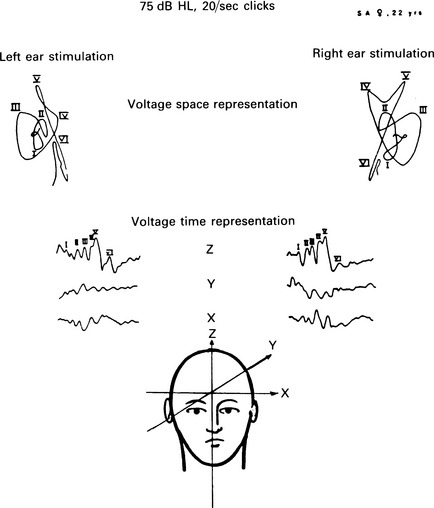
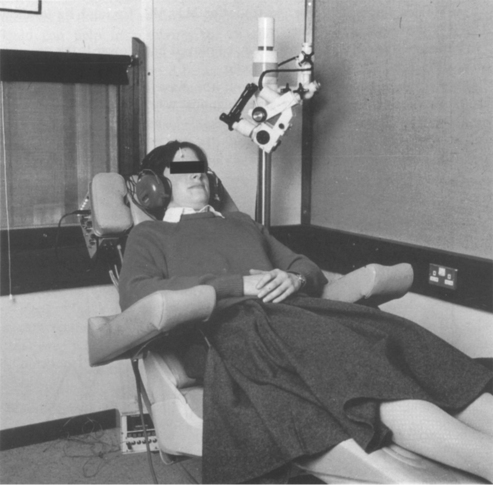
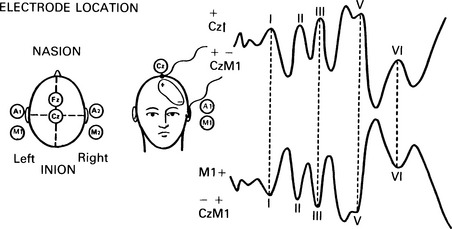
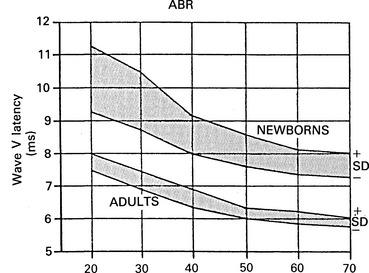
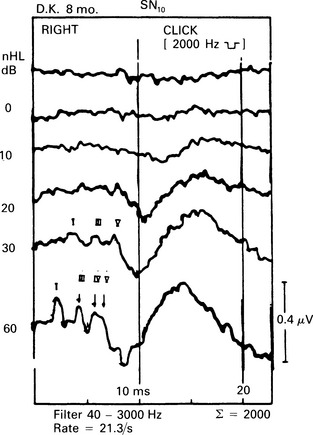
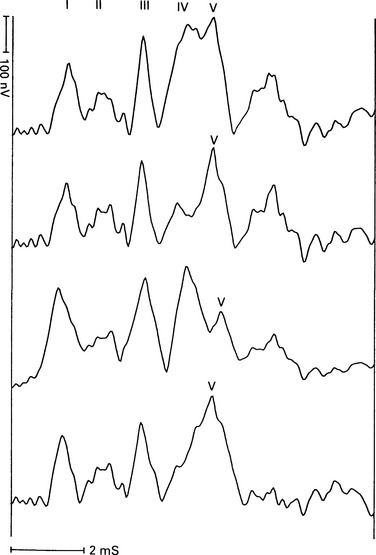
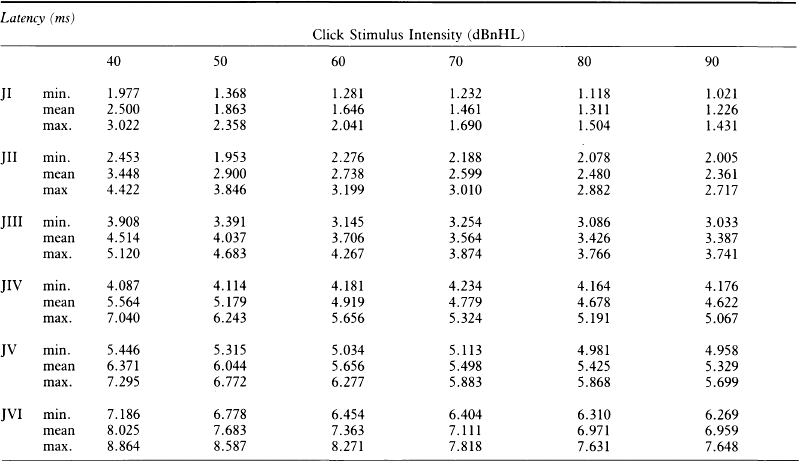
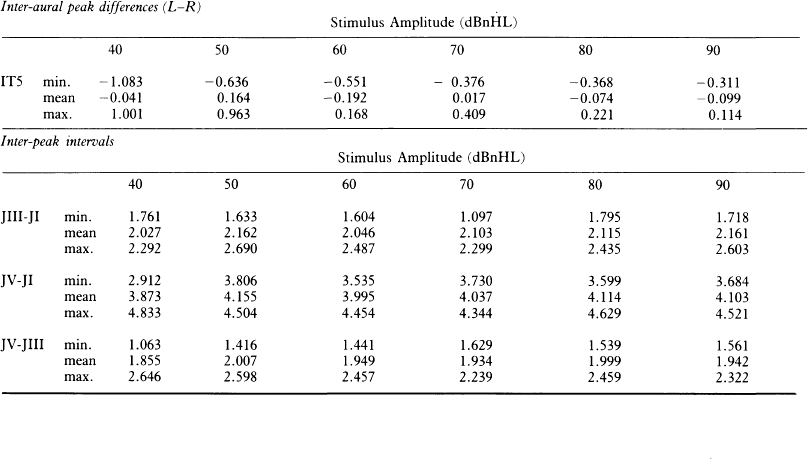
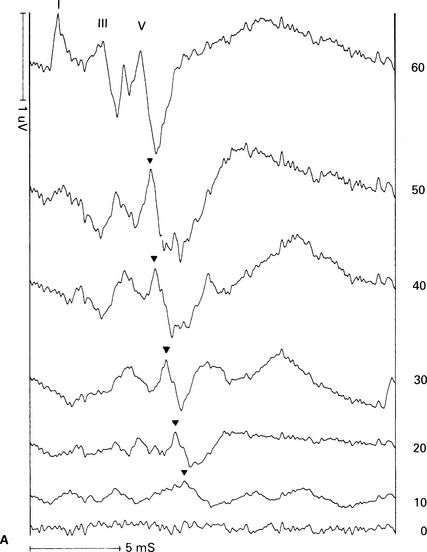
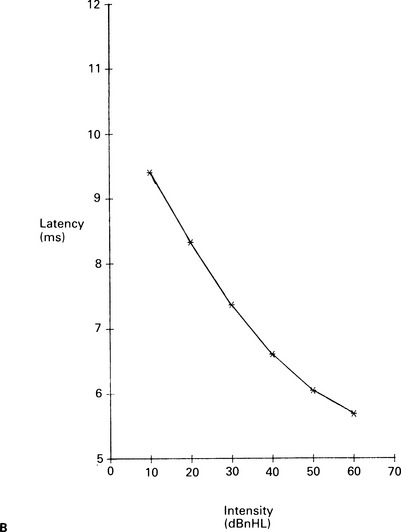
6 The auditory brainstem response (ABR) represents the far-field potentials recorded from the scalp, and comprises five or more waves generated from the auditory pathway up to the level of the inferior colliculus. The ABR occurs within 10 ms of a click or a brief tone-burst stimulus (see Fig. 6.1). It was originally described by Sohmer & Feinmesser (1967) and independently by Jewett & Williston (1971). As an audiological and a diagnostic test, ABR is firmly established in clinical practice. Its value is most evident in audiometric threshold estimation and in neuro-otological and neurological diagnosis. The extensive literature on the origins of ABR in laboratory animals and in man has been thoroughly reviewed by Buchwald (1983). The early interpretations of the likely origins of ABR have been gained from experimental lesions in animals (Buchwald & Huang 1975), and from human brain structures during operations and in pathological conditions (Moller & Jannetta 1985). Determining the origins of ABR in laboratory animals and then extrapolating the data to interpret human ABR is not easy. The cochlear nerve is much longer in man than in small mammals (Lang 1981), the volumes of the nuclei differ – for example, the superior olivary complex is smaller in primates than in other mammals (Moore & Moore 1971) – and, in general, the organization of the human auditory system differs in quality from that of the small mammal. However, the ABR morphology and responsiveness to various experimental manipulations in experimental animals are similar to those in man (Huang & Buchwald 1978, Stockard et al 1978, Don et al 1977). Apart from peak I, which in both small mammals and man is generated from the distal part of the peripheral nerve, the subsequent peaks are generated from different anatomical structures according to species. For example, wave IV in the cat appears to be analogous to wave V in man (Allen & Starr 1978, Huang 1980). In man, wave I originates in the distal part of the cochlear nerve, and radiates as a surface negative wave to periauricular sites (Buchwald 1983). The peak latencies of wave I recorded from a surface electrode and from a needle electrode on the promontory have similar values and reflect the gross neural activity of the cochlear nerve (Sohmer & Feinmesser 1967, Abramovich & Billings 1981). It was thought that wave II originates mainly in the cochlear nucleus (Buchwald 1983). However, intracranial recordings in man suggest that the peak of wave II originates mainly from the proximal part of the cochlear nerve, but with some contributions from the cochlear nucleus (Hashimoto et al 1981, Moller & Jannetta 1985). The origins of the subsequent waves generated in the brainstem are not clear. It is now accepted that the sequence of the waves does not correspond to simple rostral propagation of the excitation. Most likely, the various orientations of vectorial fields generated in several nuclei overlap, and the studies in man using intracranial recordings support this (Hashimoto et al 1981, Moller & Jannetta 1983, 1985). Peaks III, IV, V, and the subsequent VI and VII derive contributions from more than one anatomical location. Also, each nucleus may contribute to more than one wave in the ABR. Topographic analysis of the auditory-evoked potentials using multichannel recordings, combined with theoretic dipole modelling, suggests that wave III is mainly generated in the region ranging from the ipsilateral cochlear nuclei to the contralateral superior olivary complex, and that the IV–V complex seems to originate from the ipsilateral and contralateral lemniscal structures (Scherg & von Cramon 1985). One of the most constant morphologic features of the ABR is a vertex–positive peak V, which is followed by a prominent negative potential at the vertex with a latency of 7 ms. This has been named far-field potential 7 (FFP7) by Terkildsen et al (1974). A similar response, especially to low-frequency tone bursts, following wave V at 10 ms is the slow, negative SN10 response shown in Figure 6.2 (Davis & Hirsh 1979). The SN10 is consistent during muscle paralysis, confirming its neural origin (Fria et al 1984). Fig. 6.2 The SN10 response recorded using a band-pass filter of 40–3000 Hz. (After Davis H 1984 with permission.) Each region of the cochlea initiates an ABR from the ascending pathways. Thus, for a click stimulus which excites all of the cochlea, the response that is recorded from a surface electrode is the sum of the responses from all the regions in the cochlea. Each of these ‘elemental’ responses exhibits the ‘travelling wave’ delay before its initiation. Thus, the overall ABR is a compound response that represents the sum of the elemental responses. Because of the delays involved, some peaks of the elemental responses are cancelled and some are superimposed. Techniques such as the ‘derived-response’ method can extract frequency-specific responses from the compound ABR (see p. 37). Williston et al (1981) and Pratt et al (1984), using three orthogonal electrode pairs, have recorded ABR waveforms and produced three-dimensional representations in voltage-time and voltage-space. When this was done, certain segments of the plot lay in a single plane (Fig. 6.3). Furthermore, the orientation of the plane can be altered by disorders of the auditory system. Current research is refining the interpretation of the data and investigating the effects of various pathologies. The testing environment should exclude extraneous sounds and, in order to minimize muscle activity, provide an environment in which the patient can relax comfortably. The patient is tested in a recumbent position on a couch, as shown in Figure 6.4. A small dose of a muscle relaxant such as diazepam can reduce excessive muscular activity and improve ABR recording in an anxious patient. There is no general agreement about the waveform polarity, and the results should be given in an unambiguous way. For example, for a mastoid–vertex electrode pair, the ABR peaks (I–V) may be plotted as positive events (vertex-positivity plotted upwards) or as negative events (mastoid-positivity plotted upwards). An example is shown in Figure 6.5. At present, there is no international standard on stimulation parameters and acquisition of the ABR. However, each laboratory should acquire normative data for specific stimuli, using as guidelines the technical and procedural recommendations of the Electric-Response Audiometry Study Group on ABR measurement (Thornton 1983). Factors such as age and hearing loss, as well as different stimulus parameters and recording characteristics, can affect the ABR, and these factors are reflected in the inter-laboratory differences in normal data (Thornton 1987). There is considerable variation of the waveform in normal subjects, and, therefore, waveform variation is not a very reliable single feature for clinical evaluation, although some lesions have distinctive response changes. Normally, at high-stimulus intensities, waves I, III, and V can be recognized without difficulty. Wave V is the most prominent wave. Usually, waves IV and V are merged to give a IV/V complex. The peak of wave V is usually more prominent than IV in the complex; however, sometimes the reverse occurs. Waves IV and V may have a clear bifurcation, although sometimes they are completely fused into a broad wave, creating some difficulty in measuring their latencies. At high intensities, a complete bifurcation of wave I, and sometimes wave III too, can also occur. Examples of normative ABR variations are shown in Figure 6.6. Fig. 6.6 Examples of common recordings of the IV/V complex. In the top trace, IV/V are split, with similar absolute amplitudes. In the trace below, wave IV appears on the rising portion of wave V, in contrast to the next trace in which V appears on the descending portion of wave IV. The lowest trace shows IV as a small inflection on a rising edge of wave V. At moderate intensity levels, ABR waves are generally reliable and stable. As a guideline, wave I occurs at about 1.6 ms, and subsequent waves occur approximately at 1-ms intervals. Typical normative ABR latency data are shown in Table 6.1. When the peak of the wave is not defined, the measurement is taken at the beginning of the down slope. The measurement of absolute latency is especially relevant for wave V, which is the most prominent and stable under various conditions, and is, therefore, an important diagnostic parameter. Table 6.1 Latencies of ABR. Clinical norms. All limits are 95% confidence limits based on data from 17 normal ears. Alternating clicks used. Recording bandwidth 100 Hz–3 kHz. Inter-peak intervals (IPI) reflect neural transmission and can be affected by lesions of the peripheral nerve and by lesions extrinsic or intrinsic to the brainstem. Clinically, the IPI are measured between the main waves I, III, and V (see Table 6.1). The I–III and III–V IPI are about 2 ms each, and the I–V IPI is approximately 4 ms, and is relatively insensitive to stimulus intensity changes from moderate to high levels (Abramovich & Billings 1981). The interaural peak difference of wave V (IT 5) is another useful parameter and normally should not exceed 0.3 ms (Fig. 6.1). The peak-to-peak amplitude of the wave components is a less stable parameter than is the peak latency, and it is, therefore, prone to considerable variation in absolute values (see Table 6.1). However, particularly for CNS lesions and for stimulation at fixed levels relative to the individual patient’s threshold, the amplitude can give useful diagnostic information (Thornton & Hawkes 1976). Studies of waveform amplitude variations were carried out by Starr & Achor 1975, Rowe 1978, and Chiappa et al 1979. They found the V/I amplitude ratio to be a valuable clinical parameter. In normal subjects, the V/I ratio is more than 1 and can approximate 3 (Stockard et al 1978). An example of a diagnostic baseline which uses both amplitude and latency values is shown in Figure 7.17. The decreasing intensity of a click stimulus from high levels to threshold alters the waveform, latency, and amplitude of the ABR. Wave V is easily recognizable in normal subjects and is identifiable down to 20 dBnHL, whereas the earlier waves become difficult to identify below 50 dBnHL (Fig. 6.7). At 20-dBnHL click stimulus, the amplitude of wave V is about 0.3 μV, compared to 0.6 μV at 70 dBnHL (Picton et al 1981). Threshold estimation is based on detection of wave V, which, for normal subjects can be visualized in 75% of cases at 10–20 dBnHL and can be seen in all cases at higher sound levels. Wave III is identifiable in about 60% of subjects at 30 dBnHL, and wave I in 75% at 50 dBnHL (Worthington & Peters 1980). Fig. 6.7 (A) ABR recorded at different intensities from an adult patient. (B) The corresponding amplitude and latency I/O function. A decrease in intensity will prolong all wave latencies. The latency of wave V is about 5.9 ms at 70 dBnHL and increases to about 7.7 ms at 20 dBnHL, thus giving an average shift in wave V slope of 30–40 μs per dBnHL (Picton et al 1981, Schwartz & Berry 1985). However, the latency–intensity function slope is non-linear (Fig. 6.8).
The auditory brainstem response (ABR)
INTRODUCTION
GENERATORS OF THE ABR
METHODS
Electrode placement
Technical aspects of stimulation and ABR recording
NORMATIVE CHARACTERISTIC OF ABR
Waveform of ABR
ABR latencies
ABR amplitude
Amplitude–intensity and latency–intensity functions
![]()
Stay updated, free articles. Join our Telegram channel

Full access? Get Clinical Tree


The auditory brainstem response (ABR)

