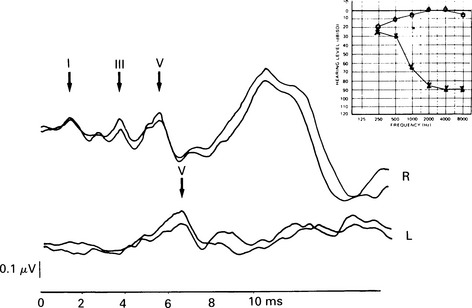
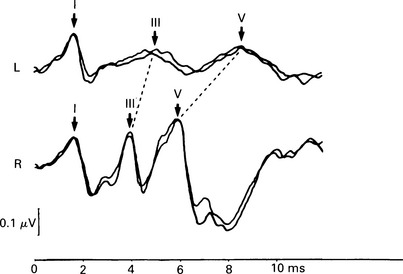
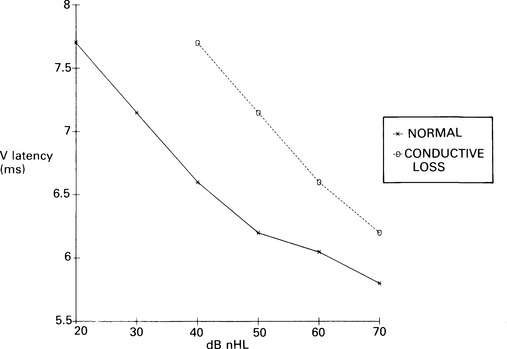
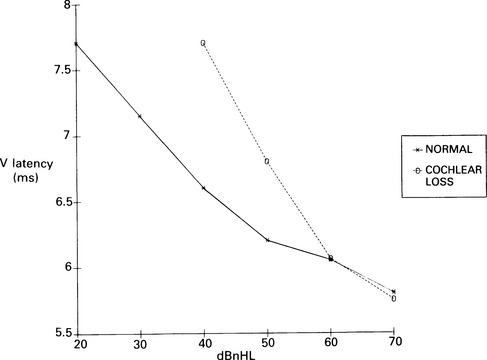
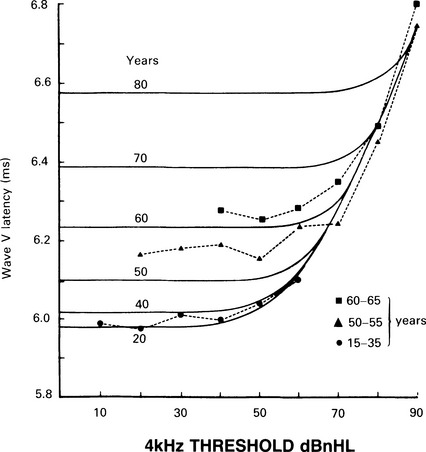
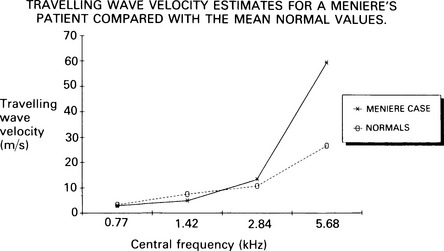
7 Evaluation of the type of hearing disorder is of importance, especially in a child. When pure-tone audiometry is not possible, tympanometry is of great assistance. However, it should be pointed out that tympanometry has its limitations when the patient is under 7 months of age (Paradise 1982). Conductive hearing loss can be estimated by ABR, and it is important to recognize this disorder because it may lead to incorrect interpretation of ABR results and may mimic ABR changes due to cochlear and retrocochlear pathologies. It is well recognized that conductive hearing loss prolongs the latencies of all ABR waves when air-conduction stimuli are used. This is due to stimulus energy-level reduction (McGee & Clemis 1982), and is equivalent to normative wave-V latency shifts with stimulus-intensity change. Prolongation of the latency of wave V by 0.3–0.4 ms for every 10 dB of conductive hearing loss has been estimated by several investigators, and this is similar to the prolongation of latency due to the decrease of stimulus intensity in normal subjects (Fria & Sabo 1980, Finitzo-Hieber & Friel-Patti 1985). Correspondingly, the inter-peak latency in IPI I–V is normal in conductive hearing loss. However, in moderate to severe hearing loss, wave I may not be identifiable, and prolongation of the latency of wave V may lead to an incorrect interpretation of the type of hearing dysfunction, if only the ABR results are considered. Clearly, there are standard methods of determining conductive losses which have to be used in conjunction with ABR. Estimation of the latency–intensity function may help in resolving the problem of type of hearing loss. The latency–intensity function is displaced proportionally to the amount of conductive hearing loss and is parallel to the normal slope, as shown in Figure 7.1. Fig. 7.1 Latency–intensity function of wave V in conductive hearing loss. The function is parallel to the normal slope. Although this function may be consistent with conductive hearing loss, it is not diagnostic. Various pathologies, specifically CNS lesions, can also produce the result of Figure 7.1, but may be distinguished from conductive losses by the value of the I–V interval. Conductive hearing loss can be estimated by plotting the wave V latency–intensity function of the patient and comparing it with normal values. If the stimulus intensity is plotted on the horizontal axis, the amount of conductive loss is equal to the amount that the patient’s curve is shifted to the right of the normal values (see Fig. 7.1). For 70% of the subjects studied by Fria & Sabo (1980), the estimated hearing loss was within 5 dB of the subjective audiogram at frequencies 500, 1000, and 2000 Hz, and within 10 dB at 4000 Hz. Some investigators do not use the latency–intensity function for conductive hearing estimation, because, for a given latency value for wave V, the hearing loss can vary as much as 20 dB (Eggermont 1982). However, estimates taken from several points on an I/O function can improve the accuracy. The responses obtained using a bone conductor are longer by 0.4 ms than air-conducted clicks at the same intensity. This is because bone-conductors limit the spectral energy of the click to lower frequencies. Theoretically, therefore, with bone conductors, the response comes from the lower-frequency region in the cochlea (Finitzo-Hieber & Friel-Patti 1985). In a high frequency hearing loss of more than 50 dBnHL, wave I cannot be identified with confidence in most cases (Fig. 7.2). At some point, hearing loss of cochlear origin eliminates the ABR, and the earlier waves disappear first. If the audiogram is worse then 75 dB at 1000 and 2000 Hz, with no hearing at 4000 Hz, an ABR response for click stimuli of 95 dBnHL may not be obtained. Low frequency hearing loss does not have a significant effect on ABR parameters elicited by click. The latency of wave V decreases with increasing stimulus intensity. However, the latency–intensity function may not be parallel to normal slope. Cochlear hearing loss which demonstrates recruitment shows rapid latency changes with small increments of click intensity. The function of latency–intensity curves will be much steeper, as is shown in Figure 7.3. Fig. 7.3 ABR waveforms and latency–intensity function of wave V in cochlear hearing loss. The function is steeper than normal, and the change in waveform morphology can be seen. In cases of predominantly high frequency, steep hearing loss, the latency–intensity function may have a shallow slope. This type of latency–intensity function can be explained by the fact that at high intensities the maximum contribution, normally coming from the 2000–4000 Hz region, is reduced in a case of high frequency hearing loss, and the initiation of the ABR shifts to a more apically responding region in the cochlea. Therefore, the latency increases by the time necessary for the travelling wave to reach the responding region. On the other hand, initiation of ABR response to low intensity clicks shifts to the 1000–2000 Hz region, which is not affected in steep high frequency loss. An abnormally shallow latency–intensity function may suggest a high frequency hearing loss. Using 90 dBnHL clicks, Selters & Brackmann (1979) found that the latency of wave V is constant in hearing losses less than 50 dBnHL, but increases in greater losses. They empirically fitted a linear curve with 0.15 ms/10 dB of hearing loss, starting from 50 dB. Rosenhamer (1981) found latency increases of 0.1 ms/10 dB, starting at 30–40 dB of hearing loss. Hearing loss and age are interrelated, and they both have a complex effect on latency of wave V. A bivariate model of the effect of cochlear hearing loss and age on the latency of wave V has been suggested by Hyde (1985). With 85 dBnHL clicks, the latency of wave V increases strongly and non-linearly with 4000 Hz pure-tone loss, and it also increases non-linearly with age, as shown in Figures 7.4 and 6.10. The non-linear latency behaviour is consistent with the notion that both ageing and cochlear hearing loss deplete a partially common cochlear population of responding units. Our data indicate that in patients with audiometric thresholds at 4000 Hz better than 50 dBnHL, the major variable accounting for inter-subject latency variation is the age of the subject. For losses over 50 dB, the major contributing variable is hearing loss. For losses greater than 55 dB, there is a latency increase of 0.15 ms for every subsequent 10 dB of hearing loss. One can see at the bottom of Figure 7.4 that, for an age of about 20 years, the latency stays constant for small hearing losses and then goes up sharply as the loss exceeds 50 dBnHL. In elderly subjects, the latency of wave V starts off at higher values compared with young subjects, and does not begin to increase further until much larger hearing losses are encountered. If the age variable is not controlled, then the observed effect of hearing loss may vary in an unpredictable manner. Therefore, both hearing loss and age must be taken into account when interpreting ABR. Fig. 7.4 Data and fitted model of mean wave-V latency for effects of cochlear hearing loss (Abramovich & Hyde, unpublished). The effect of audiometric contour has been studied by several authors. Jerger & Mauldin (1978) found that wave V latency correlates with the high frequency audiometric slope better than with the average audiometric hearing loss. With click stimuli, there is no evidence that low frequency hearing loss influences the latency of wave V. Rosenhamer (1981), Hyde (1985), and Abramovich (1987) have investigated a range of audiometric frequencies and audiometric slopes, using the partial correlation analysis method. It was found that the best correlation was with the hearing loss at 4000 Hz. The latency of wave V was not markedly affected by the slope of the audiogram. The IPI I–V is a particularly stable parameter among the subjects. In cochlear hearing loss, IPI I–V is normal. The inter-peak interval IPI I–V is less sensitive to hearing loss than is wave V itself, and can contribute to a more accurate diagnosis. Eggermont et al (1980) studied the effect of unilateral pure-tone cochlear hearing loss, mainly in patients with Ménière’s disease as compared with IPI I–V on the normal ear. The dominantly occurring differences in the I–V delays between both ears were 0 and 0.1 ms, with normal ears having a shorter latency. The problem is that in many patients with cochlear hearing loss, especially at high frequencies, wave I is not identifiable using surface electrodes (Hyde & Blair 1981, Abramovich & Billings 1981). However, it has been reported (Coats 1978) that in the presence of high frequency hearing loss, IPI I–V can be reduced. This can be explained by the fact that at high stimulus intensities, the usual generation of wave I from the basal region shifts to a more apical region on the basilar membrane, where the hair cells are intact. This will delay wave I, and the I–V interval will shorten. This has been described in Chapter 5. Schuknecht & Gulya (1983) have defined Ménière’s disease as an expression of idiopathic, symptomatic endolymphatic hydrops. It is often found on autopsy that Reissner’s membrane is distended to the walls of the scala vestibuli and that the saccular wall is distended to the footplate of the stapes (Schuknecht 1974). More recent work has stressed the effects of raised intracochlear pressure in this condition (Kanoh & Makimoto 1985, Tjernstrom & Casselbrant 1981). The ABR characteristics are similar to those in cochlear hearing loss. However, Parker & Thornton (1978) have shown how derived ABRs could be used to estimate travelling wave velocity (TWV). With this measurement, a novel application of ABR to the diagnosis of endolymphatic hydrops has been realized. The tentative hypothesis was that increased pressure in the scala media would lead to an increase in the stiffness of the basilar membrane, and, hence, the speed of the travelling wave along the basilar membrane would increase. The technique was applied to a ‘definite’ Ménière’s disease group, and nearly all of the patients showed an increased TWV at high frequencies (Thornton et al 1989). Figure 7.5 shows an example. Fig. 7.5 ABR estimates of basilar membrane travelling wave velocity (TWV) in normal subjects and in a Ménière’s disease patient. The technique is too long for routine clinical application, and so a shortened form was developed for clinical use. This involves recording ABRs in response to click stimuli mixed with two different high-pass masking noises; it takes about 15 minutes. The latency difference of wave V, recorded in these two conditions, is compared with normal value. Too small a latency difference corresponds to an increased TWV and indicates raised endolymphatic hydrops. This clinical technique has been verified (Thornton et al 1990) by monitoring Ménière’s disease patients undergoing a glycerol dehydration procedure. All patients who showed an audiometric improvement also showed a TWV change relative to the normal value. Currently, this technique is undergoing clinical trials at Cambridge, Nottingham, and Southampton. Acoustic tumours comprise about 80% of cerebello-pontine angle tumours (Zulch 1957). Of 500 tumours diagnosed in Los Angeles, 95% were medium-sized or large (House 1979). However, there is a trend towards diagnosing smaller tumours, and in some studies 10% or more were detected when small (King & Morrison 1980, Nedzelski & Tator 1980). Large tumours may press and stretch the VIIIth nerve fibres as well as compress the brainstem. These factors may have an effect on neural transmission. It is thought that acoustic tumours cause a loss of neural synchronization in the affected population of nerve fibres, perhaps primarily in the high-frequency fibres on the exterior of the nerve, probably causing also a minor increase in conduction delay (Eggermont et al 1980). Eggermont et al (1980) found that the IPI I–V, recorded using narrow-band stimuli, was borderline normal, but that the overall I–V delay in stimulation with broad-band click was abnormal. They concluded that this was due to the desynchronizing effect of the tumour on the high-frequency fibres. This leads to elimination, depression, or delay of ABR waves generated at more rostral sites. When the distal part of the nerve is intact, it generates wave I, representing mainly neural activity of the high-frequency fibres. Such a tumour record is shown in Figure 7.6. A larger, extracanalicular, acoustic neuroma can obliterate all waves following wave I (Fig. 7.7).
The ABR in hearing disorders and auditory dysfunction
ABR IN CONDUCTIVE HEARING LOSS
Pathophysiology of the ABR
Conductive-loss effect on the latencies of ABR
Latency-intensity function
Estimation of conductive hearing loss
Bone-conduction ABR
ABR IN COCHLEAR HEARING LOSS
Waveform and amplitude of ABR
Latency-intensity function
Effect of cochlear loss on ABR latencies
ABR IN MÉNIÈRE’S DISEASE
Pathophysiology
Abnormalities of ABR
ABR IN VIIITH NERVE TUMOURS
Pathophysiology of ABR
![]()
Stay updated, free articles. Join our Telegram channel

Full access? Get Clinical Tree


The ABR in hearing disorders and auditory dysfunction

