Fig. 3.1
A Jabloński diagram depicting fluorophore absorption, radiative, and non-radiative relaxation pathways. Singlet ground, first, and second electronic states are represented by S 0, S 1, and S 2. Within each of these energy levels are vibrational energy levels. Transitions between states are shown as vertical lines, representing the instantaneous nature of light absorption, that is, the Franck–Condon principle. Energy losses through non-radiative conversions give rise to the Stokes’ shift, a difference in frequency between absorptive and radiative transitions
Among applications to macromolecules, there are unique chemistries that afford distinct opportunities for selective interrogation. Most proteins contain aromatic amino acids, whose pi-orbitals have lower energy (higher frequency) absorbance bands compared to a typical carbon–carbon bond. The indole side chain of tryptophan has the most intense absorbance with a maximum around 280 nm and a weaker transition around 292 nm. Tyrosine has a weaker absorbance, with the strongest transition occurring at 276 and weaker transitions as shoulders at 267 and 280 nm. Phenylalanine has the weakest absorbance which occurs at 250–270 nm. Modifications of any of these residues including oxidation and ionization can affect the absorbance spectra of these chromophores. The disulfide bonds have a very weak absorbance signal from 250 to 300 nm which can also contribute to the intensity of the protein absorbance in this part of the spectrum.
Absorption frequencies are relatively insensitive to molecular environment of these aromatic residues, which provides a useful means of quantifying protein concentrations (Beer’s Law or the Beer–Lambert equation) or in any number of applications for detecting proteins (chromatography):

where A is the measured absorbance, I 0 is the original intensity of the light and I is the intensity of the light transmitted through the sample, l is the length of the sample path length the light was shown through, c is the concentration of the chromophores, and ε is the absorbance of a one molar solution of the chromophores, often referred to as the extinction coefficient of a chromophore. Taking the derivative of the spectrum can allow the detection of changes in the wavelength of maximum absorbance due to changes in solvent, and this is occasionally used to follow changes in conformation or aggregation state.

(3.1)
As the subsequent sections will reveal, relaxation pathways can be greatly influenced by the molecular environment of the chromophores within the folded structure of the protein and of the protein itself. These different relaxation pathways have been exploited as sensitive tools to probe the secondary, tertiary, and quaternary structures of proteins.
3.2.2 Fluorescence
3.2.2.1 Intrinsic Protein Fluorescence
Fluorescence is arguably one of the most widely used experimental techniques employed in the study of macromolecules and macromolecular interactions, both in vitro and in vivo. Many thorough reviews representing the array of applications of this technique are available in the literature (Cantor and Schimmel 1980; Lakowicz 2006; Royer 2006). Over the last few decades, continued improvements in experimental techniques and in computational analyses have revolutionized the use of spectroscopic techniques in understanding mechanisms of protein folding and perturbations of protein structure (Bartlett and Radford 2009; Royer 1995; Royer and Scarlata 2008).
The phenomenon of fluorescence was first observed by Sir George G. Stokes in 1852 (Stokes 1852), noting that the fluorescence emission typically occurs at lower energy or longer wavelengths than the incident light. For Stokes, the source of UV excitation was the sun and a blue glass filter (from a stained glass window) which selectively transmitted light <400 nm. This incident light was absorbed by a glass of quinine; fluorescence was filtered through a glass of white wine, which selectively transmitted light >450 nm and subsequently detected by eye. Energy losses between excitation and emission are universal for fluorescent molecules in solution, giving rise to the Stokes’ shift (Fig. 3.1).
In proteins, tryptophan is the strongest intrinsic fluorophore, followed by tyrosine and then phenylalanine. Proteins tend to contain relatively fewer tryptophans than tyrosines and phenylalanines, and due to its strong excited-state dipole, tryptophan fluorescence tends to be more sensitive to general environmental factors. Both Trp and Tyr absorb light around 280 nm, and due to the overlap of their excitation and emission spectra, if the two amino acids are located close enough in the folded protein, this commonly results in energy transfer from Tyr to Trp. Thus, the Trp emission is the one most often observed in proteins.
Due it its aromatic character, tryptophans are often buried or partially buried in the hydrophobic core of protein interiors. Any disruption or destabilization of protein structure can lead to a change in solvent exposure and thus the fluorescent properties of tryptophan residues (Bartlett and Radford 2009; Royer 1995; Royer and Scarlata 2008). This is most clearly observed in systems with a single tryptophan (Epstein et al. 1971; Flanagan et al. 1992; Hynes and Fox 1991; Otto et al. 1994), but also in studies of proteins containing multiple tryptophan residues (LeTilly and Royer 1993; Mann et al. 1993; Royer 1993). While the emission spectrum maximum of a buried tryptophan generally exhibits a red shift (lower energy, higher frequency) upon protein unfolding, the peptide backbone and a number of the amino acid side chains can alter tryptophan fluorescence spectra, generally through excited-state quenching or electron transfer (Adams et al. 2002).
3.2.2.2 Fluorescence and Conformational Dynamics
All proteins are inherently flexible in solution, existing as a distribution of a population of low- and high-energy conformational states that interconvert on different time scales. There are a variety of advanced applications that utilize fluorescence as a probe of conformational dynamics which are described in detail elsewhere (Cantor and Schimmel 1980; Lakowicz 2006; Royer 1995, 2006; Bartlett and Radford 2009; Royer and Scarlata 2008; Kamerzell et al. 2011). Time-resolved fluorescence has been used to measure protein dynamics that occur in time scales ranging from sub-nanoseconds to seconds, via multiple techniques. Some are steady-state measurements, while others are kinetic. In terms of relevance to characterization of higher-ordered protein structure, and fluctuations in structure, their use varies with respect to the simplicity of the measurement and the type of information obtained. Applications include studies of local and global motions, flexibility, heterogeneity, and intermolecular interactions and generally employ a variety of techniques (Kamerzell et al. 2011; Ramsey et al. 2009).
Intrinsic fluorescence is commonly used in time-resolved investigations of protein folding and unfolding. Unfolding is induced by exposure to temperature, chemical denaturants, or other solution conditions. Returning the protein to the original conditions will initiate refolding. The sophistication of these experiments continues to improve, with advances in detection speeds and data analysis. Generally single wavelength intensities are monitored as a function of the folding or unfolding time course via stopped flow or temperature-jump techniques.
Anisotropy measurements provide information on the size and shape of proteins and have been applied extensively in studies of protein–protein interactions. Anisotropy, A, is based on the principle of photoselective excitation of fluorophores by plane-polarized light:


(3.2)
Fluorophores that are physically oriented such that their electronic dipole moment is aligned in the plane of incident light are selectively excited. After rotational or vibrational diffusion occurs, some fraction of molecules have their dipoles oriented out of the plane of incident light, giving a decrease in the signal detected parallel to incident light and an increase in the signal detected perpendicular. Steady-state anisotropy employs plane-polarized light, with a pair of polarizing filters before and after the sample; the result is a value of fluorescence anisotropy or polarization that is specific to a sample composition and temperature.
Time-resolved measurements of fluorescence or anisotropy use rapid laser-based excitation and rapid detection to follow the decay kinetics. Also called lifetime measurements, time-resolved experiments are useful in estimating molecular rotational correlation times and protein hydrodynamic radii and how these change in ways that are sensitive to formulations (Ramsey et al. 2009). The relationship between the anisotropy, A, and the lifetime and rotational correlation time is given by the Perrin equation (Perrin 1926):

where A 0 is the limiting anisotropy, τ is the fluorescence lifetime, and τ c is the rotational correlation time of the macromolecule. For globular (approximately spherical) proteins, the rotational correlation time is a function of the apparent molecular weight, M, of a protein by

where η is the viscosity,  is the specific volume of the protein, h is the relative hydration, T is temperature (K), and R is the universal gas constant. For a typical protein,
  ~ 0.73 mL/g and hydration levels are h ~ 0.23 g of H2O per gram of protein. This expression predicts that the correlation time of a hydrated protein is on average ~30 % larger than would be predicted for a fully anhydrous protein (spherical approximation).

(3.3)

(3.4)
 is the specific volume of the protein, h is the relative hydration, T is temperature (K), and R is the universal gas constant. For a typical protein,
  ~ 0.73 mL/g and hydration levels are h ~ 0.23 g of H2O per gram of protein. This expression predicts that the correlation time of a hydrated protein is on average ~30 % larger than would be predicted for a fully anhydrous protein (spherical approximation).
The apparent volume of a protein can be measured experimentally, solely from measurements of protein anisotropy as a function of varying viscosity; changes in viscosity are typically achieved by variable temperature combined with viscous cosolvents, like glycerol. The Perrin equation is substituted with terms from Eq. 3.4, giving


(3.5)
The use of Eq. 3.4 to measure the apparent volume of a protein is one of the earliest applications of fluorescence in a biochemical system (Weber 1952a, b). As discussed in subsequent sections, the apparent volume of a protein can vary significantly in response to changes in formulations, aggregation onset, and protein unfolding.
Another laser-based technique is fluorescence correlation spectroscopy, or FCS, which measures time-dependent fluctuations in fluorescent intensity arising from Brownian motions. This technique is now commonplace in studies of in vivo protein compartmentalization and changes in expression and can also be used to measure protein dynamics in simple in vitro systems (Foldes-Papp et al. 2002). Applications to in vitro systems involve observations of single molecules undergoing folding/unfolding transitions, generally occurring on the microsecond to second time scale.
Design of a correlation spectroscopy experiment to observe fluctuations in protein structure requires that a conformational change gives rise to a change in fluorescent dye intensity. The majority of FCS experiments involve molecules freely diffusing in and out of the small volume being monitored, with fluctuations providing insights into diffusion, either passive or active, within cellular environments.
3.2.2.3 Fluorescence Quenching
Quenching refers generically to any molecular process that decreases the intensity of fluorescence. These include molecular rearrangements, energy transfer, excited-state reactions, and quenching through collisions. Fluorescence quenching has been widely studied as a source of information on biological systems. During collisional quenching, the quenching agent must diffuse to the fluorophore during the lifetime of the excited state. Upon contact, there is energy transfer via interactions of the excited-state dipole and the dipole (or induced dipole) of the quencher, facilitating return of the fluorophore to the ground state without photon emission.
The requirement of intermolecular contact between the quencher and fluorophore has obvious applications to biochemical systems. Quenching measurements can be indicative of the relative accessibility of fluorophores to quenchers. For example, in systems with a few fluorophore groups, either buried in the protein interior of soluble proteins or in lipid environments of transmembrane proteins, quenching rates can be used to determine the permeability of proteins or membranes to the extrinsic quencher. Likewise, quenching rates and lifetimes of fluorophore and quencher groups can be useful in measurements of molecular diffusion. Details on collisional quenching theory and applications are prevalent in the literature (Cantor and Schimmel 1980; Lakowicz 2006).
3.2.2.4 Fluorescence Resonance Energy Transfer
Fluorescence resonance energy transfer (FRET) is a technique that utilizes interactions between fluorophores with overlapping energy states to determine distances between them (Lakowicz 2006). In this technique the two molecules of interest are labeled at specific sites with donor or acceptor fluorophores which have overlapping emission/excitation spectra. As the distance between the molecules decreases, the efficiency of energy transfer from the donor to the acceptor molecule increases. Based on the characteristics of the labels, the actual distance between them can be calculated (dos Remedios and Moens 1995). This technique can also be used to follow changes in the distance between parts of the same polypeptide with changes in solution condition, interactions with other proteins, etc.
Most applications of FRET utilize extrinsic fluorophores, ones that involve cofactors as in the process of photosynthesis or more commonly are covalently attached to a protein via chemical means. These have found widespread applications in labeling of cellular proteins used in studies of cellular trafficking or in vivo protein–protein interactions (Pollok and Heim 1999; Miyawaki 2011; Jares-Erijman and Jovin 2003) and in studies of single molecules (Ferreon et al. 2011; Kubelka et al. 2004). Within proteins there is intrinsic fluorescence energy transfer between the tyrosine, the donor amino acid, and tryptophan, the acceptor molecule. These effects are perhaps most observable in simplified, highly purified protein solutions such as protein therapeutics or in studies of protein folding kinetics, where limits of low signal intensity among Tyr and Trp FRET pairings are not so problematic. In general, however, endogenous fluorophores are not heavily used for FRET-based studies of proteins.
3.2.2.5 Extrinsic Fluorescence
Almost 60 years ago, Weber demonstrated that the quantum yield of 1-anilino-phthalene-8-sulfonic acid (1,8-ANS) increased significantly from a highly quenched state in water (0.004) when bound to bovine serum albumin (0.75) (Daniel and Weber 1966; Weber and Daniel 1966; Weber and Laurence 1954). The mechanism of this effect involves a relief from collisional quenching from H2O molecules due to direct binding to a hydrophobic drug binding site on albumin. More commonly, the nonspecific binding of ANS to hydrophobic surfaces of proteins has been used as a general indicator of partial or complete protein unfolding.
In contrast to intrinsic protein fluorescence, which arises from the naturally fluorescent amino acids present in a given protein, extrinsic fluorescent dyes offer additional possibilities in the characterization of proteins. These can be covalently attached to proteins (via amines as with lysine or the amino group of the N-terminus or via free thiol groups on cysteine) or may interact with a protein via noncovalent-binding interactions. While ANS and other extrinsic fluorescent dye probes are a useful general probe of a change in the conformation of a protein (Hawe et al. 2008, 2011), they provide only a qualitative, nonlocalized means of investigating structural perturbations. As described in Chap. 2, these properties have been exploited for high throughput assays, especially as screening assays, where qualitative ranking of different molecules or conditions is the desired outcome. When more quantitative assessment is needed, extrinsic fluorescence is generally complimented by other techniques.
Extrinsic dyes work via excited-state reactions. These are molecular processes which change the electronic or chemical structure of the excited state prior to relaxation via fluorescence. The best known example of an excited-state reaction is that of phenol deprotonation, which occurs much more readily from its excited state due to a shift of electrons from the phenolic hydroxyl onto the phenol ring, which acidifies the hydroxyl group. Collisional quenching and solvent relaxation are other well-characterized examples of excited-state reactions, and the ones most relevant to extrinsic dyes.
Solvent relaxation is one aspect of the local environment of a polar fluorophore that can significantly influence its emission spectrum. This is the origin of the Stokes’ shift. Spectral shifts result from the interaction of the excited-state fluorophore dipole with solvent dipoles, leading to another energy transfer pathway, depicted in Fig. 3.2. This pathway for energy transfer is due in large part to the kinetics of different phenomena and can result in large Stokes’ shifts of ANS and similar dyes. Absorption lifetimes are affectively instantaneous (10−15 s) with respect to atomic motions, the Franck–Condon principle. The excited-state lifetime of fluorophores are typical 10−9 to 10−8 s. Solvent motions are generally on the order of 10−10 s, which allows sufficient time for solvent dipoles to align with the fluorophore excited dipole and for non-radiative transfer to occur. Fluorescence still occurs, but at a lower, relaxed energy level for the excited state. With the loss of the fluorophore dipole upon fluorescence emission, the aligned solvent molecules are at a higher energy state, which relaxes to the original ground state through non-radiative processes. The end result is a fluorescence that is red shifted (lower energy) from the original absorption frequency.
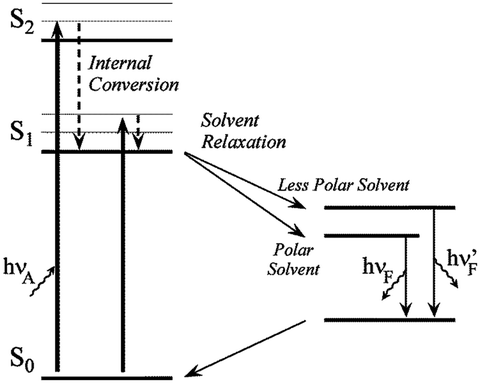

Fig. 3.2
A Jablonski diagram depicting fluorescence with solvent relaxation
Steady-state fluorescence spectroscopy is the most common experimental technique used to follow the interactions of extrinsic dyes with proteins. Protein binding affects the solvent–dye interactions, resulting in changes in emission wavelength or intensity. Other applications discussed above can be used in conjunction with the addition of extrinsic dye for the detection of protein structural changes as well, including time-resolved fluorescence (lifetime measurements), anisotropy (rotational motions), and fluorescence correlation spectroscopy (translation/diffusion).
3.2.3 Fourier Transform Infrared Spectroscopy
The use of Fourier transform infrared (FTIR) spectroscopy to measure the secondary structure of protein molecules has dramatically expanded in the last few decades, encouraged by the need to measure protein secondary structure in samples with various physical forms without sample manipulation. This method can be used to analyze molecules ranging from a few amino acids to large protein complexes, in different physical forms including solutions, lyophilized or crystallized solids, gas, and chemically modified or embedded in polymers (Perez et al. 2002; Carpenter et al. 1998; Haris and Chapman 1995; Chalmers 2002; Griebenow and Klibanov 1995). Additionally, modern FTIR spectrophotometers require only small volumes of solution for analysis, 10–100 μL, though at a relatively high concentration of 10 mg/mL and higher (Perez et al. 2002; Zuber et al. 1992). Compared to other spectroscopic techniques, FTIR can produce high-quality spectra relatively easily without the complications of background fluorescence, light scattering or problems related to the size of the protein. However, the presence of water absorption, buffer components, or other biological molecules produces problems of spectral overlap that can only be successfully subtracted and resolved by mathematical approaches (Susi et al. 1967; Venyaminov and Kalnin 1990a, b; Dong et al. 1990; Dousseau and Pezolet 1990). Thus, FTIR spectroscopy can be used to study various biological systems including proteins in pharmaceutical and non-pharmaceutical formulations (Carpenter et al. 1998; Haris and Chapman 1995; Griebenow and Klibanov 1995; Krimm and Bandekar 1986).
FTIR spectroscopy typically refers to the absorption of infrared light in the mid-IR region (400−4,000 cm−1). The Michelson interferometer (Fig. 3.3) is the central part of an FTIR spectrometer and is unique among other spectroscopic instrumentation. Infrared radiation from the source is collected and collimated before it strikes the beam splitter. The beam splitter ideally transmits one-half of the radiation and reflects the other half. Both transmitted and reflected beams strike mirrors, which reflect the two beams back to the beam splitter. Thus, one-half of the infrared radiation has first been reflected from the beam splitter to the moving mirror (Mirror 2) and then back to the beam splitter prior to being shone through the sample. The other half of the infrared radiation going to the sample first goes through the beam splitter and then is reflected from the fixed mirror (Mirror 1) back to the beam splitter. When these two optical paths are reunited, interference occurs at the beam splitter because of the difference in optical paths caused by the scanning of the moving mirror.
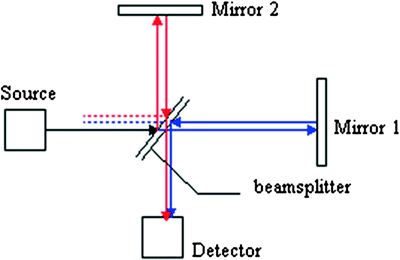

Fig. 3.3
Schematic of the principle of Michelson interferometer in FTIR spectrometer
The interference signal measured by the detector as a function of the optical path length difference is called the interferogram (Chalmers 2002; Griffiths and de Haseth 1986; Smith 1996). In order to extract and present information as an absorbance or transmittance spectrum, the interferogram has to be Fourier transformed, generating a single beam spectrum of IR absorption as a function of wavelength. Instrumental and atmospheric contributions are superimposed in the primary IR spectrum. To eliminate these contributions, a background spectrum obtained without a sample must be recorded and subtracted. Finally, the sample spectrum must be normalized, by dividing the sample spectrum signal, I, and by the background signal, I 0. The result is a %-transmittance spectrum (as T = I/I 0). For liquids, transmittance is related to absorbance A as


(3.6)
Physically, FTIR is a type of vibrational spectroscopy measuring the fluctuating covalent bonds within a protein; these give rise to specific wavelengths for different modes of vibration, the intensity relating to the number of bonded atoms in a common chemical environment. There are many modes of vibration a chemical bond can exhibit in a given chemical structure which result in IR absorbance, even for simple molecules such as CO2 (Fig. 3.4). Given the vast number of normal modes, the vibrational FTIR spectrum is complex with many vibrational bands overlapping. However, it is often possible to select a spectral region that provides specific structural information. Table 3.1 shows spectral regions of common chemical structure vibrations. For analysis the spectra are usually deconvoluted. Better visual resolution of the different bands can be achieved by taking the second derivative, and the data is often presented as the deconvoluted or second derivative of the raw spectrum.
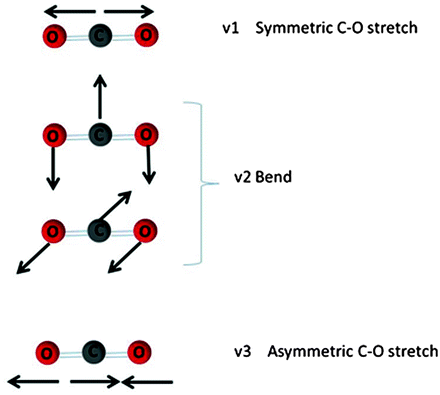
Table 3.1
Common vibrations with chemical structure assignments and spectral region
X–H vibrations | Bond | Wave numbers (cm−1) |
|---|---|---|
Hydroxyl | O–H | 3,610–3,640 |
Amines | N–H | 3,300–3,500 |
Aromatic rings | C–H | 3,000–3,100 |
Alkenes | C–H | 3,020–3,080 |
Alkanes | C–H | 2,850–2,960 |
Triple bonds | 2,500–1,900 | |
Double bonds | 1,900–1,500 | |
Heavy atoms | 1,500– |

Fig. 3.4
Vibrational modes of CO2 molecule
Protein secondary structural information is measured by FTIR via monitoring the vibrations exhibited within the peptide backbone. Each vibration mode absorbs IR electromagnetic radiation at specific frequencies depending on the peptide bond orientation and the protein secondary structure associated with a given residue. The vibrational modes of C=O stretching and N–H bending around the peptide bond, called amide I and amide II vibrational modes, are shown in Fig. 3.5. Up to nine different characteristic IR bands, the amide A, B, I, II, III, IV, V, VI, and VII have been reported for protein molecules measured by FTIR (Miyazawa et al. 1956; Bandekar 1992). Amide III and IV are very complex bands resulting from a mixture of several coordinate displacements (Fu et al. 1999; Schweitzer-Stenner et al. 2002). The out-of-plane motions are found in amide V, IV, and VII (Krimm and Bandekar 1986; Bandekar 1992). The amide A band around 3,500 cm−1 and amide B around 3,100 cm−1 originate from a Fermi resonance between the first overtone of amide II and the N–H stretching vibration (Haris et al. 1986, 1990). The use of these amide vibrations to extract protein secondary structure has been limited due to the complexity of these bands, the possible interference arising from side chains such as the ionized side chains of aspartic acid and arginine and the overlap of different vibrations giving rise to these bands (Dousseau and Pezolet 1990). Therefore, the majority of the work in developing FTIR has been focused on analyzing amide I vibrations to monitor protein secondary structure (D’Antonio et al. 2012).
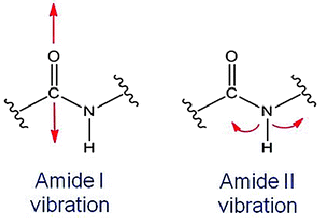

Fig. 3.5
Schematic representation of examples of peptide bond vibrations from amide I and amide II
Absorption associated with the amide I band leads to stretching vibrations of the C=O bond of the amide. This band is sensitive to protein conformation because of its involvement in hydrogen bonding in different elements of secondary structure. Studies with proteins of known structure have been used to systematically correlate features of the amide I band to secondary structure content (Byler and Susi 1986; Surewicz and Mantsch 1988). The second derivative amide I IR spectrum of lysozyme is shown in Fig. 3.6. Assignments of each peak under the amide I band to specific secondary structure elements have been a matter of interest for many researches and have been assigned using model peptides, X-ray crystallography, and mathematical modeling. Table 3.2 shows typical amide I second derivative band assignments to various secondary structures.
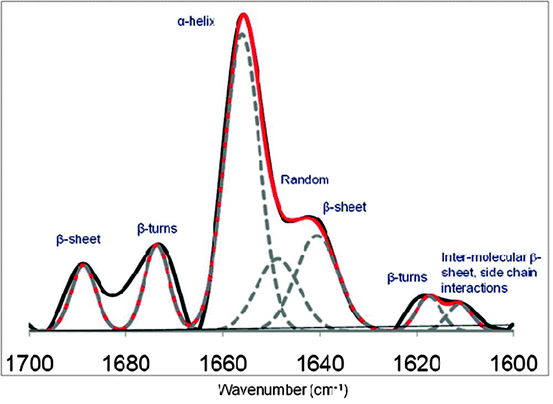

Fig. 3.6
Amide I FTIR spectrum second derivative of lysozyme in 50 mM phosphate buffer at pH 7 and 25°C. Red line is showing the derivative curve fit. Dotted line is showing the curve fit of individual peaks
Table 3.2
Common band assignments of protein secondary structure in amide I region
Secondary structure assignment | Spectral region (cm−1) |
|---|---|
Alpha-helix | 1,645−1,662 |
Beta sheet | 1,613−1,637, 1,695−1,682 |
Unordered | 1,645−1,637 |
Turns | 1,682−1,662 |
In order to quantify the percentage content of each secondary structure element in a protein, a curve fitting procedure can be applied to estimate quantitatively the area of each component representing a type of secondary structure (Dousseau and Pezolet 1990; Byler and Susi 1986; Susi and Byler 1986; Jackson and Mantsch 1995). The percentages of the different secondary structure elements obtained by curve fitting of amide I second derivative IR spectra for various proteins have been in good agreement with the secondary structure information obtained from their X-ray crystallographic structures. An example of the curve fitting of lysozyme amide I FTIR second derivative spectrum is also shown in Fig. 3.6.
FTIR spectroscopy is widely used in the development of protein therapeutics. It has been used to measure the secondary structure of the targeted protein as part of HOS characterization. Quantifying the secondary structure components such as α-helix, β-sheet, bends, and turns has been used to better understand the HOS product quality attributes of the protein under study and used to support process development, formulation development, stability studies, and comparability studies; some of these applications are discussed in the last half of this book. Qualification of this technique for use in comparability and filing documents is described in Chap. 5.
3.2.4 Circular Dichroism
Nearly all organic molecules and macromolecules are “optically active,” arising from a lack of chemical symmetry. For proteins the symmetry is provided by the three-dimensional structure of the folded protein. The CD spectrum arises from an electronically symmetrical chromophore in an asymmetric environment. The chromophores that absorb light in the UV range are the peptide backbone and the aromatic amino acids and disulfide bonds. The result is electromagnetic interactions between neighboring chromophores that can be detected spectroscopically. There are a number of ways in which optically active samples can alter properties of transmitted light, including linearly polarized light, circularly polarized light, circular birefringence, and circular dichroism (CD) spectroscopy. With CD spectroscopy, one measures the differential absorption of either left-hand or right-hand components of circularly polarized light, the output being a measure of ellipticity, θ, of a sample as a function of different wavelengths. Because this is a difference spectrum, the signal can be either positive or negative, with the blank at zero.
The contribution of different secondary structural elements to the total CD signal is additive, but also wavelength-dependent (Table 3.3). Thus, CD can be used to estimate the relative fraction of different secondary structural elements of a protein, α-helix, β-sheet, and random coil, directly from the CD spectrum without any other experimental input, as described extensively by Greenfield (Greenfield and Fasman 1969; Greenfield 1996, 2006a, b, c, 2007) as well as many others. However, the structural environment around the aromatic residues can result in signals in the far-UV CD spectrum that can complicate this analysis.
Table 3.3
Features of protein CD spectra
Far-UV CD | |
Range | (190–240 nm) |
Source of signal | Peptide bond in asymmetric environment; protein secondary structure |
α-Helix | Negative at 208 nm |
Negative at 222 nm | |
Positive at 192 nm | |
β-Sheet | Negative at 218 nm |
Positive at 196 nm | |
Random coil | Positive at 212 nm |
Negative at 195 nm | |
Near-UV CD | (260–320 nm): aromatics in asymmetric environment of folded protein; 3° structure |
Range (260–320 nm) | (260–320 nm) |
Source of signal | Aromatics in asymmetric environment; protein tertiary structure |
In the near-UV CD region the combination of aromatic and disulfide environments present in the protein structure results in a complex spectrum which is like a finger print for that particular protein. Each of the aromatic amino acids has a characteristic wavelength profile that corresponds to their absorbance spectra. Trp shows a peak close to 290 nm with fine structure between 285 and 305 nm; Tyr has a peak between 270 and 285 nm, with a shoulder at longer wavelengths often obscured by the Trp band; Phe shows bands with fine structure between 250 and 265 nm. Disulfide bonds also absorb in the near-UV region (weak broad absorption bands from 250 to 280 nm), the changes in the dihedral angle of the disulfide bond will result in a change in the signal in this region of the spectrum. The actual shape and magnitude of the near-UV CD spectrum of a protein will depend on the protein primary sequence, the number of each type of aromatic amino acids present, their mobility, and the nature of their environment (H-bonding, polar groups, and polarizability). While specific residue assignments cannot be made, changes in the protein fold result in changes in the environment of the aromatic amino acids and disulfide bonds and thus in the near-UV CD spectrum. As with fluorescence, the complexity of the aromatic CD spectrum increases with increasing numbers of aromatic groups.
CD spectroscopy has been used extensively to characterize protein folding and unfolding, both as a function of denaturants and temperature. It is a truly general technique that is not limited to constraints of molecular size or chemical composition and is a “label-free” approach that does not require secondary conjugation or chemical modification to obtain data on protein structural composition. Moreover, modern improvements in CD instrumentation and data fitting have made it straightforward to collect full spectra as a function of temperature, providing a means to quantitate the presence of subtle fluctuations in protein structure that occurs at temperatures below the primary protein unfolding transition.
3.2.5 Vibrational Optical Activity
Vibrational optical activity (VOA) is the field of spectroscopy associated with combining infrared absorption or Raman scattering with the optical activity, manifested as either optical rotation or CD. These include infrared vibrational circular dichroism (VCD) and vibrational Raman optical activity (ROA). VCD is an extension of electronic circular dichroism (ECD) described above, using an infrared spectrometer (FTIR) to measure the difference in the IR intensity for left minus right circularly polarized radiation, while ROA measures the difference in intensity of right minus left circularly polarized Raman scattered radiation in several different instrument configurations (Nafie 2011). VOA measurements are complementary to typical spectroscopic methods such as CD and FTIR spectroscopy, but with additional sensitivity in monitoring subtle changes in tertiary structure (Nafie 2011; Nafie and Dukor 2007; Lakhani et al. 2009; Cao et al. 2008; Keiderling et al. 2006; Zhu et al. 2006; Barron 2006).
In a typical optical activity instrument, light emerging from a Michelson interferometer is polarization modulated using a photoelastic modulator (PEM), with light oscillating between left and right circularly polarized states at the PEM frequency (Fig. 3.7). The infrared light is modulated by the Michelson interferometer and then enters the VCD portion of the setup. By passing through a linear polarizer and a PEM, the Fourier-modulated IR beam is further modulated at the PEM frequency. To obtain a VCD spectrum, the doubly modulated signal is first demodulated at the PEM frequency by a lock-in amplifier, then Fourier transformed by a computerized system (Keiderling et al. 1999).
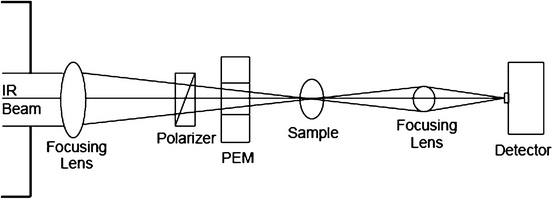

Fig. 3.7
Diagram of a typical FTIR-VCD optical path
A chiral molecule interacts differently with left and right circularly polarized light, in contrast to classical IR spectroscopy in which vibrational excitation occurs with nonpolarized IR radiation and thus does not vary due to differences in chirality. In certain applications of VCD, it is possible to infer relative absolute configuration between pairs of structurally related molecules. Such correlations are strengthened due to the large number of distinct vibrational bands in a typical mid-infrared and Raman scattering spectrum. This high level of sensitivity to minor structural change gives optical activity technologies, VCD and Raman optical activity, a high level of analytical power to elucidate both absolute molecular structure and conformation (Nafie and Dukor 2007).
Aromatic residues and polysaccharides are known to have overlap in the far-UV CD region, but show good separation in a VCD spectrum (Shi et al. 2006; Dukor and Keiderling 1991). The sensitivity of VCD to interactions of dipoles and the combination of sign, pattern, and band shapes with frequency allow VCD to provide local structural information and to distinguish between different secondary structures (Shi et al. 2006; Dukor and Keiderling 1991). Moreover, VCD, like the other types of vibrational spectroscopy, can be used across different types of samples including high concentration solutions (>50 mg/mL), solids, protein aggregates, and foreign organic particles. VCD is useful for monitoring formation of amyloid-like fibrils, with an order of magnitude increase in the VCD intensity upon fibril formation, reporting on the long-range supramolecular chirality of protein fibrils (Shi et al. 2006; Dukor and Keiderling 1991; Meyer et al. 2004; Baumruk and Keiderling 1993; Yoder et al. 1997). Moreover, VCD spectroscopy should be transparent to many commonly used formulation components that can interfere with CD and FTIR spectroscopy measurements. Glycine is commonly used in protein therapeutic drug product formulations, but the carboxyl group of free glycine in the formulation is particularly problematic for IR spectroscopic characterization of proteins from amide I overlap (Carpenter et al. 1998; Meyer et al. 2004). However, in the case of VCD, glycine does not interfere with the amide I region since its C=O stretch is lower in frequency.
VCD has been used to examine fibril formation in lysozyme and insulin. Under conditions of acidic pH and incubation at 60°C, the fibril formation produced a VCD spectral signature in the amide I centered at 1,627 cm−1 and amide II centered at 1,515 cm−1 in IR region for both proteins, which was not observed in the corresponding IR spectrum, shown in Fig. 3.8 (Ma et al. 2007; Kurouski et al. 2010). More recent studies have revealed spontaneous interconversion between opposing supramolecular chiral forms of fibril structure and correlations between the signs and magnitudes of the VCD spectra and the morphologies of fibrils as observed by SEM and AFM microscopies (Kurouski et al. 2012).
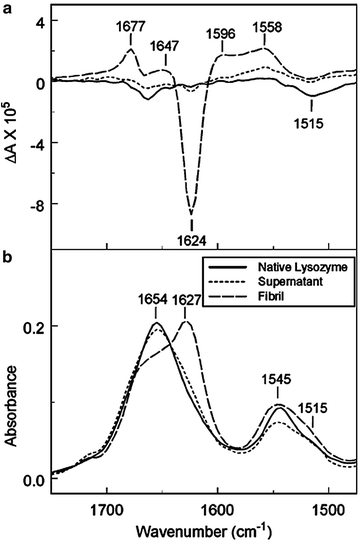

Fig. 3.8
Vibrational circular dichroism (a) and FTIR (b) spectra of lysozyme; native, centrifuged, and supernatant. Samples were treated at pH 2 and heated at 60°C for 2 days
Raman optical activity (ROA) scattering spectra can also provide very useful information about changes in protein secondary structure. Additional ROA studies have focused on the amide III region where particular sensitivity to partially or inherently unfolded protein structure can be studied by monitoring protein tertiary structure through signals from the aromatic amino acids. ROA is not impeded by background water scattering, and hence the entire spectral region from 2,000 to 100 cm−1 can be used as a diagnostic of overall secondary and tertiary protein structures (Zhu et al. 2006). Several studies have been published illustrating the ability of ROA to monitor aggregate formation in various protein therapeutics in various formulations of monoclonal antibodies. Two classes of human monoclonal antibodies, namely, IgG1 and IgG2, were studied using Raman and ROA at pH 7 and pH 3 (Li and Li 2009). The ROA spectra for both of these two antibodies exhibit large but very similar differences at these two pH values (Fig. 3.9). The data demonstrate the sensitivity of ROA to structural differences in HOS of these two antibodies, with structural differences arising from a net unstructuring or from changes in the stereo-conformational structure of the glycosidic tails (Li and Li 2009). These features are readily measured using ROA, but are not observed by traditional Raman spectroscopy (Li and Li 2009).
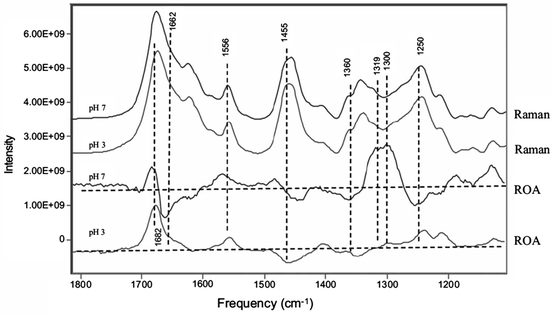

Fig. 3.9
ROA spectra of human IgG2 in solutions at pH 3 and 7
Both VCD and ROA are relatively new techniques which are used primarily to provide in-depth characterization of specific proteins, but are not yet widely employed.
3.2.6 Raman Spectroscopy
Like infrared (IR) spectroscopy, Raman spectroscopy is a method for probing structures and interactions of molecules by measuring the energies (or frequencies) of molecular vibrations. The main advantage of Raman spectroscopy for applications to proteins and their complexes is the fact that liquid water (both H2O and D2O) does not confound the Raman effect. Also like FTIR samples in different physical forms can be analyzed including solutions, suspensions, gels, precipitates, fibers, single crystals, and amorphous solids, with no complicated sample preparation necessary. Raman spectroscopy is nondestructive, with high specificity for certain structures and applicability to large supermolecular assemblies (Nafie 1996).
IR and Raman differ fundamentally in the mechanism of interaction between radiation and matter (Benevides et al. 2004). Raman scattering is inelastic light scattering which occurs at wavelengths that are shifted from the incident light by the energies of the molecular vibrations. Typical applications include structure determination, multicomponent qualitative analysis, and quantitative analysis (Nafie 1996; Dong et al. 1998). The vibrational spectrum of a molecule is composed of bands representing active normal vibrations. The spectrum depends on the masses of the atoms in the molecule, the strength of their chemical bonds, and the atomic arrangement. Consequently, groups of atoms connected by certain types of bonds have certain characteristic vibrations in the Raman spectra. Table 3.4 shows a set of common chemical structures with their frequency regions in Raman spectra (Socrates 2004).
Table 3.4
Raman bands features in Raman effect spectra and their vibrational origin
Frequency range (cm−1) | Band assignment |
|---|---|
2,700–3,100 | C–H alkyl free vibration |
2,230 | C≡N bond stretch |
2,190–2,300 | C≡C bond stretch |
2,100–2,140 | C≡C bond stretch |
1,650–1,750 | C=O bond stretch |
1,600–1,675 | C=C bond stretch |
1,580–1,620 | C=C bond stretch |
990–1,010 | Aromatic ring breathing |
650–860 | C–Cl stretch |
A Raman system typically consists of four major components (Fig. 3.10a): an excitation source such as a laser, a sample illumination system, light collection optics, a wavelength selector which can be either a filter or spectrophotometer, and the detector which can be a photodiode array, a charge coupled device, or a photomultiplier tube. A sample is normally illuminated with a laser beam in the ultraviolet (UV) visible (Vis) or near infrared (NIR) range (Dong et al. 1998). Other state-of-the-art Raman spectrometer systems have been described for various biological applications such as UV resonance Raman [UVRR (Brennan et al. 1997; Hashimoto et al. 1993; Asher et al. 1993)], Raman optical activity [ROA (Nafie 1996; Grauw et al. 1997; Barron et al. 1996)], and confocal Raman microscopy (Goldstein et al. 1996). In all cases scattered light is collected with a lens and sent through an interference filter or spectrophotometer to obtain the Raman spectrum of the sample being analyzed. In the case of Raman microscopy, the microscope is used to visualize the sample and ensure that the spectrum is from a particular particle or region of the sample.
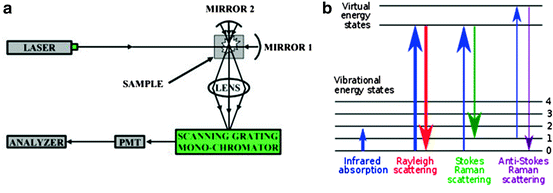

Fig. 3.10
Schematic of (a) basic Raman spectroscopy components and (b) energy level diagram showing the states involved in Raman signal. The line thickness is roughly proportional to the signal strength from the different transitions
Raman spectra are obtained when the light interacts with the molecule and distorts (polarizes) the cloud of electrons round the nuclei to form a short-lived metastable state from which photons are quickly reradiated (Fig. 3.10b). If only electron cloud distortion is involved in scattering, the photons will be scattered with very small frequency changes. This elastic scattering reaction is called Rayleigh scattering and is the dominant process following electron cloud distortion. However, if light scattering induces relaxation through nuclear motions, then energy will be transferred either from the incident photon to the molecule or from the molecule to the scattered photon. In these cases the process is inelastic and the energy of the scattered photon is different from that of the incident photon by one vibrational unit. It is an inherently weak process in that only one in every 106–108 photons scattered results in Raman scattering. However, it is very sensitive to subtle structural changes and with the development of high-power modern lasers and microscopes this technique is now much more readily available and in use.
Changes in the molecular geometry or conformation that characterize many molecular biological phenomena can produce relatively large changes in Raman band positions, which are usually referred to as frequency shifts. Such shifts in the Raman band frequencies are the basis for applications of the technique to analyze protein secondary structures, monitor tertiary structure changes, determine side-chain conformations, and detect intramolecular interactions. Because the molecular geometry and force field are also sensitive to interactions between molecules, Raman can be effectively applied to probe protein intermolecular interactions, including the formation on specific complexes and large assemblies.
A typical protein spectrum contains virtually all of the fundamental vibrational information on a protein or nucleic acid molecule, except for hydrogen stretch modes which generate bands in the 2,400–3,600 cm−1 Raman interval (Barron et al. 2000). Raman intensities associated with protein secondary structure are typically produced by the vibrations of the C=O and C–N chemical groups stretching in the peptide bonds. Stretching vibrations of C–C, C–N, and C=O bonds also produce intense Raman bands, especially if they involve the concerted symmetrical displacements of side-chain skeletons. The Raman bands associated with the bending and stretching modes of individual hydrogens in the protein substituent (e.g., C–H, N–H, and O–H) are generally weak, but their collective spectral intensities, which result from the large numbers of such groups in a protein, can be significant.
Generally, application of Raman spectroscopy to protein secondary structure analysis focuses on changes in the amide I spectral region (1,640–1,680 cm−1), which is primarily a carbonyl stretching mode, as well as the amide III (1,230–1,310 cm−1), which combines both in-plane N–H bending and C–N stretching motions. Table 3.5 lists the Raman frequencies assigned to amide I and amide III bands of representative polypeptides and proteins of differing secondary structures. Other conformation-sensitive bands have been identified in Raman and ultraviolet resonance Raman (UVRR) spectra of peptide model compounds and proteins. For example, amide II (1,500 and 1,600 cm−1), which involves substantial C–N stretching, is useful in studies of protein α-helical content (Wang et al. 1991). Polarized Raman spectra of α-helical proteins also generate a useful secondary structure marker near 1,340–1,345 cm−1, which can be exploited for α-helix orientation analyses (Tsuboi et al. 2000). Additional amide-related modes near 1,390 cm−1 have been proposed in UVRR spectra which have been assigned to the UVRR the overtone of amide V and appear to be sensitive to the local conformation of the peptide linkage (Wang et al. 1991).
Table 3.5
Amide I and amide III Raman bands of representative polypeptides and proteins with secondary structure assignments
Molecule | Frequency (cm−1) amide I | Frequency (cm−1) amide III | Secondary structure assignment |
|---|---|---|---|
α-Poly-l-alanine | 1,655 | 1,265–1,348 | α-Helix |
α-Poly-l-glutamate | 1,652 | 1,290 | α-Helix |
α-Poly-l-lysine | 1,645 | 1,295–1,311 | α-Helix |
β-Poly-l-alanine | 1,669 | 1,226–1,243 | β-Strand |
β-Poly-l-glutamate | 1,672 | 1,236 | β-Strand |
β-Poly-l-lysine | 1,670 | 1,240 | β-Strand |
Poly-l-lysine, pH 4 | 1,665 | 1,243–1,248 | Irregular |
Poly-l-glutamate, pH 11 | 1,656 | 1,249 | Irregular |
cI (Lamda) repressor (1–102) | 1,675 | 1,245 | Turns/irregular |
Bacteriophage P22 subunit | 1,655 | 1,235 | β-Strand/turns |
Certain Raman signatures are unique to protein tertiary structure, notably vibrational frequencies of side-chain conformations. For example, the Raman band between 2,500 and 2,600 cm−1 resulting from the cysteine sulfhydryl bond (S–H) stretching vibration is a unique probe of local SH structure and dynamics (Raso et al. 2001). In-plane vibrations of the rings of aromatic side chains such as tryptophan, tyrosine, and phenylalanine are also expected to produce Raman bands of high intensity. In addition, vibrations that involve the displacement of heavy atoms such as sulfur in C–S stretching modes of methionine and cysteine, S–S stretching of cysteine, S–H stretching of cysteine, and Zn–S stretching in zinc metalloproteins are expected to be relatively intense.
The indolyl moiety of tryptophan generates many prominent Raman bands, several of which have been correlated with the local environment and geometry of the tryptophan side chain in proteins (Miura et al. 1991; Siamwiza et al. 1975). For example, normal mode W3 generates an intense and sharp Raman band in the 1,540–1,560 cm−1 interval. The tryptophan residue also generates a Fermi doublet with components at 1,360 and 1,340 cm−1, with an intensity ratio (I1360/I1340) that increases with increasing hydrophobicity of the indolyl ring environment and thus serves as an indicator of local hydropathy. The normal mode W17 Raman band near 880 cm−1 is sensitive to indolyl N–H hydrogen-bond donation which exhibits a relatively high value when the indolyl moiety is located in a highly hydrophobic environment, such as the hydrophobic core of a globular protein. Normal mode W18, which is an indole ring-breathing vibration, generates bands near 755 cm−1 in Raman spectra of proteins with increased intensity when the hydrophobicity of the indolyl ring environment decreases.
Raman spectroscopy becomes an effective technology for various applications in protein biotechnology due to its capability to simultaneously measure the secondary and tertiary structure of a protein sample and to be applied to various physical forms. In the field of protein therapeutics, Raman spectroscopy has been used to measure protein HOSs in solution, in lyophilized form, or embedded in biocompatible polymer, throughout process and formulation development. Additionally, Raman spectroscopy can be very useful investigating incidents during stability studies and during manufacturing.
3.2.7 Other Structural Characterization Methods
X-ray Crystallography. High-resolution atomic structures of proteins have been integral to our understanding of protein function and fundamental principles of protein structure. As much as molecular biology or genomics, X-ray crystallography has been part of the exponential growth and success in biomedical research dating back to our earliest understanding of macromolecular structures. The advent of molecular replacement (non-crystallographic symmetry) has greatly simplified and accelerated crystallographic structure determination and allowed homology modeling to expand structural analysis and comparisons to proteins that have not been (or cannot be) crystallized (Rossmann 2001).
Crystallography has also had an impact in immunology, both in understanding the various antibody–protein interactions and in how to modulate and optimize these interactions from the theoretical to the practical (Sondermann and Oosthuizen 2002; Herr et al. 2003; Davies and Cohen 1996; Chothia et al. 1989; Al-Lazikani et al. 1997). The rapidity with which a structure can be refined once a crystal is available makes crystallography an important tool for understanding the HOS of proteins. The challenges with X-ray crystallography of proteins are the following: (1) many proteins do not crystallize readily, if at all, as is especially the case for the majority of integral-membrane proteins and proteins with flexible regions; (2) the crystallographic state is not always indicative of the functionally relevant state of a protein, in a crowded solution in a cellular environment; and (3) the flexible regions of a protein usually do not show up in the structure derived from X-ray crystallography, even if the protein crystallizes.
Stay updated, free articles. Join our Telegram channel

Full access? Get Clinical Tree


