- define a systematic review, and explain why it provides more reliable evidence than a traditional narrative review;
- succinctly describe the steps in conducting a systematic review;
- understand the concept of meta-analysis and other means of synthesising results;
- explain what is meant by heterogeneity;
- critically appraise the conduct of a systematic review.
What are systematic reviews and why do we need them?
Systematic reviews are studies of studies that offer a systematic approach to reviewing and summarising evidence. They follow a defined structure to identify, evaluate and summarise all available evidence addressing a particular research question. Systematic reviews should use and report clearly-defined methods, in order to avoid the biases associated with, and subjective nature of, traditional narrative reviews. Key characteristics of a systematic review include a set of objectives with pre-defined inclusion criteria, explicit and reproducible methodology, comprehensive searches that aim to identify all relevant studies, assessment of the quality of included studies, and a standardised presentation and synthesis of the characteristics and findings of the included studies.
Systematic reviews are an essential tool to allow individuals and policy makers to make evidence-based decisions and to inform the development of clinical guidelines. Systematic reviews fulfil the following key roles: (1) allow researchers to keep up to date with the constantly expanding number of primary studies; (2) critically appraise primary studies addressing the same research question, and investigate possible reasons for conflicting results among them; (3) provide more precise and reliable effect estimates than is possible from individual studies, which are often underpowered; and (4) identify gaps in the evidence base.
How do we conduct a systematic review?
It is essential to first produce a detailed protocol which clearly states the review question and the proposed methods and criteria for identifying and selecting relevant studies, extracting data, assessing study quality, and analysing results. To minimise bias and errors in the review process, the reference screening, inclusion assessment, data extraction and quality assessment should involve at least two independent reviewers. If it is not practical for all tasks to be conducted in duplicate, it can be acceptable for one reviewer to conduct each stage of the review while a second reviewer checks their decisions. The steps involved in a systematic review are similar to any other research undertaking (Figure 12.1).
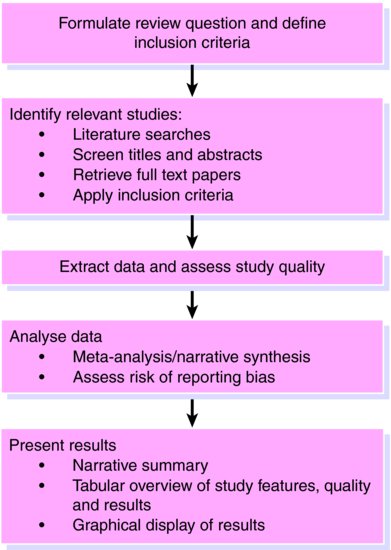
Define the review question and inclusion criteria
A detailed review question supported by clearly defined inclusion criteria is an essential component of any review. For a review of an intervention the inclusion criteria should be defined in terms of patients, intervention, comparator interventions, outcomes (PICO) and study design. Other types of review (for example, reviews of diagnostic test accuracy studies) will use different criteria.
Example: We will use a review by Lawlor and Hopker () on the effectiveness of exercise as an intervention for depression to illustrate the steps in a systematic review. This review aimed ‘to determine the effectiveness of exercise as an intervention in the management of depression’.
Inclusion criteria were defined as follows:
Patients: Adults (age > 18 years) with a diagnosis of depression (any measure and any severity)
Intervention: Exercise
Comparator: Established treatment of depression. Studies with an exercise control group were excluded.
Outcomes: Depression (any measure). Studies reporting only anxiety or other disorders were excluded.
Study design: Randomised controlled trials
Identify relevant studies
A comprehensive search should be undertaken to locate all relevant published and unpublished studies. Electronic databases such as MEDLINE and EMBASE form the main source of published studies. These bibliographic databases index articles published in a wide range of journals and can be searched online. Other available databases have specific focuses: the exact databases, and number of databases, that should be searched is dependent upon the review question. The Cochrane CENTRAL register of controlled trials, which includes over 640,000 records, is the best single source for identifying reports of controlled trials (both published and unpublished). A detailed search strategy, using synonyms for the type of patients and interventions of interest, and combined using logical AND and OR operators should be used to help identify relevant studies.
There is a trade-off between maximising the number of relevant studies identified by the searches whilst limiting the number of ineligible studies in order that the search retrieves a manageable number of references to screen. It is common to have to screen several thousands of references. Searches of bibliographic databases alone tend to miss relevant studies, especially unpublished studies, and so additional steps should be taken to ensure that all relevant studies are included in the review. For example, these could include searching relevant conference proceedings, grey literature databases, internet websites, hand-searching journals, contacting experts in the field, screening the bibliographies of review articles and included studies, and searches for citations to key papers in the field. Online trial registers are of increasing importance in helping identify studies that have not, or not yet, been published. Search results should be stored in a single place, ideally using bibliographic software (such as Reference Manager or EndNote).
Selecting studies for inclusion is a two-stage process. First, the search results, which generally include titles and abstracts, are screened to identify potentially relevant studies. The full text of these studies is then obtained (downloaded online, ordered from a library, or copy requested from the authors) and assessed for inclusion against the pre-specified criteria. Retrieved papers are then assessed for eligibility against pre-specified criteria.
Example: The Lawlor and Hopker () review conducted a comprehensive search including Medline, Embase, Sports Discus, PsycLIT, Cochrane CENTRAL, and the Cochrane Database of Systematic Reviews. Search terms included ‘exercise, physical activity, physical fitness, walking, jogging, running, cycling, swimming, depression, depressive disorder, and dysthymia.’ Additional steps to locate relevant studies included screening bibliographies, contacting experts in the field, and handsearching issues of relevant journals for studies published in 1999. No language or publication restrictions were applied. Three reviewers independently reviewed titles and available abstracts to retrieve potentially relevant studies; studies needed to be identified by only one person to be retrieved.
Extract relevant data
Data should be extracted using a standardised form designed specifically for the review, in order to ensure that data are extracted consistently across different studies. Data extraction forms should be piloted, and revised if necessary. Electronic data collection forms and web-based forms have a number of advantages, including the combination of data extraction and data entry in one step, more structured data extraction and increased speed, and the automatic detection of inconsistencies between data recorded by different observers.Example: For the Lawlor and Hopker () review two reviewers independently extracted data on participant details, intervention details, trial quality, outcome measures, baseline and post intervention results and main conclusions Discrepancies were resolved by referring to the original papers and through discussion.
Assess the quality of the included studies
Assessment of study quality is an important component of a systematic review. It is useful to distinguish between the risk of bias (internal validity) and the applicability (external validity, or generalisability) of the included studies to the review question. Bias occurs if the results of a study are distorted by flaws in its design or conduct (see Chapter 3), while applicability may be limited by differences between included patients’ demographic or clinical features, or in how the intervention was applied, compared to the patients or intervention that are specified in the review question. Biases can vary in magnitude: from small compared with the estimated intervention effect to substantial, so that an apparent finding may be entirely due to bias. The effect of a particular source of bias may vary in direction between trials: for example lack of blinding may lead to underestimation of the intervention effect in one study but overestimation in another study.
The approach that should be used to assess study quality within a review depends on the design of the included studies – a large number of different scales and checklists are available. Commonly used tools include the Cochrane Risk of Bias tool for RCTs and the QUADAS-2 tool for diagnostic accuracy studies. Authors often wish to use summary ‘quality scores’ based on adding points that are assigned based on a number of aspects of study design and conduct, to provide a single summary indicator of study quality. However, empirical evidence and theoretical considerations suggest that summary quality scores should not be used to assess the quality of trials in systematic reviews. Rather, the relevant methodological aspects should be identified in the study protocol, and assessed individually.
At a minimum, a narrative summary of the results of the quality assessment should be presented, ideally supported by a tabular or graphical display. Ideally, the results of the quality assessment should be incorporated into the review for example by stratifying analyses according to summary risk of bias or restricting inclusion in the review or primary analysis to studies judged to be at low risk of bias for all or specified criteria. Associations of individual items or summary assessments of risk of bias with intervention effect estimates can be examined using meta-regression analyses (a statistical method to estimate associations of study characteristics (‘moderator variables’) with intervention effect estimates), but these are often limited by low power. Studies with a rating of high or unclear risk of bias/concerns regarding applicability may be omitted, in sensitivity analyses.
Example: The Lawlor and Hopker () review assessed trial quality by noting whether allocation was concealed, whether there was blinding, and whether an intention to treat analysis was reported. They conducted meta-regression analyses (see ‘Heterogeneity between study results’ section, pp. 106–108, below) to investigate the influence of these quality items on summary estimates of treatment effect.
How do we synthesise findings across studies?
Where possible, results from individual studies should be presented in a standardised format, to allow comparison between them. If the endpoint is binary (for example, disease versus no disease, or dead versus alive) then risk ratios, odds ratios or risk differences may be calculated. Empirical evidence shows that, in systematic reviews of randomised controlled trials, results presented as risk ratios or odds ratios are more consistent than those expressed as risk differences.
If the outcome is continuous and measurements are made on the same scale (for example, blood pressure measured in mm Hg) then the intervention effect is quantified as the mean difference between the intervention and control groups. If different studies measured outcomes in different ways (for example, using different scales for measuring depression in primary care) it is necessary to standardise the measurements on a common scale to allow their inclusion in meta-analysis. This is usually done by calculating the standardised mean difference for each study (the mean difference divided by the pooled standard deviation of the measurements).
Example: In the Lawlor and Hopker () review, the primary outcome of interest, depression score, was a continuous measure assessed using different scales. Standardised mean differences were therefore calculated for each study.
Meta-analysis
A meta-analysis is a statistical analysis that aims to produce a single summary estimate by combining the estimates reported in the included studies. This is done by calculating a weighted average of the effect estimates from the individual studies (for example, estimates of the effect of the intervention from randomised clinical trials, or estimates of the magnitude of association from epidemiological studies). Ratio measures should be log-transformed before they are meta-analysed: they are then back-transformed for presentation of estimates and confidence intervals. For example, denoting the odds ratio in study i by ORi and the weight in study i by wi, the weighted average log odds ratio is

Setting all study weights equal to 1 would correspond to calculating an arithmetic mean of the effects in the different studies. However this would not be appropriate, because larger studies contribute more information than smaller studies, and this should be accounted for in the weighting scheme. Simply pooling the data from different studies and treating them as one large study is not appropriate. It would fail to preserve the randomisation in meta-analyses of clinical trials, and more generally would introduce confounding by patient characteristics that vary between studies.
The choice of weight depends on the choice of meta-analysis model. The fixed effect model assumes the true effect to be the same in each study, so that the differences between effect estimates in the different studies are exclusively due to random (sampling) variation. Random-effects meta-analysis models allow for variability between the true effects in the different studies. Such variability is known as heterogeneity, and is discussed in more detail below.
In fixed-effect meta-analyses, the weights are based on the inverse variance of the effect in each study:

where the variance vi is the square of the standard error of the effect estimate in study i. Because large studies estimate the effect precisely (so that the standard error and variance of the effect estimate are small), this approach gives more weight to the studies that provide most information. Other methods for fixed-effect meta-analysis, such as the Mantel-Haenszel method or the Peto method are based on different formulae but give similar results in most circumstances.
In a random-effects meta-analysis, the weights are modified to account for the variability in true effects between the studies. This modification makes the weights (a) smaller and (b) relatively more similar to each other. Thus, random-effects meta-analyses give relatively more weight to smaller studies. The most commonly used method for random-effects meta-analysis was proposed by DerSimonian and Laird. The summary effect estimate from a random-effects meta-analysis corresponds to the mean effect, about which the effects in different studies are assumed to vary. It should thus be interpreted differently from the results from a fixed-effect meta-analysis.
Example: The Lawlor and Hopker review used a fixed effect inverse variance weighted meta-analysis when heterogeneity could be ruled out, otherwise a DerSimonian and Laird random effects model was used.
Forest plots
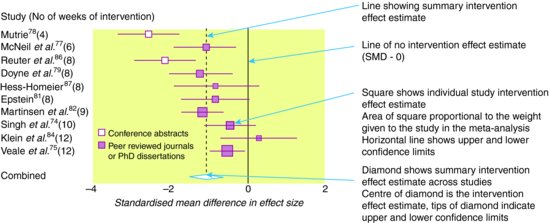
The results of a systematic review and meta-analysis should be displayed in a forest plot. Such plots display a square centred on the effect estimate from each individual study and a horizontal line showing the corresponding 95% confidence intervals. The area of the square is proportional to its weight in the meta-analysis, so that studies that contribute more weight are represented by larger squares. A solid vertical line is usually drawn to represent no effect (risk/odds ratio of 1 or mean difference of 0). The result of the meta-analysis is displayed by a diamond at the bottom of the graph: the centre of the diamond corresponds to the summary effect estimate, while its width corresponds to the corresponding 95% confidence interval. A dashed vertical line corresponding to the summary effect estimate is included to allow visual assessment of the variability of the individual study effect estimates around the summary estimate. Even if a meta-analysis is not conducted, it is often still helpful to include a forest plot without a summary estimate, in which case the symbols used to display the individual study effect estimates will all be the same size.
Example: Figure 12.2 shows a forest plot, based on results from the Lawler and Hopker () review, of the effect of exercise compared to no treatment on change in depressive symptoms, measured using standardised mean differences. The summary intervention effect estimate suggests that exercise is associated with an improvement in symptoms, compared to no treatment.
Figure 12.2 Forest plot showing standardised mean difference in size of effect of exercise compared with ‘no treatment’ for depression.
Stay updated, free articles. Join our Telegram channel

Full access? Get Clinical Tree


