(1)
Laboratoire d’Optique et Biosciences, INSERM U696-CNRS UMR7645, Ecole Polytechnique, Palaiseau, France
(2)
Institut für Physikalische und Theoretische Chemie, Julius-Maximilians-Universität Würzburg, Würzburg, Germany
(3)
Department of Biophysics, Medical School, University of Pécs, Pécs, Hungary
Abstract
This chapter describes an experimental layout for time and spectrally resolved fluorescence measurements with femtosecond time resolution based on Kerr gating. The combination of data recorded using different Kerr media allows a temporal dynamic range from ~100 fs to several nanoseconds. Simultaneous analysis of multiple datasets is described.
Key words
Kerr shutterTime-resolved fluorescenceUltrafast spectroscopyNK88Decay-associated spectrumGlobal analysis1 Introduction
Time-resolved fluorescence spectroscopy techniques monitoring the intrinsic decay and rise of emission from fluorophores in the condensed phase provide powerful tools that allow studying the structure and dynamics of molecular systems. These methods use the sensitivity of fluorescence properties to the environment of the fluorophore(s) to obtain important information about the investigated system. The diversity of the physical parameters that can be studied by time-resolved fluorescence is remarkable, and include inter- and intramolecular distances, polarity, viscosity, structural ordering, molecular mobility, and electric potential [1]. In biophysical studies, using natural or nonnatural fluorophores, time-resolved fluorescence can be used to study a wealth of phenomena including photo-induced redox reactions, Förster resonance energy transfer (FRET) between fluorophores, and rotational dynamics of macromolecules. For many applications measurements at single wavelengths are used, employing time-correlated single-photon counting (tens of picosecond resolution) or classical fluorescence upconversion (femtosecond resolution) techniques. However, the determination of the complete time- and spectrally resolved fluorescence matrix is often desired, especially for multi-fluorophore systems, fluorophore distributions, and at short timescale where relaxation processes play a significant role. There are several types of experimental methods that provide combined time and spectral resolution: streak camera [2–4], broadband upconversion [5–7], and Kerr gating [8–10], all of them having advantages and disadvantages. The streak camera has high sensitivity but limited time resolution. Broadband upconversion setups have very good time resolution but are quite demanding in alignment and operation. Kerr-gate setups have intrinsic high time resolution but require special attention in the case of large long-lived background components. In the present work, we focus on the latter technique based on the optical Kerr shutter and give a detailed description of the measurement procedure and data analysis.
A Kerr shutter for time-resolved fluorescence detection was first used by Duguay and Hansen in 1969 [11, 12] with picosecond laser technology. The optical Kerr effect is due to light-induced anisotropy changes in the medium. In Kerr-based gating setups, the fluorescence light pathway contains crossed polarizers and therefore does not reach the detector unless it is “gated.” To do so, the Kerr medium is placed between the two polarizers. A strong, linearly polarized gate pulse induces changes in the refractive index of the medium so that the medium effectively becomes birefringent. The polarization of the (fluorescence) light, which passes the Kerr medium while this induced birefringence persists, will be changed from linear to elliptical. Thus the shutter is “opened” and part of the fluorescence light can pass through the second polarizer and reach the detector.
2 Materials
The Kerr media CS2 and benzene were purchased from Sigma-Aldrich. Suprasil (1 mm) was purchased from Hellma. The dye NK88 was purchased from Exciton, Inc.
3 Methods
3.1 Principles of the Setup
A schematic presentation of the setup is shown in Fig. 1.
Fig. 1
Schematic representation of the setup. S sample; K Kerr cell; P 1 , P 2 crossed polarizers; O 1 , O 2 , O 3 reflective objectives; SP 1 spectrometer connected to cooled CCD for gated fluorescence detection; SP 2 reference spectrometer; D dichroic mirror; F 1 filter to block pump beam; F 2 filter to block gate pulse; M 1 mirror to direct gate pulse; M 2 pickup mirror
Excitation light pulses are generated with a femtosecond amplifier system. A mode-locked home-built Ti:sapphire laser is used to generate short light pulses at a central wavelength of 800 nm with a duration of about 50 fs and a pulse energy of ~2 nJ (200 mW) at a repetition rate of 100 MHz. The pulses are then passed through a regenerative amplification system (Spitfire, Spectra-Physics), increasing the pulse energy to ~400 μJ (400 mW) at a repetition rate of 1 kHz, with a pulse duration of about 100 fs. The output of the amplifier is split into two. One fraction is directed into the optical delay line and then used as a gate pulse. The second fraction is used for the generation of the pump pulse, by frequency doubling in a ß-barium-borate (BBO) crystal yielding pulses centered at 400 nm, or alternatively by frequency conversion in a noncollinear optical parametric amplifier (NOPA) which yields pulses with adjustable central wavelengths in the visible spectral range [13]. The intensity of the pump and gate beams is adjusted with neutral density filters. The polarization of the pump pulses is set to “magic angle” (54.7°) with respect to the polarization direction of the first polarizer (P1) to avoid polarization effects from anisotropy in the excited sample (see Note 1). The pump pulse is directed into the sample via a 90° dichroic mirror and focused to ~150 μm with a lens with a focal length of 5 cm (Fig. 1, L1). This lens is also used to collect fluorescence emitted in the backward direction and that is transmitted through the dichroic mirror (Fig. 1, D, reflecting at the excitation wavelength and transmitting in the emission spectral range, see below) and focused into a spectrometer (Fig. 1, SP2) (Ocean Optics USB2000 + VIS-NIR) in order to monitor fluctuations in total fluorescence (see Note 2). The sample is contained in a moving, 1 mm internal thickness, quartz cell (Fig. 1, S) (see Note 3).
To avoid strong dispersion that cannot be compensated and would deteriorate the time resolution, reflective optics are employed to collect the emitted light. Fluorescence is collimated in the forward direction by a Cassegrain-type reflective objective (RO) (Newport 50105-02, effective focal length 13 mm, working distance 24 mm) (Fig. 1, O1) (see Note 4). A vertically oriented thin polarizer (Moxtek PFU04C, thickness 0.7 mm) is placed (Fig. 1, P1) in the collimated beam. The linearly polarized fluorescence is then refocused by a second RO (Fig. 1, O2) and overlapped spatially within the gate beam inside the Kerr medium (Fig. 1, K) (see Note 5). After the Kerr medium, a third RO (Fig. 1, O3) is used to recollimate the fluorescence beam. A second, horizontally oriented polarizer is placed after this RO (Fig. 1, P2) so that fluorescence undergoing the gate-induced polarization rotation may partially pass. This “gated” fluorescence is directed into the slit of the spectrograph (Acton, SP2150) and detected by a nitrogen-cooled CCD (Fig. 1, SP1) (Princeton Instruments, SPEC-10) configured as an array-detector.
3.2 Calibration of the Setup
Temporal dispersion: The remaining unavoidable transitive optics between the sample and the Kerr medium (i.e., cells, filter, and polarizer) will give rise to temporal spreading of different spectral components due to dispersion. This dispersion can be taken into account during data processing and analysis by using a dispersion curve. This curve can be estimated by gating white light (super continuum) generated on the position of the sample and assuming that the signal resembles the instrument response function (IRF) of the system at each wavelength.
Color sensitivity of the detector: The wavelength-dependent sensitivity of the system determined by the transmission/reflection curves of the optical components and the CCD sensitivity can be taken into account using an incoherent broadband (“white”) light source with known spectrum (calibrated lamp). The spectrum of the lamp placed at the sample position is measured with high S/N, and intrinsic fluorescence spectra are calculated by weighting the recorded spectra by the ratio of “true” lamp spectrum divided by measured lamp spectrum. The wavelength dependence of the gate efficiency is taken into account by comparing the time-integrated gated fluorescence spectrum (or, for long-lived dyes, long-time gated fluorescence) with the total fluorescence spectrum measured with a calibrated fluorimeter; several dyes can be used to cover a large spectral range [10].
Determination of the temporal IRF: The most convenient way to determine the temporal IRF, i.e., the convolution of the pump pulse and the gate response, is to measure the gated scatter from the pump pulse (Fig. 2). The Kerr effect has electronic and nuclear components. For Suprasil only the electronic component is significant and the gate response is quasi-instantaneous, following the gate pulse. The drawback for the ultrafast response is the low efficiency (defined as the fraction of the fluorescence at the maximum of the gate passing through the crossed polarizers) of the gate, less than 1 %. In liquids (benzene and CS2) the Kerr effect is predominantly due to the nuclear response that has inertial components. Therefore the total response slows down and becomes asymmetric (Fig. 2). However, the gate efficiency in such cases is higher (on the order of few percent). As the Kerr response in liquids may depend on the power of the gate pulse [14], the IRF should be determined under gate conditions of the experiment. In practice, the power of the gate beam is limited by continuum generation in the Kerr medium, to ~10, ~4, and ~2.5 mW for Suprasil, CS2, and benzene, respectively, under our experimental conditions. By using different Kerr media it is possible to vary width and efficiency of the gate. Combination of these experiments (together with simultaneous analysis) then optimizes the dynamic range and data accumulation time.
Fig. 2
(a) Spectro-temporal response of scattered pump pulse with Suprasil as Kerr medium. Cross section in time and spectral domains. (b) Gate profiles obtained with different Kerr media; dashed lines display FWHM: Suprasil ~200 fs, benzene ~ 550 fs, CS2 ~ 1 ps. Note the asymmetric tail observed for negative delay times for benzene and CS2 due to the dynamics induced by the gate pulse in the Kerr medium
3.3 Alignment of the Setup
The aim of the following alignment procedure is to optimize the amount of gated fluorescence delivered to the spectrometer while minimizing possible aberrations leading to polarization distortions between the two polarizers and hence enhance background fluorescence and noise. In our setup an extinction ratio of 1,500 for the non-gated fluorescence is routinely achieved.
In a first assembly the axis of the setup is defined by directing the pump beam directly to the slit of the spectrometer. Subsequently, step by step all elements starting from lens L1 (see Fig. 1 for a sketch of the optical alignment) are added in such a way that the fluorescence always propagates along the axis defined in the first step. A complication in the alignment arises from the layout of the Cassegrain objectives, in which the central part of the aperture on the focal side is obscured by the convex interior mirror (see Fig. 3a). However, in our setup this feature is also exploited by using it as a beam stop for the excitation (O1) and gate (O3) pulses which are much more intense than the fluorescence (see Note 6). Also the blocked central part of O2 is exploited as a support for the mount of the pickup mirror M2 that directs the gate beam into the Kerr medium (O2) along the axis of the setup (Fig. 3b) [9] (see Note 5).
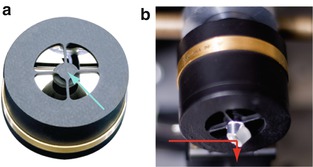
Fig. 3
(a) Cassegrain-type reflective objective from Newport. (b) Pickup mirror mounted on the output of O2 for directing of the gate pulse. The red arrow represents the path direction of the gate beam
Because of the blocked central part of the reflective objectives, the alignment is done using scattered pump light, fluorescence from a sample, or white light generated at the position of the sample. For the initial alignment, it is convenient to use a photostable high-yield dye with a long fluorescence lifetime (coumarin, Alexa, rhodamine etc., depending on the central wavelength of the pump pulse), because it can be placed in the same cell as the sample. The design features of the RO can be used as a reference in aligning O1 and O3 (Fig. 1) (see Note 7). In the course of optimizing the path of the fluorescence from the sample through the three ROs, the polarizers (initially set parallel ||), and the lens to the spectrometer, the Kerr medium should be placed as well.
Subsequently the gate pulse is introduced into the setup. The spatial overlap of the focused fluorescence with the focused gate pulse can initially be obtained by placing a pinhole that is somewhat smaller than the fluorescence focal spot at the position of the Kerr cell such that fluorescence transmission is optimized, and steering the gate pulse through. The delay line defines the temporal delay between excitation and gating; therefore the maximum time window of the experiment is defined by the optical length of the delay line. Care must be taken to ensure optimal spatial overlap along the entire delay line (see Note 8).
Subsequently, the temporal overlap of the fluorescence and gate is determined. For ease of detecting gated fluorescence, changing to a short-lived fluorescent dye (with an associated low fluorescence yield) is preferred. In this case the ratio of the gated signal and the background fluorescence (that leaks through the crossed polarizers) is the highest (see Note 9). Among the molecular species with favorable properties are the short-chain cyanine dyes (as, e.g., listed in [15]) such as NK88 (see below) for which internal conversion through a conical intersection occurs on the picosecond timescale. To find the signal, the gate pulse must coincide with the fluorescence; for dyes with a lifetime in the order of a few picoseconds this corresponds to a delay line range on the order of 1 mm. The optical delay line is therefore slowly scanned. When the gate pulse and the fluorescence temporally overlap, the detector will measure a signal of gated fluorescence light and the delay then can be adjusted for optimal signal (see Note 10).
3.4 Performing Experiment
The delay between the pump pulse and the gate pulse defines the relative moment in time for which a spectral snapshot is taken (Kerr gate open); therefore the set of delay line positions defines the time axis of the measurement. Often, it is practical to use a multiscale or a nonlinear time axis so that the step size is adapted to the timescale of the changes. The step size in the time around t = 0 (abbreviated “t 0”) should be constant, should be adapted to the IRF, and in particular should extend long enough to negative times to fully encompass the IRF (see Fig. 2). As explained above, the highest dynamic range may be obtained by using different active media, thus varying the width and efficiency of the Kerr gate and combining the data from these experiments (see Note 11).
Stay updated, free articles. Join our Telegram channel

Full access? Get Clinical Tree


