Fig. 26.1
Decision tree—defining critical quality attributes comparability criteria
The first step in comparability determination is defining the target CQAs (T). To assess manufacturing capability (ΔM), one must have two inputs, analytical variability (ΔA) and process variability (ΔP). Based on the knowledge of structure activity relationships, existing clinical and pre-clinical experience, and manufacturing capability, the comparability acceptance criteria (ΔC) should be proposed for each CQA.
To ensure consistency in comparability study practice, a statistics-based systematic approach is recommended. The comparison of the results to the acceptance criteria allows for an objective assessment of whether or not the two products are comparable. This section outlines the general statistical methods to be used in evaluating comparability. Assessing comparability is NOT just about meeting the predefined specification/criterion where the specification/criterion of the proposed post-change product should not be wider than the variability of pre-change product. Developing an analytical method in differentiating meaningful difference is critical and important.
With those considerations, three statistical models are proposed below: (1) a non-paired head-to-head comparison where the two substances/products can be tested within a single assay run, such as sequential measurements by HPLC, (2) a paired head-to-head analytical comparability where pre-change and proposed post-change product materials can be tested simultaneously, such as the measurements in a potency assay, and (3) one-sided testing of proposed post-change product materials against a pre-existing database for the pre-change product. It is recommended that the actual study design and data analysis should be carried out with the close collaboration of a statistician.
26.2.1.1 Unpaired Quality Attributes
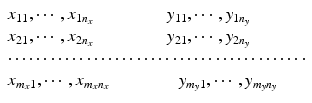
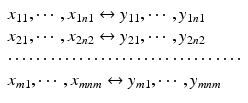
Consider the most commonly seen data structure, for example, HPLC generated data where non-paired observations are produced from both the proposed post-change and the pre-change product. The data structure is
 where
where  ,
,  ,
,  ,
,  ,
,  ,
,  . Let x ij be the observed j th critical quality attribute measurement for the pre-change (reference) product for lot (batch, or run) i, where
  ,
,  , n x is the number of measurements for each reference lot, and m x is the number of reference lots used. Let y kj be the observed j th critical quality attribute measurement for the proposed post-change product (test) for lot k, where
  ,
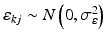
,  , n y is the number of measurements for each test product lot, and m y is the number of test product lots used. The σ x 2 and σ δ 2 are the process variability and the assay variability for the reference product, respectively. Similarly, the σ y 2 and σ ε 2 are the process variability and the assay variability for the test product, respectively. The goal is to compare the two products (test vs reference) and see how similar they are.
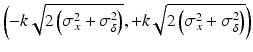
, , , , , . Let x ij be the observed j th critical quality attribute measurement for the pre-change (reference) product for lot (batch, or run) i, where , , n x is the number of measurements for each reference lot, and m x is the number of reference lots used. Let y kj be the observed j th critical quality attribute measurement for the proposed post-change product (test) for lot k, where , , n y is the number of measurements for each test product lot, and m y is the number of test product lots used. The σ x 2 and σ δ 2 are the process variability and the assay variability for the reference product, respectively. Similarly, the σ y 2 and σ ε 2 are the process variability and the assay variability for the test product, respectively. The goal is to compare the two products (test vs reference) and see how similar they are.For this type of data, formal statistical approaches are traditionally used such as the two one-sided test (TOST) to assess equivalence of means with the pre-specified acceptance criteria (Chatfield et al. 2011). However, the assessment of how similar the test and the reference product are to each other is not necessarily straightforward since how similar is similar enough is not well defined and scientific/clinical judgment may not be easily available. Thus, Liao and Darken (2013) proposed a method using a tolerance interval (TI) and a plausibility interval (PI) to define the comparability criteria. The basic idea is described here. Consider a hypothesized study where the test is also the reference. Since the reference product is an established or approved product, therefore the test (here it is the reference also in this hypothesized study) should be almost always comparable to the reference (itself). Any observed difference is due to chance and the difference is clinically negligible. Thus if any difference is within the reference variability, it is reasonable to conclude comparability between the test and the reference. Toward this end, an interval called the Plausibility Interval (PI) was proposed to quantify this reference variability. The assay + process PI for the difference between the reference and itself is defined as follows:

where the critical value k is a factor to control the sponsor’s tolerance, the σ x 2 and σ δ 2 are the process variability and the assay variability for the reference product, respectively, which can be estimated from the commonly used variance decomposition method. Note that the interval in Eq. (26.1) is defined for the difference of test and reference. The PI defines the acceptable range for the quality attribute difference between the test and the reference to fall within. Any difference within this PI should be considered practically acceptable, and thus it can serve as a goalpost for judging comparability. The concept of “goal posts,” whereby the attributes of the post-change product fall within the demonstrated variation of the reference over its lifetime, is becoming a widely accepted approach for creation of a “highly similar” comparable product (McCamish and Woollett 2013).
(26.1)
An at least p-content with confidence  tolerance interval for the difference between the test and the reference is constructed so that
![$$ \Pr \left[ \Pr \left(L<Y-X<U\right)\ge p\right]\ge 1-\alpha $$](/wp-content/uploads/2016/07/A330233_1_En_26_Chapter_Equ2.gif)
where L and U are statistics calculated from the data, X(Y) is the quality attribute of the reference (test). In most practical applications,  and p are typically chosen from the set of values {0.90, 0.95, 0.99} (Krishnamoorthy and Mathew 2009). The choice of the combination can be used to control the risk for both consumer and the sponsor. The interval (L, U) is usually termed as the approximate
 ![$$ \left[100\times \left(1-\alpha \right)\%\right]/\left[100\times p\%\right] $$](/wp-content/uploads/2016/07/A330233_1_En_26_Chapter_IEq13.gif) TI. In order to construct the approximate
TI. In order to construct the approximate ![$$ \left[100\times \left(1-\alpha \right)\%\right]/\left[100\times p\%\right] $$](/wp-content/uploads/2016/07/A330233_1_En_26_Chapter_IEq14.gif) TI, the method based on the Satterthwaite approximation recommended by Krishnamoorthy et al. (2011) is used, where the lower bound L and the upper bound U are defined as follows.
TI, the method based on the Satterthwaite approximation recommended by Krishnamoorthy et al. (2011) is used, where the lower bound L and the upper bound U are defined as follows.
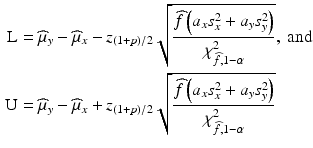 where
where  is the
  percentile of a normal distribution,
  is the
  percentile of a chi-square distribution with df = f, s x 2 and s y 2 are the estimates for the total variance of the reference and the test product, respectively and can be estimated from the commonly used variance decomposition method,
  ,
,  ,
,  ,
,  and
and 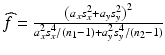 ,
,  and
and  can be estimated using the weighted average.
tolerance interval for the difference between the test and the reference is constructed so that(26.2)
and p are typically chosen from the set of values {0.90, 0.95, 0.99} (Krishnamoorthy and Mathew 2009). The choice of the combination can be used to control the risk for both consumer and the sponsor. The interval (L, U) is usually termed as the approximate TI. In order to construct the approximate TI, the method based on the Satterthwaite approximation recommended by Krishnamoorthy et al. (2011) is used, where the lower bound L and the upper bound U are defined as follows. is the percentile of a normal distribution, is the percentile of a chi-square distribution with df = f, s x 2 and s y 2 are the estimates for the total variance of the reference and the test product, respectively and can be estimated from the commonly used variance decomposition method, , , , and , and can be estimated using the weighted average.The test and the reference are claimed comparable if: (1) the approximate ![$$ \left[100\times \left(1-\alpha \right)\%\right]/\left[100\times p\%\right] $$](/wp-content/uploads/2016/07/A330233_1_En_26_Chapter_IEq26.gif) tolerance interval for the difference between the test and the reference defined in Eq. (26.2) is within the plausibility interval defined in Eqs. (26.1); and (2) if the estimated mean ratio is within a specified boundary, for example, [0.8, 1.25].
tolerance interval for the difference between the test and the reference defined in Eq. (26.2) is within the plausibility interval defined in Eqs. (26.1); and (2) if the estimated mean ratio is within a specified boundary, for example, [0.8, 1.25].
tolerance interval for the difference between the test and the reference defined in Eq. (26.2) is within the plausibility interval defined in Eqs. (26.1); and (2) if the estimated mean ratio is within a specified boundary, for example, [0.8, 1.25].Note that the tolerance interval is used here instead of the commonly used confidence interval. A confidence interval’s width is due entirely to sampling error but in contrast, the width of a tolerance interval is due to both sampling error and variance in the population. As the sample size approaches the entire population, the width of the confidence interval approaches zero but in contrast, the width of the confidence interval gives the estimated percentiles approaching the true population percentiles. When comparing to the reference variability scaled range, the tolerance interval is a more appropriate choice.
The first condition in the comparability acceptance criteria is to control false failing comparability claims and the second condition is to control false passing comparability claims. It is a capability based approach which could falsely pass a large mean difference for the test product due to a large reference product variability. The additional point-estimate constraint in the second condition eliminates the potential that a test product with a large mean difference would enter the market (Haidar et al. 2007, 2008).
In contrast to the traditional equivalence approach for just testing the equivalence of means, one of the advantages of the new approach is that it also considers the variability instead of just the mean difference. The performance and feasibility of this approach was demonstrated through simulation studies and an example, and details can be found in Liao and Darken (2013). The simulation results showed that the between batch variability of the reference product plays a very important role in passing comparability. The number of batches that should be used in the comparability study heavily depends on the between batch variability. Larger number of batches is needed when the between batch variability is higher. At least two different batches should always be used in the head-to-head comparison. Using simulation and real data, Liao and Darken (2013) recommended using k = 2.5 or 3 in constructing the PI in Eq. (26.1). However, the actual k value can be chosen case-by-case depending on the nature of the reference product and still be consistent with health authorities’ requirements.
26.2.1.2 Paired Quality Attributes
Consider the paired data structure, a comparison of the relative potency of the proposed post-change product (test) with this potency of reference standard. As recommended in ICH Q6B, an in-house reference standard(s) should always be qualified and used for control of the manufacturing process and product. Thus, the relative potency data for both the pre-change product (reference) and the post-change product (test) are a relative potency of the reference product to the in-house standard and the relative potency of the test product to the in-house standard. The data structure is
 where
where  ,
,  ,
,  ,
,  ,
,  ,
,  , x ij is the observed j th critical quality attribute measurement for the reference product for lot (batch, or run) i,
  ,
,  , m is the number of reference lots, and n i is the number of measurements for reference lot i, y ij is the observed j th critical quality attribute measurement for the test product for lot i,
  ,
,  , m is the number of test product lot, and n i is the number of measurements for the test product lot i. The σ x 2 and σ δ 2 are the process variability and the assay variability for the reference product, respectively, and σ y 2 and σ ε 2 are the process variability and the assay variability for the test product, respectively. Thus, the observed data are (i, x ij , y ij ), where
  ,
,  . For lot i, it is reasonable to assume that there exists a linear relationship
  ,
,  . The goal is to compare the two products (test vs reference) and see how similar they are.
, , , , , , x ij is the observed j th critical quality attribute measurement for the reference product for lot (batch, or run) i, , , m is the number of reference lots, and n i is the number of measurements for reference lot i, y ij is the observed j th critical quality attribute measurement for the test product for lot i, , , m is the number of test product lot, and n i is the number of measurements for the test product lot i. The σ x 2 and σ δ 2 are the process variability and the assay variability for the reference product, respectively, and σ y 2 and σ ε 2 are the process variability and the assay variability for the test product, respectively. Thus, the observed data are (i, x ij , y ij ), where , . For lot i, it is reasonable to assume that there exists a linear relationship , . The goal is to compare the two products (test vs reference) and see how similar they are.Given  paired observations (i, x ij , y ij ), where x ij is the observation of independent variable from the reference product and y ij is the observation of the response from the test product,
  , and m is the total number of lots. In the current case with the paired observations, consider a linear structural measurement error model (Fuller 1987) for lot (batch, or run) i as follows.

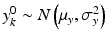
where ε ij and δ ij are independent with normal distributions N(0, σ ε 2) and N(0, σ δ 2), respectively. Note that both x i 0 and y i 0 are still a random variable in a structural measurement error model (Fuller 1987). In order to avoid the unidentifiability problem, the reliability ratio  is assumed fixed and known. In the comparability study setting, it is reasonable to assume the reliability ratio λ = 1. The parameters in each source are a sample from a bivariate normal distribution such as
where Δ i is a bivariate normal distribution with mean 0 and covariance matrix . Combining Eqs. (26.3), (26.4) and (26.5) results in a linear mixed-effects structural measurement error model.
paired observations (i, x ij , y ij ), where x ij is the observation of independent variable from the reference product and y ij is the observation of the response from the test product, , and m is the total number of lots. In the current case with the paired observations, consider a linear structural measurement error model (Fuller 1987) for lot (batch, or run) i as follows.(26.3)
(26.4)
is assumed fixed and known. In the comparability study setting, it is reasonable to assume the reliability ratio λ = 1. The parameters in each source are a sample from a bivariate normal distribution such as(26.5)
. Combining Eqs. (26.3), (26.4) and (26.5) results in a linear mixed-effects structural measurement error model.Following the same ideas laid out for analyzing the unpaired critical quality attributes, a ![$$ \left[100\times \left(1-\alpha \right)\%\right]/\left[100\times p\%\right] $$](/wp-content/uploads/2016/07/A330233_1_En_26_Chapter_IEq45.gif) tolerance interval for the difference of the test and the reference and a plausibility interval will be constructed. Thus, the assay + process PI for the difference between the reference against the reference itself is defined as follows:
tolerance interval for the difference of the test and the reference and a plausibility interval will be constructed. Thus, the assay + process PI for the difference between the reference against the reference itself is defined as follows:
where the critical value k is a factor to control the sponsor’s tolerance, the σ x 2 and σ δ 2 are the process variability and the assay variability for the reference product, respectively. The PI defines the acceptable range for the difference between the test and the reference to fall within and any difference within this PI should be considered practically acceptable. Following the same recommendation for the non-paired case, the k = 2.5 or 3 is recommended for constructing the PI in Eq. (26.6). However, the actual k value can be chosen case-by-case depending on the nature of the reference product and still be in alignment with health authorities’ requirements.
< div class='tao-gold-member'>
tolerance interval for the difference of the test and the reference and a plausibility interval will be constructed. Thus, the assay + process PI for the difference between the reference against the reference itself is defined as follows:(26.6)
Only gold members can continue reading. Log In or Register to continue
Stay updated, free articles. Join our Telegram channel

Full access? Get Clinical Tree


