Chapter 5
Specialized Topics in Pharmaceutical Forecasting
If you can look into the seeds of time, and say which grain will grow and which will not, speak then unto me.
William Shakespeare
A good forecaster is not smarter than everyone else, he merely has his ignorance better organised.
Oscar Wilde
Several dynamics have been operating in the pharmaceutical markets in the last few years that pose specialized challenges for the forecaster. Two of these challenges are the focus on specialty markets (or diseases) and the increasing role of biologics in disease treatment. This chapter discusses the implications of these trends on pharmaceutical forecasting.
Orphan Drugs
An orphan drug is a pharmaceutical product used to treat rare diseases. The designation of orphan drug status was first defined in the US in 1983 with the passage of the ‘Orphan Drug Act of 1983.’1 Subsequently, similar legislation was approved in Singapore in 1991, Japan in 1993, Australia in 1997, and the European Union in 2000.
Disease prevalence is the main metric used to define whether or not a therapy qualifies as an orphan drug. Although the definitions vary slightly by country, in general a prevalence of <5 in 10,000 is required for orphan drug status. In the United Kingdom a therapeutic that treats a disease with prevalence of <1 in 10,000 qualifies as an ‘ultra-orphan drug.’ Disease prevalence that qualifies therapeutics for orphan drug status in several major markets is shown in Table 5.1.
Table 5.1 Disease prevalence for orphan drug status

Rare diseases normally are processes that shorten survival and affect the health-related quality of life of the patients. They often are difficult to diagnose. Overall, 80 percent of rare diseases are of genetic origin and 75 percent affect children, representing a substantial cause of premature deaths.2 Therefore the unmet medical need posed by rare diseases is substantial.
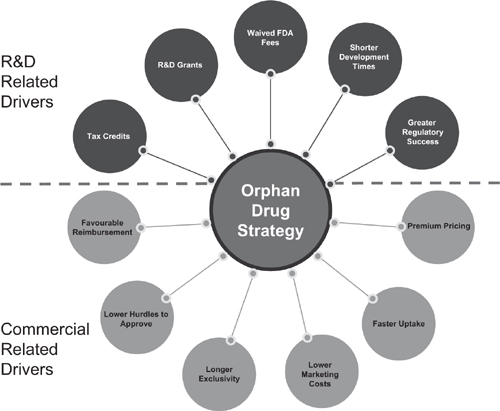
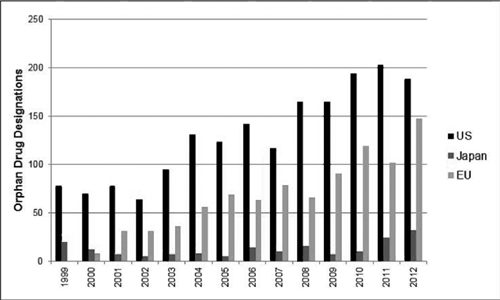
In addition to satisfying this unmet medical need, the advantages for a pharmaceutical manufacturer from a product being designated an orphan drug are numerous, encompassing both commercial- and R&D-related drivers. Meekings et al. characterized these drivers as shown in Figure 5.1. Although the details of the incentives vary by region or country, the overall incentive structure is applicable to all orphan drug markets. These incentives have been successful and the number of therapeutics designated as orphan drugs has risen over the last several years, as shown in Figure 5.2.
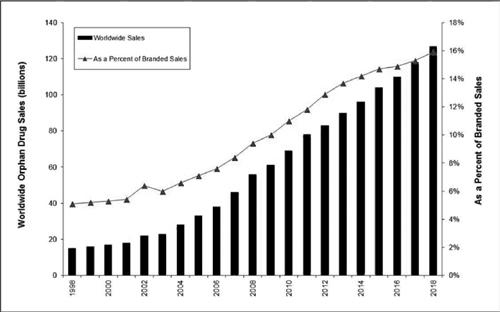
In addition to the number of orphan drug designations rising over time, their contribution to worldwide branded pharmaceutical revenue has also been steadily rising (Figure 5.3). EvaluatePharma has forecast worldwide sales of US$127 billion in 2018 with a revenue share of almost 16 percent of the branded prescription market.3 They further project the growth of the orphan drug market to be double that of the overall prescription market between 2012 and 2018.
Figure 5.1 Summary of incentives for orphan drug development
Figure 5.2 Orphan drug designations
Figure 5.3 Worldwide orphan drug sales and share of branded drug market
In the US, the most common orphan drug designations are for various cancers (over 250 designations in blood and solid tumor cancers). The second most common therapy area in the US is infectious disease, which includes AIDS, malaria, and pneumonia. The third most common therapy area in the US for orphan drug designations is idiopathic pulmonary hypertension. In the EU, oncology indications also lead the designations for orphan drugs, followed by metabolism indications. In all markets, orphan drugs have been developed to address genetic diseases, such as enzyme deficiencies.
The continued focus of industry on orphan drug development brings challenges to the forecaster. Using the construct discussed in Chapter 3 for new product forecasting we can categorize these challenges into three areas: epidemiology, share and adoption, and price and reimbursement sensitivity.
EPIDEMIOLOGY
Epidemiology for rare disorders can be difficult to obtain due to lack of data. For example, to get to the ‘true’ prevalence of a rare genetic disorder the diagnosis would have to be made at birth, before any ensuing mortality results. For many rare diseases the prevalence is only determined after a diagnosis has been made. However, the percentage of patients who are diagnosed and treated for each stage of their disease also can be difficult to obtain. Many people with rare diseases experience an extended period of medical testing and procedures before a diagnosis is made. In a recent study in the United Kingdom, 46 percent of patients waited more than one year for a diagnosis; 20 percent of patients waited over five years; and 12 percent of patients waited over ten years.4
Another challenge is a lack of consistency between studies used to measure prevalence or incidence data, poor documentation of methods employed, confusion between incidence at birth versus life-long incidence, and even confusion between incidence and prevalence data. The forecaster also must be wary of bias in the data. There likely is an overestimation for most diseases if founder effects (discussed in the next chapter) are applied to populations.
What is the implication for the forecaster? If prevalence data are determined using patients who already have been diagnosed there is a danger of underestimating the market size. The sparseness of ‘true’ prevalence data frequently leads to conflicting data sources in the literature – the robustness leant to data analysis by large sample sizes and multiple studies simply do not exist. In this situation the forecast needs to make use of forecast ranges and communicate the underlying uncertainty to the key decision makers, as discussed in Chapter 2.
One approach the forecaster may consider in modeling rare disorders is to look at founder effects. In population genetics, the founder effect is the loss of genetic variation that occurs when a new population is established by a very small number of individuals from a larger population. Applying this concept to rare diseases, we note higher prevalence of certain diseases among patient subpopulations. For example, the Amish populations in the United States exhibit founder effects because they have grown from a very few founders, have not recruited newcomers, and tend to marry within the community. Phenomena such as polydactyly (extra fingers and toes, a symptom of Ellis-van Creveld syndrome) are more common in Amish communities than in the American population at large. Maple syrup urine disease affects approximately one out of 180,000 infants in the general US population, but this disease has a much higher prevalence in children of Amish, Mennonite, and Jewish descent. Similarly, Ashkenazi Jews have a particularly high chance of suffering from Tay-Sachs disease, a fatal condition in young children. Founder effects also have been observed in numerous rare diseases.
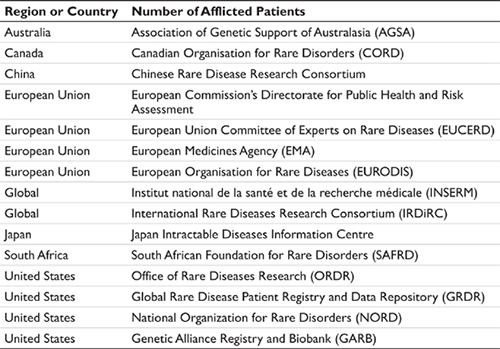
A second approach for obtaining epidemiology data is to use patient advocacy groups and resources such as Orphanet – an open access, online journal that published reviews on select rare diseases. Orphanet partners with multiple countries to catalog and offer prevalence and other data related to rare diseases. There also are available a number of government and private agencies that offer information related to rare diseases. A representative list is shown in Table 5.2. In addition to these sources, patient advocacy groups also maintain libraries of literature for the diseases represented by the advocates, and this also can be a source for the forecaster.
Table 5.2 Representative sources for data on rare diseases

For many diseases no diagnostic methods exist or diagnostic facilities are unavailable. Many rare disorders do not have diagnostic coding characterizations developed, making calibration and validation of forecast models challenging. Although the pace of gene discovery for rare genetic diseases has been increasing, translation of these discoveries into clinical utility has lagged. This also creates challenges for the forecaster in validating and calibrating forecast models.
There are some therapy areas where the prevalence data are more robust. These include oncology, cardiovascular disease, infectious disease, and transplantation. In these therapy areas the traditional approaches to obtaining prevalence and/or incidence data work well. This does not mean that uncertainty in the prevalence data are removed, but implies that the uncertainty in the forecast due to the uncertainty in the prevalence data may be lessened.
PRODUCT SHARE AND ADOPTION
When orphan drugs first appeared in the markets, calculation of share was relatively straightforward. Since the orphan drug typically represented the only therapy available for a patient there was no competition and product share was assumed to be 100 percent. Growth in revenue was attributed to identifying patients and placing them on therapy, rather than competing against another product for existing patients.
Stay updated, free articles. Join our Telegram channel

Full access? Get Clinical Tree


