Response Following a Single Dose
OBJECTIVES
The reader will be able to:
- Define the following terms: duration of effect, effect compartment, hysteresis, pharmacokinetic–pharmacodynamic modeling, onset of effect, pharmacokinetic rate-limited response, pharmacodynamic rate-limited response, site of action, and time delay.
- Show graphically how one can readily detect when response does not track the plasma drug concentration after a single extravascular dose, and give at least three explanations for the delay.
- Give two examples each of situations in which measured response is rate-limited by pharmacokinetics and pharmacodynamics.
- Explain why a graded response tends to decline linearly with time after a single dose when response lies between 80% and 20% of its maximum.
- Discuss two situations in which response declines more slowly than plasma drug concentration.
- Explain why duration of response is often proportional to the logarithm of dose; and when it is, calculate both the minimum-effective dose and the effective half-life.
 n Chapter 2, Fundamental Concepts and Terminology, we primarily considered the relationship between systemic exposure and response, that is, the pharmacodynamics of the drug, without much consideration of time. In practice, time always needs to be considered. In this chapter, we integrate pharmacokinetics with response over time following a single dose of drug. Subsequently, in Chapter 10, Constant-Rate Input, and Chapter 11, Multiple-Dose Regimens, we consider events after continuous and chronic administration. The ensuing discussion is generally restricted to drugs that act reversibly to produce a response. Furthermore, metabolites are considered to be either inactive or not to reach a sufficiently high concentration to contribute to response, although this restriction is lifted in Chapter 20, Metabolites and Drug Response.
It is important to realize that the amount of drug involved in producing a response at the site of action is usually only a minute fraction of the total amount in the body. Consequently, drug so involved generally has little to no effect on its own pharmacokinetics, but exceptions do exist as discussed in Chapter 17, Nonlinearities, and Chapter 21, Protein Drugs.
TIME DELAYS BETWEEN CONCENTRATION AND RESPONSE
Drug response often lags behind plasma concentration. Let us examine how such delays are detected and how they come about.
DETECTING TIME DELAYS
A striking example of a delay in effect is the rise in left ventricular ejection-time index—a measure of effect of digoxin on the heart—while the plasma concentration falls during the first 4 hr after an intravenous (i.v.) bolus dose of digoxin (Fig. 8-1). Certainly, these data do not mean that less drug is needed to produce a greater response. Rather, distribution of digoxin into cardiac tissue with subsequent binding to the target receptor is slow. Therefore, to use plasma concentration as a guide to drug effect, one should wait until distribution equilibrium of drug between plasma and cardiac tissue is reached, which is about 6 hr after a dose of digoxin. When relating response to concentration before 6 hr, an absurd relationship is observed. The response is lowest when the concentration is highest and the converse. We would be foolish to conclude that what is needed for a substantial effect is a low concentration or no drug at all.
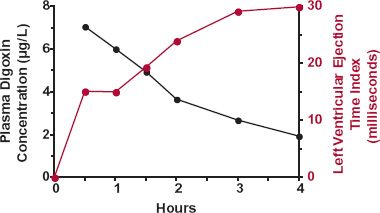
FIGURE 8-1. The prolongation in the left ventricular ejection-time index (colored line), a measure of cardiac effect, increases as the plasma digoxin concentration (black line) declines for 4 hr after i.v. administration of a 1-mg dose of digoxin. Average data from six normal subjects. (From: Shapiro W, Narahara K, Taubert K. Relationship of plasma digitoxin and digoxin to cardiac response following intravenous digitalization in man. Circulation 1970;42:1065–1072. Reproduced with permission of the American Heart Association, Inc.)
In contrast to an i.v. bolus dose, plasma drug concentration first rises and then falls following a single oral dose. This may lead to hysteresis in the concentration–response relationship—a useful diagnostic of the temporal features of drug response. Hysteresis refers to the condition in which response takes a different path than concentration with time when the concentration rises than when it falls. An example of such behavior is shown in Fig. 8-2 following the oral administration of naproxen, which is an analgesic, antipyretic, and anti-inflammatory agent. Shown in Fig. 8-2A are the plasma concentration and the mean pain relief in a dental-pain model with time after a single 500-mg dose of naproxen. Although there is a suggestion of a delay between plasma concentration and response in this graph, it becomes much more apparent when response is plotted directly against the corresponding plasma concentration (Fig. 8-2B), yielding a characteristic hysteretic loop. Initially, during the absorption phase, response lags behind the rise of naproxen in plasma. Subsequently, while the plasma concentration falls, response continues to rise. Only after 5 hr does response follow the fall in plasma concentration.
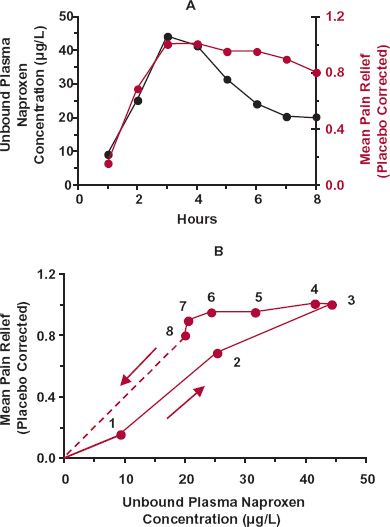
FIGURE 8-2. A. Plot of unbound plasma naproxen concentration (black line) and of associated mean pain relief (corrected for placebo response, colored line) in a dental pain model with time following an oral 500-mg dose of naproxen. B. Pain relief clearly shows hysteresis when plotted directly against the unbound plasma concentration of naproxen, in that different responses are apparent at the same unbound plasma concentration on the rising and falling parts of the concentration–time curve. The time of sampling from 1 to 8 hr is noted next to each point. Notice that the hysteresis is counterclockwise. The extrapolation beyond 8 hr indicates that eventually no benefit is achieved as the plasma-naproxen concentration falls toward zero. (From: Syntex USA Inc., Palo Alto, CA, 1994.)
Notice that the chronologic sequence of the paired concentration–response observations moves in a counterclockwise direction.
CAUSES OF TIME DELAY
There are many reasons, both kinetic and dynamic, for this counterclockwise hysteresis.
Tissue Distribution. In the case of the example of naproxen, as with many drugs, the hysteresis is caused by delayed distribution to the site of action. The therapeutic consequence of such delays depends on the clinical setting. Recall that distribution kinetics depends on tissue perfusion, membrane permeability, and tissue affinity for drug. Many drugs are small lipophilic molecules that equilibrate rapidly across well-perfused tissues (e.g., heart, brain), which are often target organs (i.e., organs containing the site of action). Under these circumstances, because the period of observation in clinical practice is often hours, if not days, a delay in effect in the order of minutes is likely to be minimal, and drug in plasma can be correlated directly with effect, provided that the measured response is rapidly produced by drug at the site of action. This was the case in the study from which the propranolol data in Fig. 2-16 in Chapter 2, Fundamental Concepts and Terminology, were obtained. Propranolol was given orally, and measurements were made over several hours, particularly after the peak plasma concentration had been reached. Even if distribution throughout the body has not been achieved, plasma concentration may still track response well; all that is required is that distribution equilibrium of drug between plasma and the active site within the target organ be rapidly achieved.
Emergency admissions and surgical procedures are special settings during which responses are frequently measured in minutes rather than hours. Here, delays in response after drug administration are almost always noticed. Even though plasma concentration monitoring is unlikely to be employed in these circumstances, it is still important to delineate the determinants of the time course of response to improve our general understanding and to optimize treatment procedures and drug use.
Pharmacodynamics. Often, the reason for the hysteresis is pharmacodynamic in origin. Much depends on the underlying dynamics of the affected system and on the closeness of the measured response to the direct action of the drug. Generally, the closer the measured response, the more rapid is that response to changes in drug concentration, which it should be recalled as one of the main reasons why biomarkers are used as early signals of drug action. To expand on these statements, consider the three situations in Fig. 8-3, with drug in Compartment A, the site of action, linked with the rest of the body. The measured response is associated with events in Compartments A, B, and C, respectively. Each downfield compartment reflects upstream changes. In reality, there are often feedback processes whereby a change in a component downstream feeds back on an upstream component to regulate the behavior of the system, sometimes producing oscillations in the level of the component with the time scale varying from minutes, to hours, to days. Also, the components of the body act as a complex three-dimensional interacting network operating in both space and time rather than as a simple linear chain depicted in Fig. 8-3. However, for didactic purposes, such complexities are not considered here.
Consider first the simplest situation, namely where Compartment A is both the site of measurement and the site of the action of a drug, be it a receptor, enzyme, or ion channel. Then, measured response is expected to track drug action instantly, resulting in a fixed relationship between them, independent of time or the shape of the concentration–time profile. An example is neuronal conduction; neuromuscular blockage is almost instantaneously reflected by measured paralysis. Another example is seen with acetylcholine esxsterase inhibitors, which by inhibiting acetylcholine hydrolysis, raise the synaptic concentration of this endogenous neurotransmitter, and thereby, in theory, aid in the treatment of Alzheimer patients. This enzyme resides in many cells, including those in the brain, the site of therapeutic action, and also within red blood cells. In addition, the equilibrium of these drugs with this enzyme is extremely rapid. Hence, drug inhibition can be directly correlated with blood concentration at all times. Occasionally, however, response declines more slowly than concentration bathing the target site in Compartment A. This can occur when a drug binds so tightly to the target site that once bound, it dissociates off very slowly. Given that the magnitude of effect depends on the degree of occupancy of the target, response then declines slowly, rate-limited by the dissociation from the target, as shown in Fig. 8-4. An example, omeprazole, is considered later in this chapter.
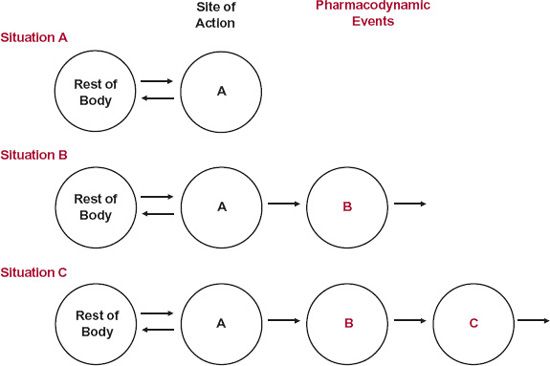
FIGURE 8-3. A drug binds to its active site located in Compartment A, which is linked to drug in the rest of the body. The measured response may relate directly to drug at the active site (Situation A) or to a downstream element in either Compartment B or Compartment C, which changes in response to the initial interaction (Situations B and C).
Now, consider the situation in which the site of measurement of response is in one of the downstream compartments. The only specific pharmacodynamic characteristic of a drug is its interaction at its primary site of action, here in Compartment A. All subsequent steps are a property of the affected system within the body and are the same, and independent of drug, for all drugs acting on the target site by the same mechanism. Two aspects now need to be considered: location and dynamics. Recall from Chapter 6, Kinetics Following an Extravascular Dose, when considering events in the body following an extravascular dose, plasma concentration reflects the net balance of input and output and always peaks later than that at the absorption site. Extending this concept to the events in Fig. 8-3, response peaks later the more distant the site of measurement is to the initial site of action, as shown in Fig. 8-5. Clearly then, a time delay in response is expected to be seen if plasma concentration corresponds to drug in Compartment A, with the delay being more pronounced as the site of measured response moves down from Compartment B to Compartment C. However, the kinetics of the subsequent events occurring between the initial interaction and the measured response varies greatly, and this will also impact on the ability to see any hysteresis or any clear evidence of a time delay in response. Sometimes, the entire pharmacodynamic system is operating so rapidly, relative to the kinetics of the drug, that measured response changes virtually instantaneously with drug concentration. In such cases, we have a pharmacokinetic rate-limited response, and hysteresis may not be seen except, perhaps, at the very earliest moments after drug administration. An example, previously considered, is the β-blockade produced by propranolol. This is essentially the case also with the benzodiazepines, producing central nervous effects, such as sedation, by interacting with the gamma aminobutyric acid (benzodiazepine) receptor. Under these conditions, the time course of response is determined primarily by the pharmacokinetics of these compounds, which differ markedly, varying from triazolam, an ultrashort-acting hypnotic with a half-life of 3 hr, to flurazepam, a long-acting hypnotic with a half-life in the order of 2 or more days. In contrast, many other measured responses are delayed because of the relatively sluggish dynamics of the affected system following direct drug action. That is, the response may be rate-limited by pharmacodynamics. Several examples are now considered, and two others, those involving effects of aspirin and omeprazole, are considered later in this chapter.
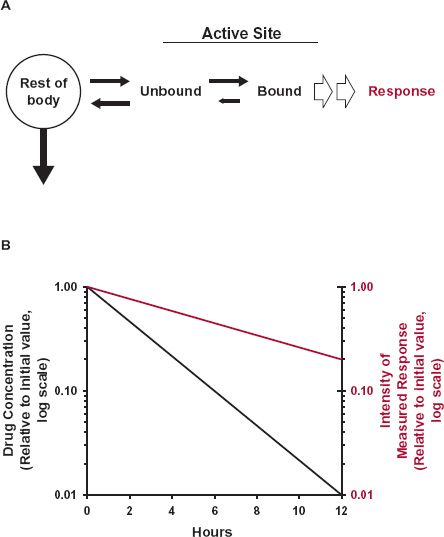
FIGURE 8-4. A. A drug reversibly binds to its site of action, and elicits a direct response with intensity dependent on the fraction of the target site occupied. Sometimes, the effect persists much longer than drug in the body. This can occur when drug binds very avidly to the active site, receptor or enzyme, and dissociates from it (small arrow) more slowly than elimination of drug from the body. B. The drug then continues to elicit its effect (colored line) long after drug has been virtually all removed from rest of the body (black line), including in the fluid surrounding the target site.
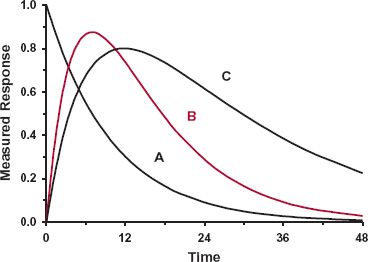
FIGURE 8-5. The site of action of a drug is located in Compartment A of the sequential scheme depicted in Fig. 8-3. Shown is the measured response versus time after than intravenous bolus dose when the measurement relates to drug at the active site (Situation A) or to events produced by the drug downstream (Situations B and C). Notice that the further downstream the measured response is relative to the site of direct action, the more sluggish it is and the later the time of its maximum value.
Systems in Flux. Returning to Fig. 8-3, a delay in measured response occurs when the site of action is say in Compartment A and the site of measurement is in Compartment B. Clearly, the system in Compartment B is in flux, dependent not only on what is happening in Compartment A, but also on events occurring between Compartments B and C. There are many such situations occurring within the body, particularly for those undergoing turnover (Chapter 2, Fundamental Concepts and Terminology, and Chapter 10, Constant-Rate Input). Two examples are now considered to illustrate this situation.
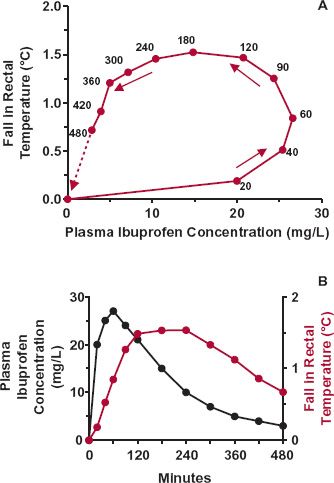
FIGURE 8-6. The fall in rectal temperature (observation minus baseline) in 36 febrile children aged from 6 months through 11 years after a 6-mg/kg oral dose of ibuprofen. A. Relationship between the fall in temperature and plasma ibuprofen concentration. Note the large degree of hysteresis present. The time of sampling (min) is indicated next to each point. B. Plasma ibuprofen concentration (black line) and fall in temperature (colored line) as a function of time after dosing. (From: Kelley MT, Walson PD, Edge JH, Cox S, Mortensen ME. Pharmacokinetics and pharmacodynamics of ibuprofen isomers and acetaminophen in febrile children. Clin Pharmacol Ther 1992;52:181–189.)
The first example is ibuprofen, an analgesic and antipyretic agent. Figure 8-6A shows the mean fall in rectal temperature, a measure of body temperature, relative to the plasma concentration when a single dose of drug is administered orally to 36 febrile children. The relationship implies that ibuprofen has little effect at early times when the concentration is high and maximal effect when the concentration has dropped to 15 mg/L. Actually, ibuprofen acts in the brain to affect the heat-control mechanism, causing decreased heat production. With rapid entry into the brain, the effect of ibuprofen there is greatest at early times and has partially worn off by the time the temperature is minimal, reflecting maximal measured response to the drug (Fig. 8-6B). Temperature is a measure of body heat. At any instant, the rate of change in body heat (and body temperature) is the difference between the rates of heat production and heat loss,

Even if heat production were instantly reduced, time is required for body heat to dissipate and body temperature to fully reflect the reduction. Note that as the concentration of ibuprofen falls, so does its effect, and gradually, the body temperature returns (in this example) toward the preexisting value.
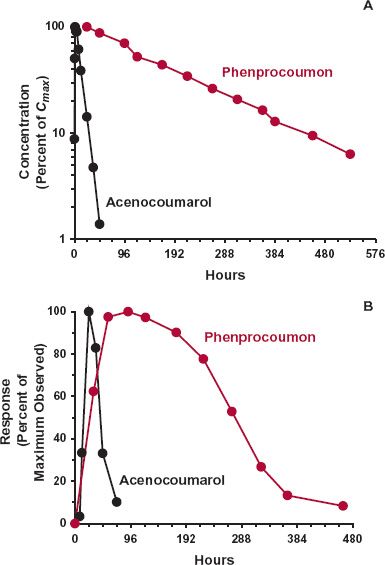
The second example is that of the oral coumarin anticoagulant, warfarin, used in the prevention of deep vein thrombosis. The response to warfarin is monitored clinically by prolongation in the clotting time of blood, which is a function of the prothrombin complex activity in plasma. The components of this complex (clotting factors II, VII, IX, and X) are turning over, being continuously formed and degraded. Figure 8-7 shows a sluggish response–time profile with the maximum occurring 1 to 2 days after the peak warfarin concentration following an oral dose of drug. The sluggishness largely reflects the slow dynamics of the affected system. The direct effect of warfarin is inhibition of the synthesis in the liver of the prothrombin complex, which actually occurs very rapidly as warfarin, a small lipophilic molecule, readily enters this highly perfused organ. The plasma-prothrombin complex activity then falls, but at a rate determined by its degradation, which is slow with a half-life in the order of 1 to 2 days. Even if synthesis were totally blocked, it would take several days for the prothrombin complex to fall, for example, to 25% of its normal value. As the plasma (and liver) concentrations of warfarin fall, so does the degree of inhibition of synthesis. The prothrombin complex activity then rises and slowly returns to its normal value, determined in substantial part by the half-life of this complex, but not solely. Keep in mind that the return of the measured response to the baseline can be rate-limited by either the pharmacokinetics of the drug or the underlying dynamics of the affected system, whichever is the slowest. This is illustrated in Fig. 8-8, which shows the pharmacokinetics and response with time following the administration of single oral doses of acenocoumarol and phenprocoumon, two other oral coumarin anticoagulants prescribed in several countries. These compounds act by the same mechanism as warfarin but have very different pharmacokinetics. In contrast to warfarin (half-life 1.5 days), acenocoumarol has a half-life of only 15 hr. So that by the time of the maximum response (24 hr), much of acenocoumarol has been eliminated and the subsequent return of clotting factor activity to baseline, by 3 days, is controlled by the turnover of the measured clotting factors. In contrast, the half-life of phenprocoumon is 6 days. Although the time to develop the maximum-observed response is similar to that seen with acenocoumarol, governed primarily by the degradation-rate constant of the clotting factor activity, the return to baseline is very much slower. It takes up to 2 weeks to do so as the return of activity is now rate-limited by the pharmacokinetics of this anticoagulant.
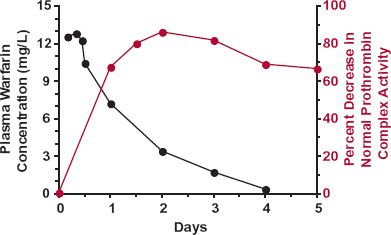
FIGURE 8-7. The sluggish response in the plasma-prothrombin complex activity (colored line) to inhibition of its synthesis in the liver by warfarin reflects the indirect nature of the measurement and the slow elimination of this complex. For the first 2 days after giving a single oral 1.5-mg/kg dose of sodium warfarin, response (defined as the percent decrease in the normal complex activity) steadily increases. During the first day, at this dose, the concentration of warfarin is sufficient to almost completely block complex synthesis. As warfarin concentration (black line) falls, the synthesis rate of the complex increases and by 48 hr equals the rate of degradation of the complex; the measured response is then at a maximum. Thereafter, as the plasma concentration falls further, with the synthesis rate exceeding the rate of degradation, the response falls. Eventually, when all the warfarin has been eliminated, the plasma-prothrombin complex activity returns—sluggishly—to the normal baseline value. The data points are the averages of five male volunteers. (From: Nagashima R, O’Reilly RA, Levy G. Kinetics of pharmacologic effects in man: the anticoagulant action of warfarin. Clin Pharmacol Ther 1969;10:22–35.)
Stay updated, free articles. Join our Telegram channel

Full access? Get Clinical Tree


