Chapter 4 Respiratory physiology
The main homeostatic responsibility of the respiratory system is maintenance of normal levels of O2, CO2 and pH within the systemic arterial blood. This blood is then distributed to actively metabolizing tissues by the circulation. Blood gas pressures, which determine the concentrations of O2 and CO2 in plasma and erythrocytes, are controlled by gas exchange between alveolar air and pulmonary blood. The pressure gradients which drive this exchange are maintained by the mixing of alveolar gas with fresh air transported into the lungs by the process of ventilation. Feedback control mechanisms regulate arterial gases through changes in the rate of pulmonary ventilation, which alter alveolar O2 and CO2 levels. Ultimately, cellular respiration uses O2 to release energy through oxidation of food molecules, producing CO2 as a byproduct, and the total rate of this energy release is referred to as the metabolic rate.
4.1 Mechanics of pulmonary ventilation
Relevant structures
Air enters the nose and is drawn through the nasopharynx into the larynx. It passes through the glottis before entering the trachea, which divides into the right and left main bronchi going to the two lungs. The airways continue to branch, decreasing in diameter (Fig. 59). Bronchi, which have cartilage in their walls, lead into bronchioles, which do not, and are, therefore, collapsible. The airways finally terminate in grape-like collections of alveoli, the main site of gas exchange. Bronchi and bronchioles contain smooth muscle and the airways are lined by mucus-secreting cells within a ciliated epithelium. These have important protective functions. The alveoli have a thin epithelial wall and are covered on their inner surface by a narrow layer of alveolar fluid. Pulmonary connective tissue contains a large amount of elastic tissue which is stretched beyond its passive resting length at normal lung volumes and, therefore, generates tension.
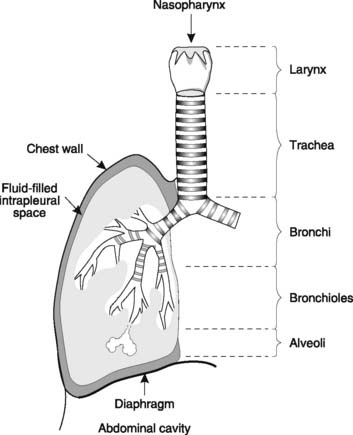
The lungs lie within the thoracic cavity. The outer surface of the lung is covered by a membrane known as the visceral or pulmonary pleura, and this is separated from the parietal pleura, which lines the inside of the thoracic cavity, by the thin layer of pleural fluid filling the intrapleural space (Fig. 59). This is sometimes called a potential space, since it contains liquid rather than gas. Liquids cannot be easily expanded or compressed and so the two layers of pleura normally remain tightly adherent to one another. The outer surface of the lung is forced to follow the movements of the diaphragm and chest wall so that lung volume increases and decreases as thoracic volume changes.
Functions of the airways
The airways have three main functions
Conduits for gas passage
The airways act as conduits connecting the atmosphere to the alveoli. The flow of gas  depends on the pressure gradient between the alveoli and the atmosphere (ΔP) and the resistance (R) of the airways (Fig. 60).
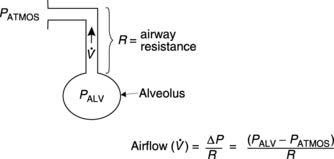
 in or out of the lungs depends on the pressure gradient (ΔP) between the alveoli and the atmosphere, and the airways resistance (R).
Protection of the lungs
Various mechanisms protect the lungs from the entry of foreign matter. The air is partially filtered by the nasal hairs, and bacteria and particles of atmospheric pollutants which escape this are usually trapped in the layer of mucus lining the airways. Continuous movement of the motile cilia on the surface of epithelial cells in the trachea, bronchi and bronchioles transports this mucus back up towards the larynx and out into the pharynx where it is swallowed. Excess mucus may contribute to the increased airways resistance in some obstructive lung diseases by partially blocking the lumen.
Forces acting on the lung
Elastic tissue
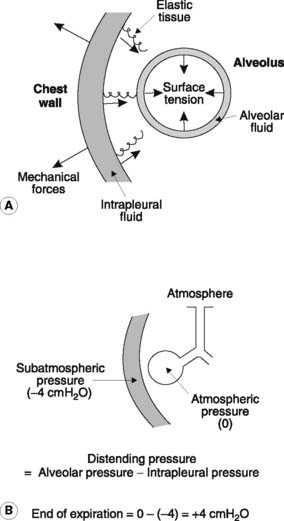
The elastic tissue of the lungs is stretched under normal conditions and the resulting tension acts as a collapsing force pulling inwards on the visceral pleura (Fig. 61A).
Negative intrapleural pressure
The elastic and surface tension effects in the lungs are normally opposed by a distending pressure caused by the negative (subatmospheric) pressure in the intrapleural space (the intrapleural pressure). This is developed as a consequence of the chest wall and diaphragm pulling outwards on the parietal pleura. Since the two layers of pleurae are being pulled in opposite directions, a negative pressure is developed in the intrapleural fluid. Consequently the pressure in the alveoli, which must equal atmospheric pressure on average since the alveoli are directly connected to the atmosphere through the airways, is greater than the pressure outside the pleural covering of the lung. The resulting transmural pressure gradient, or distending pressure, keeps the lungs inflated (Fig. 61B). If an airway ruptures or the chest wall is penetrated, however, air will be sucked into the pleural cavity, producing a pneumothorax (gas in the intrapleural space). Under these conditions, the intrapleural pressure rises to zero (atmospheric), or may even become positive, and the lung collapses.
Surfactant and alveolar surface tension
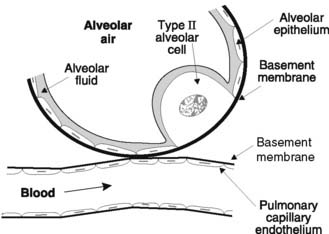
The magnitude of the surface tension resulting from the alveolar fluid is important in determining the forces necessary to keep the lungs inflated. Surfactant is a natural detergent-like substance, which is secreted into the alveoli by specialized epithelial cells in the alveolar wall known as type II alveolar cells (see Fig. 68). This reduces the surface tension relative to that of a simple electrolyte solution and allows the lungs to be kept expanded at a much less negative intrapleural pressure than would otherwise be possible. Infants born prematurely often produce inadequate amounts of surfactant and the increased effort of inflating the lungs leads to breathing difficulties, a condition known as respiratory distress syndrome.
Surfactant and alveolar stability
The surface tension in the alveoli is not just important in determining the overall effort necessary to inflate the lungs but also helps reduce the tendency of individual alveoli to collapse as they change diameter. This phenomenon, which is called alveolar instability, is best understood by considering the relationship between the distending pressure (ΔP) necessary to keep an alveolus (or any distensible sphere) inflated, its radius (r) and the tension in the walls of the alveolus (T), as described by the law of Laplace (Eq. 17 in Fig. 62). The necessary distending pressure is proportional to the tension in the wall of the sphere but inversely proportional to its radius (Fig. 62A).

As alveoli become smaller, i.e., as r decreases, pressure will tend to increase, assuming that the surface tension, which contributes significantly to the wall tension (T), remains constant. This means that the pressure should be higher in small alveoli, causing them to collapse by driving air into larger alveoli with lower internal pressures (Fig. 62B). Surfactant helps prevent this since, as alveolar diameter decreases, the concentration of surfactant in the alveolar fluid increases, reducing surface tension. Thus, alveolar wall tension (T) and radius (r) decrease (or increase) in parallel with each other and alveolar pressure (ΔP) is little affected.
Lung compliance
Compliance is a measure of the ease with which the lungs can be inflated and is determined from the gradient of a plot of lung volume against distending pressure (Fig. 63, containing Equation 18).
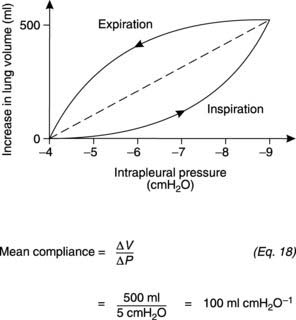
Fig. 63 The relationship between lung volume and intrapleural pressure during quiet respiration. Intrapleural pressure = −distending pressure (Fig. 60B), so the average slope of this plot (dotted line) gives the compliance under these conditions.
The relationship between lung volume and pressure demonstrates hysteresis, i.e., the shape is different during inspiration and expiration. An average compliance can be determined over the relevant range of pressures, however, using a linear interpolation (the dashed line in Fig. 63). Physiologically, the most important measure is the compliance of the lung and chest wall together, i.e., the compliance of the intact respiratory system, which is normally about 1 L kPa−1 (100 ml cmH2O−1). This may be reduced by diseases of the lung itself, e.g., those causing lung fibrosis, or by abnormalities of the chest wall.
Pressure changes during ventilation
Intrapleural pressure is about −4 cmH2O at the end of quiet expiration (Fig. 64). Contraction of the inspiratory muscles increases the outward force exerted by the diaphragm and chest wall on the parietal pleura and causes the intrapleural pressure to fall to about −9 cmH2O. This raises the distending pressure acting across the walls of the alveoli (i.e., the difference between the intra-alveolar and intrapleural pressures, Fig. 61B) and so causes the lung to expand. A small, negative intra-alveolar pressure is generated by the expansion of the alveolar walls and this draws air in from the atmosphere. (This is analogous to drawing fluid into a syringe by pulling outwards on the plunger.) In forced inspiration, maximal contraction of the inspiratory muscles is reinforced by use of the accessory inspiratory muscles in the neck, which elevate the sternum and upper ribs as well. This leads to the generation of much more negative intrapleural pressures (e.g., −30 cmH2O) and more rapid airflow.
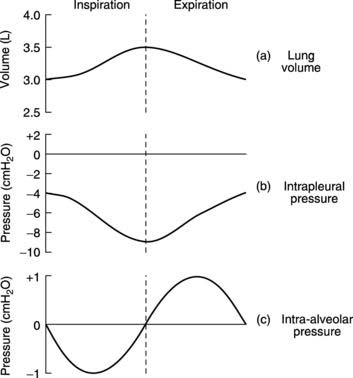
During passive expiration, the elastic recoil of the stretched lungs produces a positive intra-alveolar pressure which drives air out (Fig. 64). Active contraction of abdominal and internal intercostal muscles during forced expiration generates strongly positive intrapleural pressures (e.g. +20 cmH2O) which deflate the lungs more rapidly.
Work of breathing
Three elements contribute to this work.
Under normal conditions, the relative magnitudes of these components are:
Compliance work >> Airways resistance > Tissue resistance.
4.2 Pulmonary function tests
Lung volumes
Ventilatory volumes
The gas movement during ventilation can be recorded using a device called a spirometer (Fig. 65). This measures functionally important changes in lung volume.
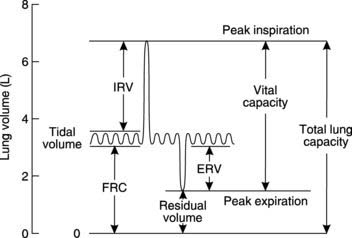
Lung capacities
Forced vital capacity and forced expiratory volume
In clinical practice, these measurements are often used to classify respiratory disease as either restrictive or obstructive in type. The patient is asked to take a maximal inspiration and then to breathe out as rapidly and fully as possible into a specialized spirometer which plots the expired volume against time in seconds (Fig. 66). Two measurements are commonly made from this.
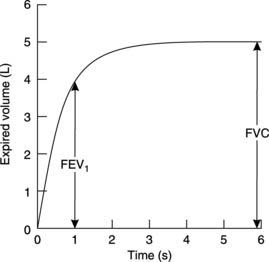
Forced expiratory volume (FEV) is the volume of gas expelled in a given time; if this is measured for the first second it is called the forced expiratory volume in 1 second (FEV1). This is limited by the speed with which gas can be forced through the airways and is decreased in obstructive lung disease. Since the actual magnitude of FEV1 is always reduced in parallel with any reduction in FVC, even in the absence of obstruction, it is the ratio of FEV1/FVC which is most useful diagnostically. This ratio should normally exceed 0.75 (75%) in healthy individuals but often falls below 0.5 (50%) when there is increased airways resistance, e.g., in asthma.
4.3 Gas exchange in the lungs and tissues

 affects pulmonary gas exchange.
 ) can be calculated as follows:
Even though CO2 has a higher molecular weight, it diffuses about 20 times more easily than O2 since it is much more soluble in water. Both gases are highly lipid soluble and so pass easily through cell membranes.
Gas exchange in the lungs
Alveolar gases
Room air is chiefly a mixture of N2 and O2, with variable amounts of water vapour and a tiny percentage of CO2 (Table 5). Although the average total pressure in the alveoli is equal to that in the atmosphere, alveolar air differs from the air we breathe (the inspirate) in a number of ways. Firstly, it has a higher water vapour pressure, since the inspired gases become fully saturated as they pass through the airways. The partial pressure of water vapour  in the alveoli always equals the saturated water vapour pressure at 37°C (6.3 kPa; 47 mmHg), irrespective of the total alveolar pressure. Since water molecules have been added to the inspirate, the concentrations of all the other gases in the mix are reduced by dilution (Table 5). This decreases their partial pressures, as illustrated by the changes in gas pressure which result from simply humidifying previously dry room air (Table 6).
Table 5 Concentrations of the gases in dry room air, air completely humidified at 37°C and alveolar air
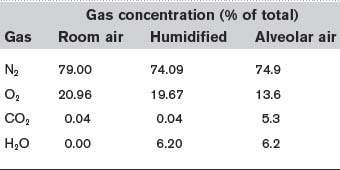
Table 6 Partial pressures of the gases in dry room air, air completely humidified at 37°C and alveolar air
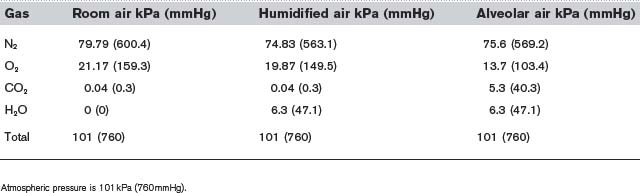
The other major differences between alveolar gas and room air reflect constant removal of O2 by diffusion into the pulmonary blood and constant addition of CO2 from the same source. This reduces the  and elevates the
  as compared with humidified air (Table 6). The actual values achieved depend on the balance between the rate of ventilation and the rates of O2 consumption and CO2 production by the body. If ventilation were to increase without any change in gas use or production, alveolar air would become more like humidified air, with a rise in
  and a fall in
  . This limits the maximum possible alveolar
  to about 20 kPa (150 mmHg), i.e., the value in saturated room air (Table 6), at least while breathing air at normal atmospheric pressure. Higher partial pressures can only be achieved by breathing an oxygen-enriched gas mixture or by increasing the total pressures of the inspirate.
Normally, of course, ventilation is homeostatically regulated so that alveolar  and
and  remain relatively constant (Section 5). As previously explained, the large functional residual capacity during quiet respiration also acts as a buffer against large changes in alveolar gas pressures during each respiratory cycle, since the incoming tidal volume is diluted in a much larger volume of residual pulmonary gas (Section 4.2).
Pulmonary blood gases
Gas diffusion gradients in the lung are determined by the differences between the partial pressures within the alveoli and those within the pulmonary capillaries. The partial pressures of O2 and CO2 in pulmonary arterial blood entering these capillaries are determined by the levels in systemic venous blood from peripheral tissues. Venous blood is mixed in the right ventricle, giving a  in the pulmonary arteries of 5.3 kPa (40 mmHg) and a
  of 6 kPa (45 mmHg). Since the
  in the alveoli is 13.7 kPa (103 mmHg), O2 diffuses into the pulmonary blood. Carbon dioxide, also driven by a partial pressure gradient (Fig. 67), diffuses in the opposite direction, from the capillaries (
 = 6 kPa, or 45 mmHg) into the alveoli (
 = 5.3 kPa, or 40 mmHg). Gas diffusion across the combined alveolar and capillary wall system is rapid, so that pulmonary blood normally equilibrates with alveolar gases before leaving the pulmonary capillary. Thus, the gas pressures in pulmonary venous blood equal those in the alveoli under physiological conditions (Fig. 67).
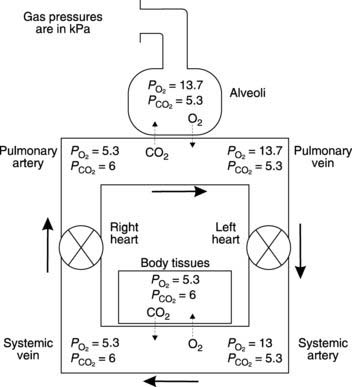
 in systemic arterial blood is somewhat lower than that in the pulmonary veins because of mixing with deoxygenated blood from the bronchial veins. Bronchial blood vessels provide the nutritive needs of the bronchial system, losing O2 and gaining CO2 as they do so, and do not take part in alveolar gas exchange. Bronchial venous blood drains into the left atrium and reduces systemic arterial
  to about 13 kPa (98 mmHg). Thus, the bronchial circulation acts as a shunt, bypassing pulmonary oxygenation.
The diffusion processes described above lead to a change in the gas content of pulmonary blood, as determined by the dissociation curves for O2 and CO2 transport in blood (Section 4.4). Oxygen content normally rises from 15 to 20 ml O2 100 ml−1 blood. At the same time CO2 levels drop from about 52 to 48 ml CO2 100 ml−1 blood. The ratio of CO2 release (4 ml CO2 100 ml−1 blood) to O2 uptake (5 ml O2 100 ml−1 blood) is called the respiratory exchange ratio, which has a value of 0.8 in this case. This ratio is also, though not strictly correctly, referred to as the respiratory quotient. Under steady state conditions the respiratory exchange ratio is determined by the substrates being metabolized by the body and 0.8 is fairly typical for someone on a mixed, Western-style diet (Section 4.7).
Pulmonary diffusion
Pulmonary gases must diffuse through several structures between the alveoli and the capillary blood (Fig. 68). A layer of alveolar fluid lies over the epithelium, which sits on a basement membrane. This may actually fuse with the basement membrane of the capillary endothelium so that the total thickness of the diffusion barrier can be as little as 0.2 μm. Coupled with the large alveolar surface area (about 70 m2), this short diffusion distance makes the lungs very efficient gas exchange units, i.e., they have a high diffusion capacity. If the thickness of the diffusion barrier is increased, e.g., because of an increase in alveolar fluid during pulmonary oedema, or the available alveolar area is decreased, e.g., in emphysema, which involves alveolar destruction, gas exchange will be impaired as a result of the reduced diffusion capacity. This may cause abnormalities in the systemic arterial blood gas levels, even when alveolar ventilation is perfectly adequate.
Ventilation : perfusion ratio
Normal gas exchange requires both that alveoli are adequately ventilated and that they are perfused with pulmonary blood at an appropriate rate. One way of quantifying this relationship is to measure the alveolar ventilation : perfusion ratio,  .
.
This may deviate from normal, a situation which is referred to as ventilation–perfusion mismatch. If an area of the lung is perfused but inadequately ventilated,  will obviously be reduced. As a result, the alveolar
  falls and the
  rises since less ‘fresh’ air is brought into the alveoli than normal. In the most extreme case, where
  (perfusion with no ventilation), alveolar gas pressures will become equal to those in pulmonary arterial blood (Fig. 69). Blood passing through such a region will be inadequately oxygenated and this will reduce the final
  in the systemic arterial blood. Thus, areas with a decreased
  increase the physiological shunting of blood. This is a major factor contributing to the abnormal blood gases seen in many respiratory diseases.
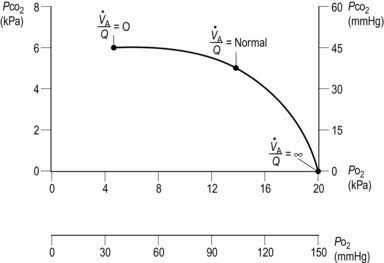
 ratio. As
  increases,
  increases and
  decreases. Three specific points on the curve are indicated. When
  (i.e., perfusion with no ventilation), alveolar
  (5.3 kPa) and
  (6 kPa) equilibrate to the values in pulmonary arterial blood. When
  (i.e., ventilation with no perfusion), alveolar
  (20 kPa) and
  (0 kPa) become equal to the values in humidified air. The intermediate point plots the alveolar
  (13.7 kPa) and
  (5.3 kPa) when
  is normal.
Where alveoli are ventilated but not properly perfused,  will be increased. Such regions contribute less than they should to pulmonary gas exchange so they add to the physiological dead space. In the absence of gas diffusion in and out of the pulmonary blood, alveolar
  rises and
  falls. In the most extreme case, where pulmonary flow equals zero (i.e.,
  ), the alveolar gas pressures become equal to those in humidified room air (Table 6; Fig. 69). This can occur in regions of the lung affected by a pulmonary embolus, a travelling blood clot which completely obstructs one of the pulmonary arteries.
 = 4 L min−1 (alveolar ventilation rate) ÷ 5 L min−1 (pulmonary blood flow) = 0.8. The local value of
  varies with posture. The upper regions of the lung are more poorly ventilated and more poorly perfused than the bases. When standing, however, the increase in ventilation between the apex and the base of the lung is much smaller than the parallel increase in perfusion, so that
  decreases as one moves towards the base. At the apices of the lungs
  is about 3.0 (contributing to the physiological dead space), but this falls to about 0.6 at the bases (which contribute to the physiological shunt).
Measurement of pulmonary gas exchange
The efficiency of gas exchange in the lungs is often measured in terms of the transfer factor for carbon monoxide (TCO). This is added to the inspired air at very low concentrations (CO is poisonous; Section 4.4). The increase in arterial CO content over a short period of time is then measured to provide a value for the rate of CO absorption. Since haemoglobin has an extremely high CO affinity, essentially all the absorbed CO becomes attached to the haemoglobin leaving none in the plasma. This means that the pulmonary arterial PCO can be assumed to be zero, so that the diffusion gradient driving CO absorption equals the alveolar PCO, which is measured. From this the transfer factor for CO can be calculated.
Gas exchange in peripheral tissues
The pressure gradients driving peripheral gas exchange are normally dictated by  and
and  levels within a given tissue, since systemic arterial blood gas pressures are kept constant, with a
  of about 13 kPa (98 mmHg) and a
  of 5.3 kPa (40 mmHg). Tissue gas pressures may vary widely from organ to organ and time to time, depending on the balance between blood flow and local metabolic activity, which consumes O2 and produces CO2. Average values are about 5.3 kPa (40 mmHg) for
  and 6 kPa (45 mmHg) for
  , so the pressure gradients favour O2 diffusion from the blood into the interstitium, while CO2 diffuses in the opposite direction. Systemic capillary blood equilibrates with the interstitial fluid so that systemic venous gas tensions equal those in the interstitium (Fig. 67). On average, resting body tissues take up O2 at a rate of about 5 ml 100 ml−1 blood flow, and release CO2 at about 4 ml 100 ml−1 blood.
4.4 Gas transport in blood
Oxygen transport
Haemoglobin
Various factors may reduce the O2-carrying capacity of blood. Simplest, and most common, is a reduction in the concentration of haemoglobin, a condition known as anaemia. This may arise in various ways, although nutritional deficiencies and chronic blood loss are probably the commonest causes in Western society (Section 2.3). The O2-carrying capacity of the blood is proportional to the haemoglobin concentration, and this explains the main symptoms of anaemia, which include weakness, tiredness and reduced exercise tolerance. The normal haemoglobin concentration is about 15 g dl−1 in males and 13 g dl−1 in females (1 dl = 0.1 L = 100 ml). Since each gram of haemoglobin can carry 1.34 ml of O2, this equates to O2 capacities of 20 and 17.5 ml 100 ml−1 blood, respectively.
Some conditions reduce the ability of the haemoglobin molecules to carry O2 (reduce their O2 affinity). For example, if the Fe2+ is converted to Fe3+, then the O2-binding capability is greatly reduced. Certain drugs can oxidize haemoglobin in this way, forming methaemoglobin. Carbon monoxide can also interfere with O2 transport since it binds very tightly to haemoglobin, leading to a build-up of carboxy-haemoglobin. Little unbound haemoglobin is left for O2 transport.
Oxygen dissociation curve
This sigmoid, or S-shaped curve describes the relationship between the partial pressure of O2 and the concentration of O2 in blood (Fig. 70A). As  is raised from zero to 2 kPa the O2 content of the blood also rises, slowly at first and then more rapidly. The shape of this initial part of the curve reflects the fact that there are four O2 binding sites on each haemoglobin molecule. When one site attaches to O2, the O2-binding ability of the other sites is increased and so the rate of rise of O2 concentration also increases. This phenomenon is known as cooperativity, since the separate haemoglobin subunits cooperate in their function. As the
  is increased further, more and more O2 is carried in the blood until all the available sites on haemoglobin are occupied (saturation); the curve reaches a plateau at a
  of around 16 kPa (120 mmHg). Further increases in
  have little effect on O2 transport.
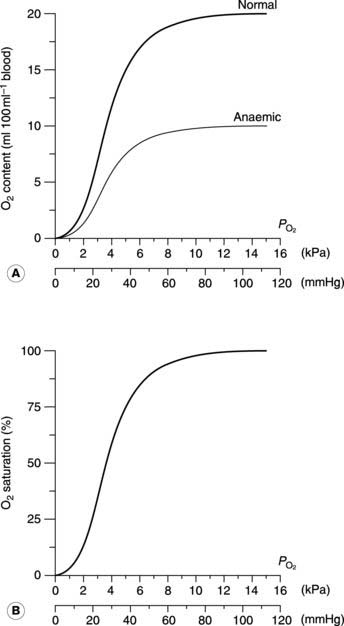
The quantity of O2 carried depends on the haemoglobin concentration, so that a 50% reduction in haemoglobin (from 15 to 7.5 g dl−1) also reduces the oxygen content at the plateau (the O2-carrying capacity) by half (Fig. 70A). It is important to appreciate, however, that this only alters the height of the dissociation curve; its shape is not affected by the haemoglobin concentration. Plotting the O2 concentrations in the normal and anaemic samples as percentages of their own maximum values, i.e., in terms of the O2 saturation of the blood, produces identical curves (Fig. 70B). Any change in this saturation curve indicates a change in the O2-carrying properties of the haemoglobin itself, rather than a change in haemoglobin concentration.
Using the O2 dissociation curve to determine O2 uptake
The O2 dissociation curve can be used to determine how much O2 will be released into the body tissues for a given fall in O2 pressure. Under normal conditions, blood is 97% saturated at the  of systemic arterial blood (13 kPa, 98 mmHg). Saturation only falls to 75% on reducing the
  to 5.3 kPa (40 mmHg), the value found in systemic venous blood (Fig. 70B). With a haemoglobin concentration of 15 g dl−1, this is equivalent to a tissue O2 uptake of 5 ml O2 100 ml−1 blood (Fig. 70A). These processes are reversed as deoxygenated blood passes through the pulmonary capillaries. The
  is initially raised to 13.7 kPa (105 mmHg), although this is then reduced to 13 kPa (98 mmHg) by mixing with deoxygenated blood shunted through the bronchial circulation (Section 4.3). The net result is the absorption of the same amount of O2 from the alveoli as was given up to the peripheral tissues.
Much higher than average rates of O2 uptake may be achieved in rapidly metabolizing organs, in which case the tissue  falls below normal. If the
  were to fall to 2.7 kPa (20 mmHg), for example, O2 saturation would fall to 25% (Fig. 70B), yielding an additional 10 ml O2 100 ml−1 blood with a normal haemoglobin concentration. Quantitatively, this is the most important mechanism whereby tissue extraction of O2 from blood may be increased.
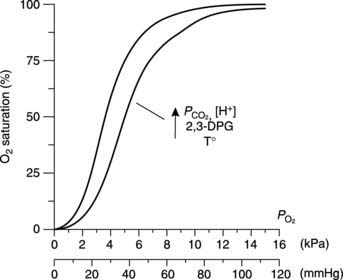
Factors which alter the O2 dissociation curve (Bohr effect)
Changes in the conditions under which the O2 dissociation curve is measured can change its shape. For example, if the CO2 level in the blood is increased then the curve is shifted to the right, so that O2 saturation is lower for a given  than would otherwise be the case (Fig. 71). This is the Bohr effect and, as a result, the O2 dissociation curve for systemic venous blood, which has an elevated
  , lies slightly to the right of that for arterial blood. This increases O2 extraction as blood passes through actively respiring tissues, although the effect is relatively small. As blood passes through the lungs the
  falls again, shifting the curve back to the left.
< div class='tao-gold-member'>
Stay updated, free articles. Join our Telegram channel

Full access? Get Clinical Tree


