Figure 14-1. Flow chart showing inclusion/exclusion of studies in the off-pump versus on-pump coronary artery bypass graft surgery (CABG) meta-analysis.
*Sensitivity analyses that included the studies excluded because they were limited to subgroups based on particular demographic or clinical characteristics (e.g., patients age ≥75 years, or patients with diabetes) or because they used risk adjustment strategies that did not account for the relevant risk factors for mortality recognized by the Society of Thoracic Surgeons were conducted to ensure these exclusions did not bias our results. The sensitivity analyses extended to these excluded studies confirmed the study results.
3. Data abstraction: The processes used to abstract the data from the articles considered in the meta-analysis are critical and should be designed to warrant the highest validity and reliability of the information collected. A standardized data collection tool that clearly specifies exactly what information needs to be collected from each article should be created and used by the research team abstracting data.
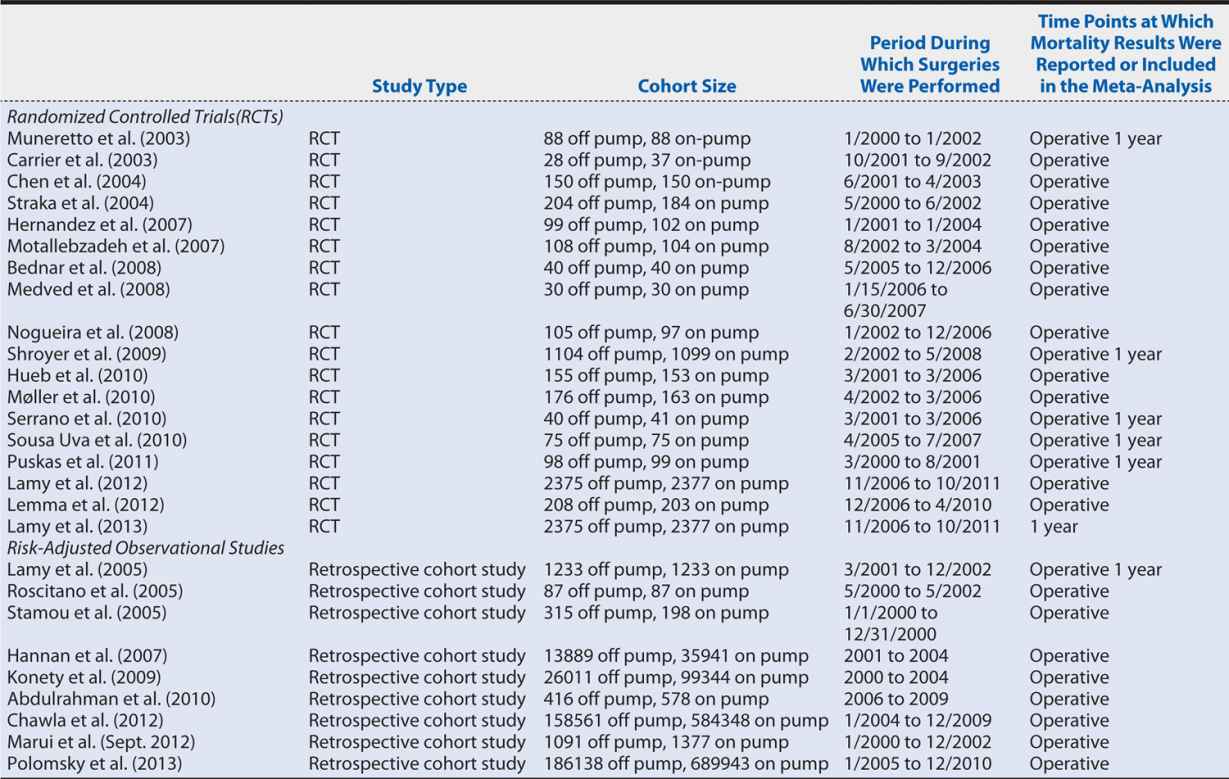
Continuing with the off-pump versus on-pump CABG meta-analysis, two members of the research team independently abstracted the necessary data from each article. This duplication of data collection increases the reliability of the process because any discrepancies between the abstractors’ data sets are investigated and resolved. For our meta-analysis, we collected data from each article regarding the participants (cohort size and number of subjects in each study group), the interventions (off-pump or on-pump CABG), type of study (RCT or observational study), and the number of all-cause deaths (or adjusted estimated all-cause deaths for observational studies) at each time point reported in the article. These data are entered into RevMan 5.2 (meta-analysis software). Table 14-1 shows the characteristics of the included studies.
Table 14-1. Characteristics of the studies included in the on-pump vs. off-pump CABG meta-analysis.
4. Assessment of risk of bias: The internal validity of the meta-analysis depends on whether the data and results from the included studies are valid (i.e., the studies were conducted rigorously) and generalizable. Accordingly, a meta-analysis of poor-quality studies will have low internal validity and is likely to produce biased results. The evaluation of the risk of bias of the included studies is critical because it influences interpretation and the conclusions of the review.
The specifics of how to collect and report the risk of bias data depend very much on the tool chosen to assess it. A good option, particularly when all or most of the included studies are RCTs, is the Cochrane Collaboration’s RCT Bias Assessment Tool (see http://handbook.cochrane.org/chapter_8/table_8_5_a_the_cochrane_collaborations_tool_for_assessing.htm), in which the risk of bias in a specified set of categories is judged to be at low, high, or unclear risk. Other tools may be more appropriate when focusing on observational studies, and including both RCTs and observational studies in the same systematic review may require some adaptation to enable one tool to be applied consistently across all studies.
For the on-pump versus off-pump CABG meta-analysis, which includes both RCTs and risk-adjusted observational studies, we used an adaptation of the Cochrane Collaboration tool, assessing each article for the following domains:
• Random sequence generation (applicable to RCTs only): Were patients properly randomized?
• For RCTs, (1) were the intervention groups balanced (e.g., gender)? (2) Was intention-to-treat analysis used (i.e., patients randomized to off-pump CABG who underwent on-pump CABG were analyzed as patients belonging to the off-pump group)?
• For observational studies, (1) were the same I/E criteria applied to the on-pump and off-pump CABG groups? (2) Did the reported characteristics of the two groups show imbalance? c) Were the appropriate risk adjustment methods applied?
• Detection bias: Were different methods used to assess mortality or survival between the on-pump versus off-pump CABG groups?
• Attrition bias: Was there a high rate (>20%) of loss to follow-up?
• Reporting bias: Were some prespecified outcomes not reported?
• Other sources of bias: Were patients converted from off-pump to on-pump CABG during surgery analyzed as part of the off-pump group or on-pump group, or were they excluded?
As for the data collection, we had two members of the research team independently review each article and enter the risk of bias data into RevMan 5.2. Figure 14-2 summarizes the results of the risk of bias assessment, showing an overall fairly low risk of bias.
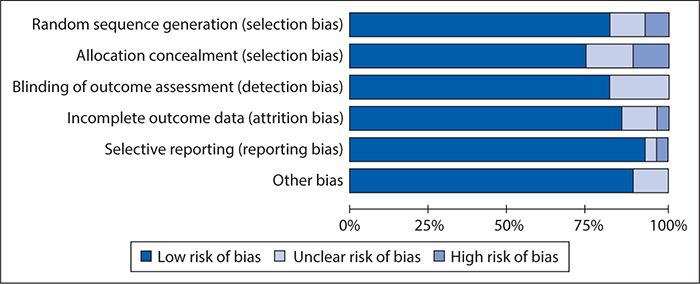
Figure 14-2. Results of risk of bias assessment of studies included in the off-pump versus on-pump coronary artery bypass graft surgery meta-analysis using an adapted version of the Cochrane Collaboration’s RCT Bias Assessment Tool.
5. Publication bias: In some instances, studies’ publication is affected by the study findings; most commonly, this takes the form of studies showing nonsignificant associations between the intervention and the outcome of interest not reaching publication. Publication bias is an important issue to consider when conducting a systematic review because the internal validity of the systematic review heavily depends on the evidence included in (or omitted from) the review. Because the researcher conducting a systematic review seldom has any practical means of determining which studies have remained unpublished, let alone of obtaining their results, reporting bias frequently has to be assessed solely based on the published studies. This can be done via a scatter plot (funnel plot) that depicts the intervention effect estimates from individual studies against some measure of each study’s size or precision. An asymmetrical plot suggests publication bias may be present (i.e., some studies showing nonstatistically significant effects are not published).
Figure 14-3 shows a funnel plot for the studies included in the off-pump versus on-pump CABG meta-analysis, produced using RevMan 5.2 and plotting the intervention effect (odds ratios for operative mortality) on a logarithmic scale. This plot does not show asymmetry (skewing of results to either the right or left), indicating that there is little risk of publication bias.
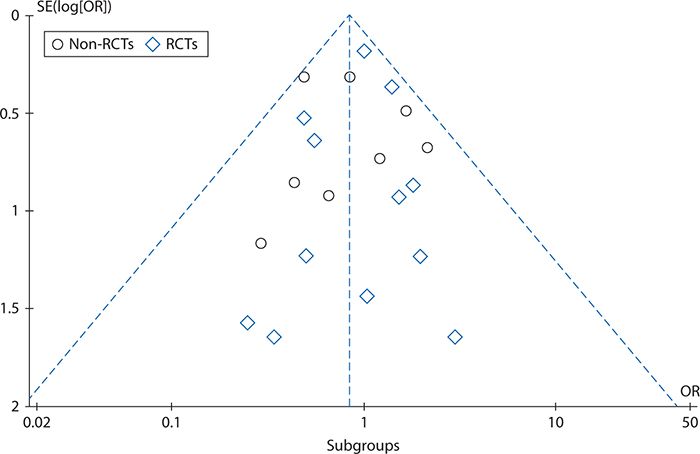
Figure 14-3. Funnel plot to assess reporting bias in the off-pump versus on-pump coronary artery bypass graft surgery meta-analysis. OR, odds ratio; RCT, randomized controlled trial; SE, standard error.
6. Measures of association (statistical analysis and data synthesis): The estimation of the measure of the association depends on the type of outcome: binary, continuous, categorical (more than two level outcome) or ordinal, counts or rates, or time to event. Table 14-2 summarizes the measures of association for each type of outcome.
Table 14-2. Systematic review measures of association by outcome.
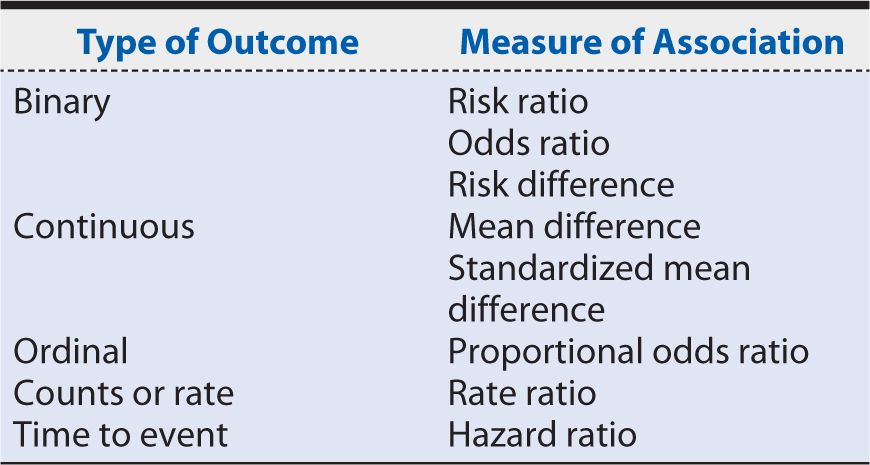
In the on-pump versus off-pump CABG meta-analysis example, we estimated an odds ratio (operative mortality), risk ratio (1-year mortality rate), and 95% confidence intervals (95% CI) based on Mantel-Haenszel chi-squares to compare mortality after off-pump versus on-pump CABG.
7. Heterogeneity: The intervention effects of the studies included in a meta-analysis might vary because of random error alone or due to differences in studies’ methodologies (e.g., outcome assessment procedures, study population, study design). This variation is commonly known as heterogeneity. When intervention effects show different directions and magnitudes between studies, the heterogeneity is more likely to be attributable to methodologic differences between studies, and a meta-analysis cannot be performed. In this case, a qualitative review of the evidence may be presented instead. In contrast, when the intervention effects have the same direction but different magnitudes between studies, the heterogeneity is more likely to be attributable to chance, and it is appropriate to conduct a meta-analysis to summarize the available evidence. In this case, a random-effect model (which assumes that the effects being estimated in the different studies are not identical but that the studies methods are similar) should be used. A fixed-effect meta-analysis should be used when there is no heterogeneity, as this model assumes that the true effect of the intervention is similar (in both magnitude and direction) across studies. It is important to specify a priori whether a random- or fixed-effect model will be used.
Reviewing the articles included in our on-pump versus off-pump CABG example, the methods are sufficiently similar for a meta-analysis to be appropriate, and a random-effect model is clearly called for, given the conflicting results between studies and the possible variation associated with the intervention effects’ differences. Using RevMan 5.2 to assess the heterogeneity that existed among the included studies, we see in Figure 14-4 that although all studies’ intervention effects had the same direction, their magnitudes greatly and significantly varied. This confirms that the choice of a random-effect model to summarize the available evidence was appropriate.
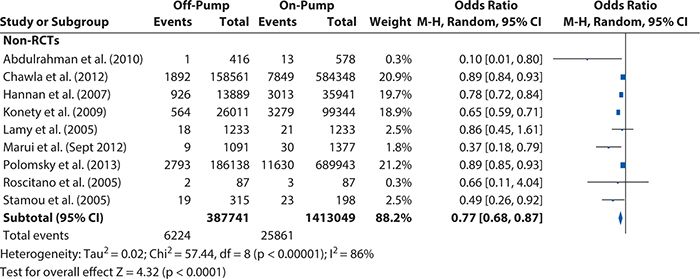
Figure 14-4. Heterogeneity test results for the non–randomized controlled trials included in the off-pump versus on-pump coronary artery bypass graft surgery meta-analysis. CI, confidence interval; M-H, Mantel-Haens el.
el.
8. Sensitivity analysis: Performing a meta-analysis involves a series of decisions, specifically, choosing a search strategy, the study I/E criteria, and the measures of association that are of interest; assessing the sources of heterogeneity (and deciding whether a meta-analysis is appropriate); and choosing the types of sensitivity analysis that need to be performed. In some situations, decisions might be arbitrary, making the meta-analysis findings susceptible to bias. To assess whether the meta-analysis results are independent from the investigator’s decisions, a sensitivity analysis should be performed by repeating the primary analysis, substituting alternative decisions that were arbitrary or unclear (e.g., include the excluded studies in the analysis).
In our on-pump versus off-pump CABG meta-analysis example, we needed to assess whether our findings were biased by our study exclusion criteria. Accordingly, we repeated our primary analysis and included the studies we excluded because the study population was limited to patients with a particular demographic or clinical characteristic, and we compared the results with the results from the primary analysis. The results (not shown here) were very similar; therefore, the sensitivity analysis supported our study findings.
9. Presentation of results: A very intuitive and clear way of presenting findings from a meta-analysis is with a Forest plot. The Forest plot shows not only the overall effect (and associated 95% CI) estimated from the meta-analysis, but for each included study, it shows the raw summary data, including the total number of patients by intervention or control group, the total number of events (mean and standard deviation are used for continuous outcomes) by intervention or control group, the percent weight (the “weight” the individual study contributes to the overall effect), and the weighted (depending on the cohort size) point estimate (i.e., intervention effect). Revman 5.2 further automatically includes the results of a heterogeneity test, a chi-squared statistic, and a test for differences across subgroups in the Forest plot, which aid in interpretation.
Figures 14-5 and 14-6 show the Forest plots, respectively, for short-term and 1-year mortality rates from the on-pump versus off-pump CABG meta-analysis produced using RevMan 5.2. For short-term mortality, the results when all studies were included favored off-pump CABG (odds ratio [95% CI] = 0.80 [0.72, 0.88]), although no significant difference was observed in the subgroup of RCTs (odds ratio [95% CI] = 1.00 [0.76, 1.32]). At 1 year, there was no significant difference in mortality regardless of whether all studies were considered (risk ratio [95% Cl] = 1.03 [0.86, 1.25]) or only the subgroup of either RCTs (risk ratio [95% CI] = 1.08 [0.87, 1.33]) or observational studies (risk ratio [95% CI] = 0.90 [0.60, 1.34]).
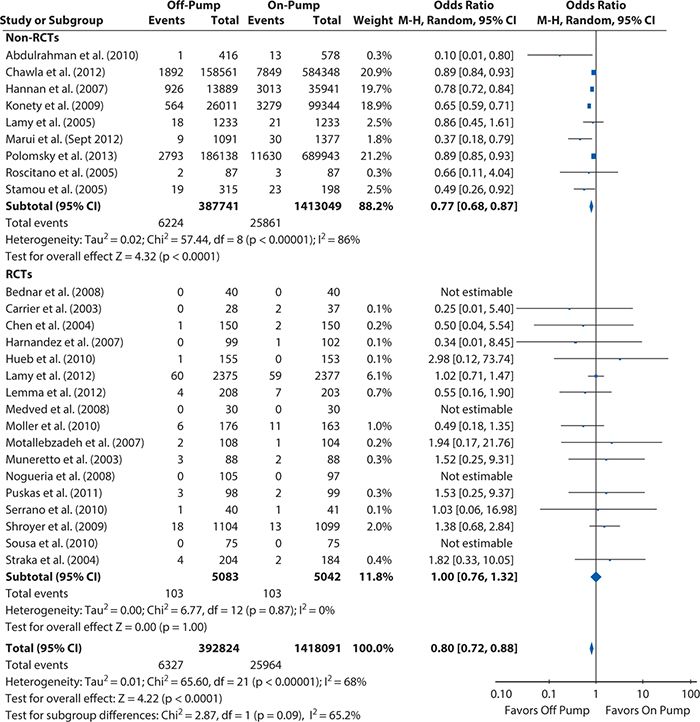
Figure 14-5. Systematic review example: Forest plot summarizing meta-analysis results for short-term mortality (operative or in-hospital). CI, confidence interval; M-H, Mantel-Haens el; RCT, randomized controlled trial.
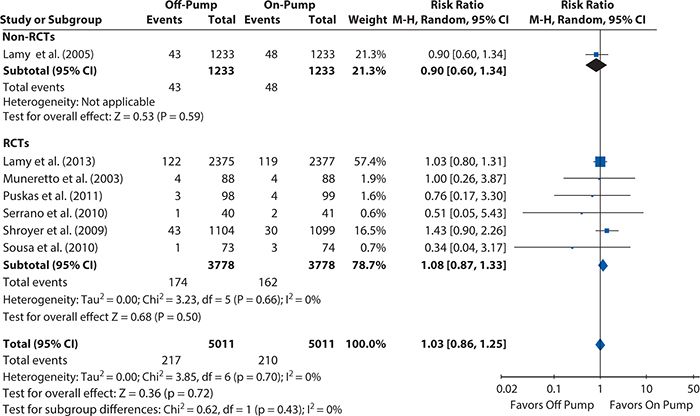
Figure 14-6. Systematic review example: Forest plot summarizing meta-analysis results for 1-year mortality. CI, confidence interval; RCT, randomized controlled trial.
Finally, when writing up the systematic review for publication, the standards laid out in the Preferred Reporting Items for Systematic Reviews and Meta-Analyses (PRISMA) Statement should be followed. Most peer-reviewed journal articles require this (including submission of the PRISMA checklist) for publication. Details on the PRISMA statement, including the PRISMA checklist and a template for creating the flow diagram for studies included and excluded in the systematic review, are available at http://www.prisma-statement.org.
It is a good idea to consult the PRISMA checklist at the start of the systematic review process to ensure one records all of the information necessary to comply with the PRISMA standards (e.g., reasons why studies were excluded) along the way.
HEALTH SCENARIO CONCLUSION
When Dr. S. and Mr. P. from the opening Health Scenario meet again as scheduled, Dr. S. explains the findings from this quantitative systematic review of the evidence to Mr. P. Given that there is little evidence of even a short-term benefit with off-pump CABG and none that lasts through the first year after surgery, Dr. S. recommends that Mr. P. also take into account the fact that although some local surgeons do perform off-pump CABG, the surgical teams are generally, like himself, more experienced with the on-pump technique. Mr. P. considers all the information provided to him and decides that, in light of the evidence and the local practice experience, on-pump CABG is the best option for him.
SUMMARY
In this chapter, we looked at the process and methods involved in conducting a quantitative systematic review of the published literature using the example of comparing mortality rates after off-pump versus on-pump CABG.
Before starting a quantitative systematic review, it is critical to develop a meta-analysis protocol, specifying the systematic search that will be conducted, the I/E criteria that will be applied, how the data will be abstracted from included studies, how the risk of bias will be assessed, and how the data will be analyzed (fixed-effect vs. random-effect model) and presented.
The systematic search must identify the relevant studies to include. PubMed is an excellent—and free—tool for such work, and it is worth taking the time to learn how to effectively use MeSH terms to search efficiently. It is also worth seeking the help of a medical librarian in designing the search! A step that should not be skipped in any systematic review is reviewing the reference lists of previous reviews and recent large studies addressing the topic to be sure there are no additional relevant articles that the search missed.
The second vital step in a rigorous systematic review is the prespecification of clearly defined I/E criteria for the articles that will be considered for inclusion. If possible, at least two people should independently review the candidate articles for I/E, their results compared, and discrepancies resolved to ensure that these criteria are applied accurately and consistently.
After the final set of included articles has been determined, abstraction of the study data and assessment of the risks of bias can begin. A standardized data collection form should be developed and used, and, again, two people should independently abstract and review each article to increase reliability through the identification and resolution of discrepancies. After resolution, the data can be entered into meta-analysis software such as RevMan 5.2 for easy data management and analysis.
The assessment of bias is essential because the internal validity of a meta-analysis depends on the validity of its included studies. In addition to biases the included studies may carry, the possibility of publication bias—in which studies reporting nonsignificant results are less likely to be published—needs to be considered and assessed via a funnel plot. Whereas a symmetrical funnel indicates low risk of publication bias, an asymmetrical funnel suggests it may be present.
Heterogeneity of the results between included studies needs to be considered as it determines, first, whether a meta-analysis (summarizing results into a single point estimate) is appropriate, and, second, if it is, the type of statistical model needed to summarize the results. When the magnitude and direction of the effect size vary between studies and the heterogeneity test is significant, a meta-analysis should not be performed, and the summary of the evidence should be qualitative. When the intervention effects have the same direction but their magnitudes vary between studies and the heterogeneity test is significant, a random-effect model is needed. When no significant heterogeneity is present, a fixed-effect model should be used. Because rigorous methodology requires the type of model to be specified before any analysis is done, formal tests for heterogeneity are typically done after the analysis is complete to confirm that the right model was chosen.
Results from the chosen model are typically best presented in a Forest plot, which combines a graphic and tabular display of the individual included studies’ intervention effect sizes, as well as the summary result and information about heterogeneity and differences between any subgroups that were broken out.
Quantitative systematic reviews of the evidence are immensely valuable to the practice of evidence-based medicine. When a large volume of published studies with contradictory or inconsistent results has developed for a particular topic, quantitative systematic reviews can distil those findings down to a meaningful, synthesized result. Such summaries of the evidence can support the development (or updating) of evidence-based clinical practice guidelines or be applied directly by clinicians to treatment recommendations and by both clinicians and patients during shared decision making. Systematic reviews are also valuable in demonstrating when evidence—or, at least, good-quality evidence—is lacking and further research is needed before any conclusions about a “best practice” can be drawn.

1. Is it appropriate to summarize available evidence when study designs, populations, treatments or interventions, exposures, and outcomes of the studies included in the systematic review are not similar?
A. No
B. Yes, if the heterogeneity test is not significant
C. Yes, independently of the heterogeneity test is not significant
D. It depends on the number of studies considered in the meta-analysis
2. What should be considered in determining the search strategy for a meta-analysis?
A. The time that it will take to read the manuscripts identified from the search
B. The study hypothesis and number of possible studies that the search will return
C. The study hypothesis, research questions, and the database in which the search is to be conducted
D. The research questions and the number of possible studies that the search will return
3. Can a meta-analysis be limited to non-RCTs studies only?
A. Yes, if published non-RCTs have similar methods, sound findings and report adjusted results, and all published RCTs evidence suffer from evident methodologic problems or their study designs and method vary significantly
B. No
C. It depends on the number of studies included in the meta-analysis
D. Yes, independently of the non-RCTs’ methods and whether RCT evidence is available
4. Why it is critical to assess the risk of bias of the evidence considered in a meta-analysis?
A. Study analysis will be easier
B. Studies suffering from bias are difficult to understand
C. The sensitivity analysis will be easier
D. To ensure that the meta-analysis has good internal and external validity
5. Dr. F. is executing a meta-analysis, and he is uncertain on whether he can use a fixed-effect model to estimate the overall effect. In which of the following scenarios is it appropriate to use a fixed-effect model?
A. The intervention effect is similar (in both magnitude and direction) across studies, but the study designs and methods are very different
B. The intervention effect is similar (in both magnitude and direction) across studies, and the study designs and methods are very similar
C. The heterogeneity test result is significant
D. All estimates from the studies included in the meta-analysis were computed using fixed-effect models
6. Dr. B. is executing a sensitivity analysis to confirm her meta-analysis findings. Which of the following scenarios is appropriate?
A. Remove all the studies with significant estimates and rerun the primary analysis
B. Remove all the studies with nonsignificant estimates and rerun the primary analysis
C. Add all the studies removed due to differences in how they assessed the study outcome and rerun the primary analysis
D. Add all the studies removed because they focused on particular patient populations and rerun the primary analysis
7. Dr. B. has been asked to comment on the outcome he investigated in his meta-analysis; the overall effect odds ratio (95% CI) was 0.80 (0.72, 0.88). Which type of outcome did Dr. B. consider in his analysis?
A. Ordinal
B. Rate
C. Continuous
D. Binary
Stay updated, free articles. Join our Telegram channel

Full access? Get Clinical Tree


